abhilash
Member
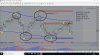
Metatrader Indicators: 3 Level ZZ semafor; dynamic Zone and pa invers fisher; Hull ribbon, TM setting 4H and h1 TM555 20 period – 2.5 deviation (current time frame); TM555 30 period – 2.4 deviation (240min time frame); TM555 30 period – 2.4 deviation (1440 time frame time frame); BST Trend; Super fast. Trading rules SR Interpretation Buy Wait until an area of support is formed. Make sure that this support area is tested by the action of the price. Getting into buying when the trend indicators align: super fast blue bar, hull crosses upward the TM555 and and inverse fisher blue line . Sell Wait until an area of resistance is formed. Make sure that this resistance area is tested by the action of the price. Getting into selling when the trend indicators align: super fast red bar, hull crosses downward the TM555 and inverse fisher red line. Exit position Profit target ratio 1.3. Stop loss below/above S/R area.