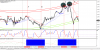
COG and MBFX timing indicator works differently depending on the time frame you use and how you calibrated it. You also need another validation indicator and a sharp understanding of price action... I use ADX without the signal Line and designed the strategy based on the patterns that show up on the ADX. (Nimbus cloud, Diamond and Bat). Green dotted line ascending = Bulls in Power and Red line descending = Bear weakness. Their convergence and divergence paints a clear picture as to where the price is headed and validates entries and exits... Moving averages (50+100) Exponential MA's works well for spotting Golden crosses and Death crosses and they also work as immediate support and resistances. Here are some of my screen shots. I use it on intraday Time frames. NB: Save the calibrated setup as a template so you can apply it on charts under analysis every time you put up a chart... Values of COG
*Bars_Back: 288 (3days)
*m: 2
*i: 0
Kstd: 2.0
(sName) I figure it has no effect.
Good luck guys!!!!