


skrimon
Active Member
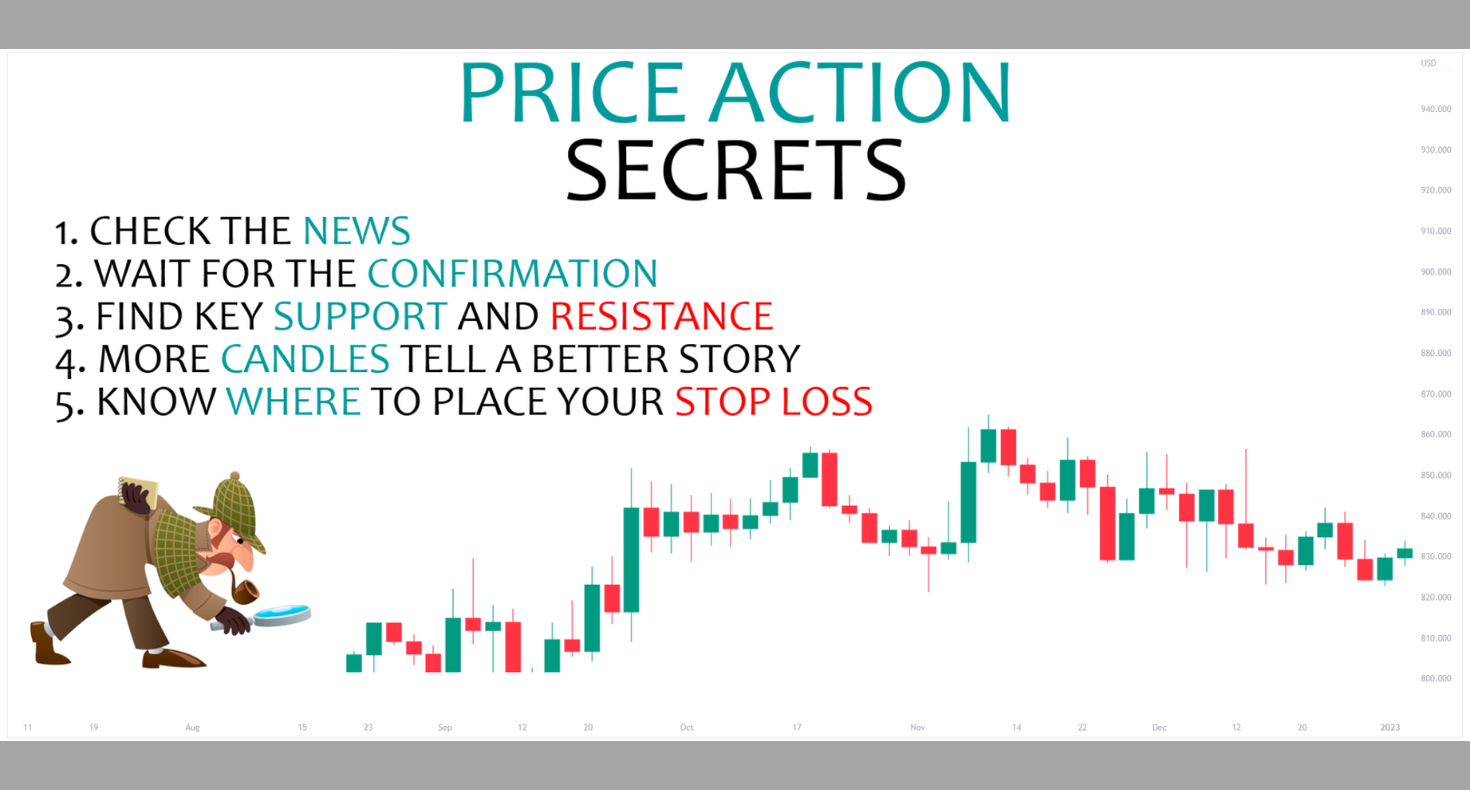
The greater the number of candles in a certain pattern, the greater its reliability. Three candle patterns are superior to single candle patterns. 30 candle patterns are typically superior to 3 candle patterns. Because of this, patterns such as head and shoulders, double, and triple tops are among my favorites. They constantly result in trades with a higher likelihood, which is what we all seek. It just indicates that there is a greater likelihood that these multi-candle setups will result in profitable trades. It does not imply that a good pin bar setup will not work.
Know where to place your stop loss
merely knowing where to place an order is insufficient. Where do you position your stop loss? Stop-loss levels that are fixed in pips are a poor strategy, as market volatility can fluctuate, and each trade should be evaluated in light of recent market history.
Always look for confluence
This is undoubtedly one of the most vital facts you must uncover. Confluence is the only thing that matters.
So you've discovered a fantastic price action setup. Great! Ensure that it has confluence, or aligns with other valid indications that support your trading strategy.
Tell a story of what happened
Every chart conveys information. It might be a story of clear direction or of buyers and sellers engaging in ugly back-and-forth conflict. Similarly, we may distinguish between clean price action and muddy price action. It is up to the trader to uncover the tale and gain a better understanding of the market's likely behavior.
Context is everything
You should interpret a price action setup differently depending on its location. The identical pin bar can be bullish or bearish depending on whether it appears at the bottom of a downtrend or the peak of an uptrend. Not all patterns are profitable if they are not preceded by the appropriate price action and occur at levels that are significant in some way.
Identify key support & resistance zones
On a price chart, support and resistance (or S&R for short) are regions where the price reverses at its lowest point (support) and its highest point (resistance). Traders frequently "test" these zones numerous times in search of higher buying and selling activity near these levels. Noting that support and resistance are typically not thin lines, but rather zones, is crucial.
The Bottom Line
The price action strategy is one of the most powerful tools for extracting money from the markets with predictability and manageable risks, but only if used correctly.
Like, comment and subscribe to boost your trading!