What's new

Forex Updates by Solid ECN

5.00 star(s) 1 Vote

Understanding Bitcoin’s Recent Price Recovery​


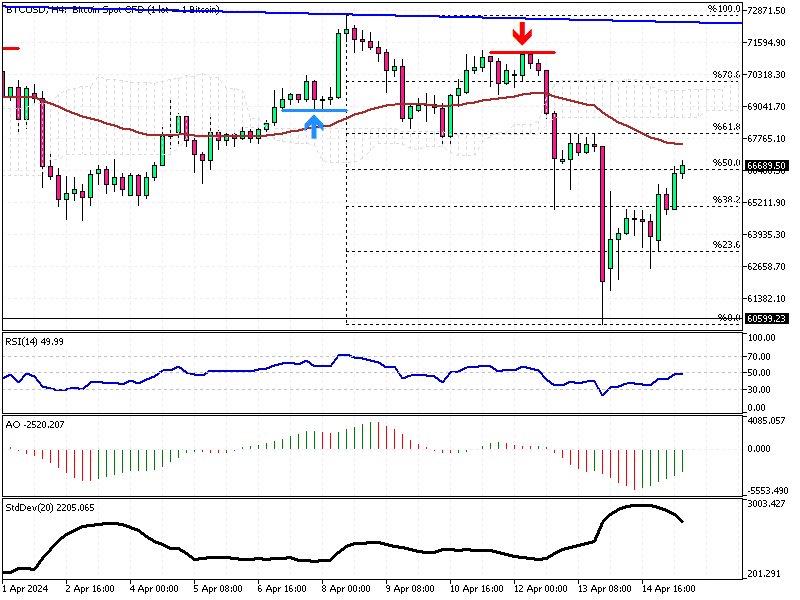
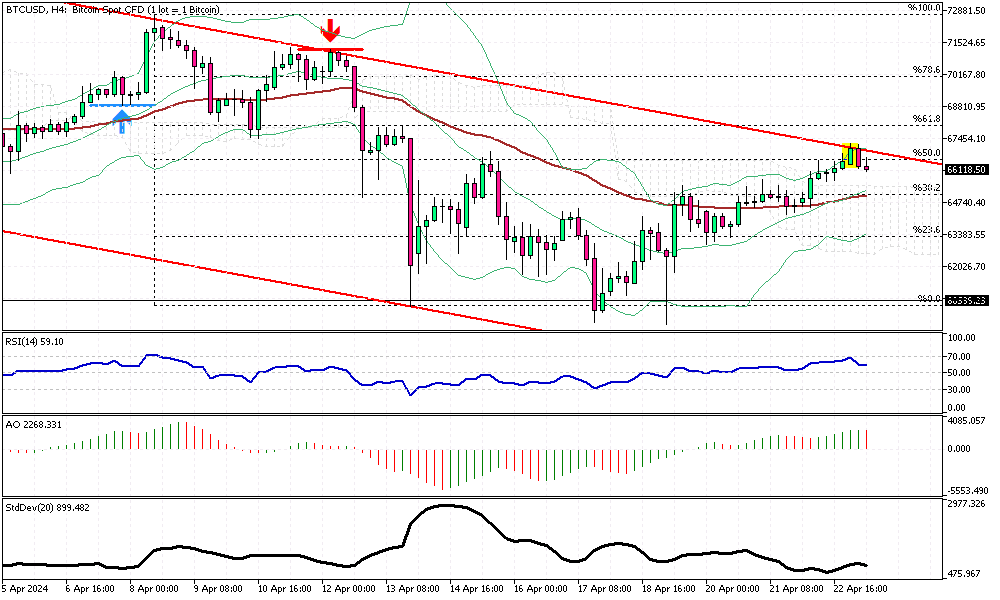
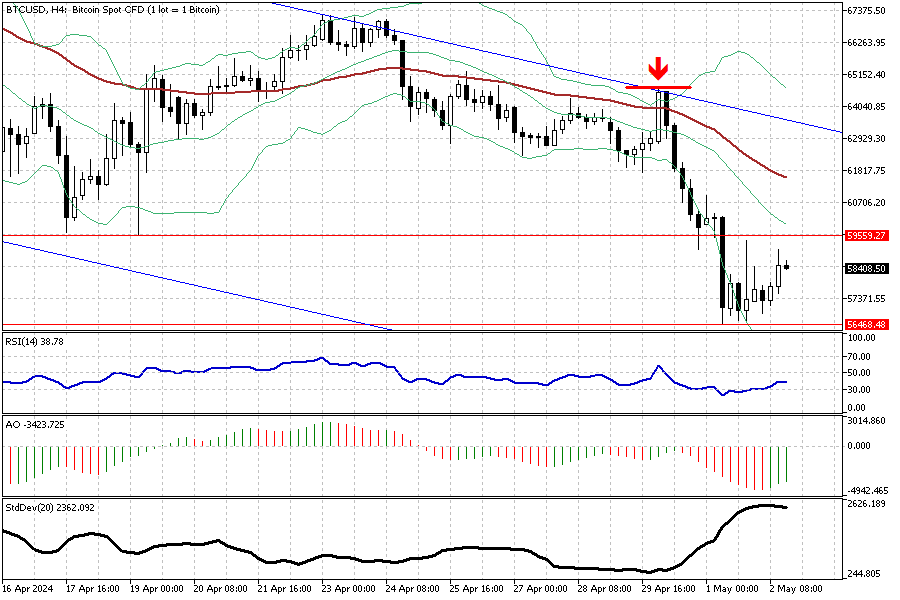
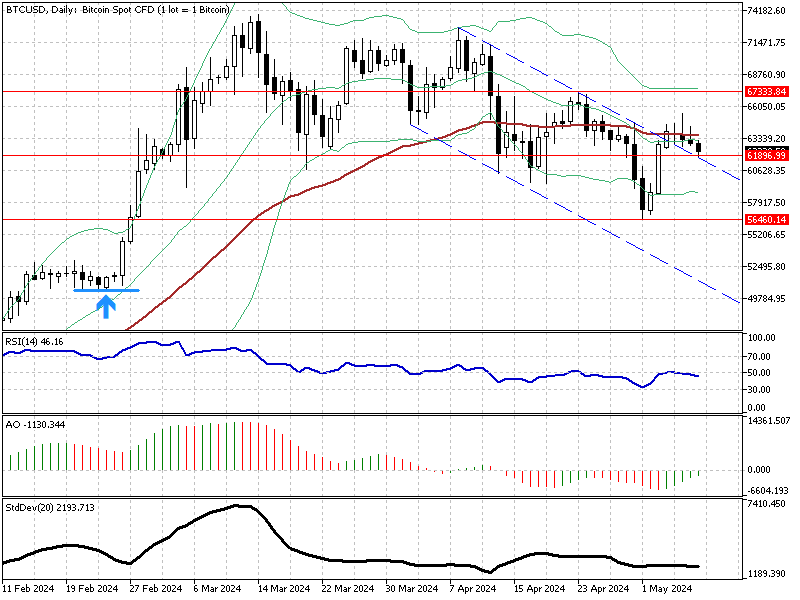
Bitcoin's price has rebounded from the $60,600 resistance, coinciding with the lows of April 5 and 20. This recovery was anticipated as the RSI indicator was previously in the oversold territory. As of this writing, the indicator is showing bullish signs, having flipped above the 50 level.

Consequently, the BTCUSD pair remains bullish, although it is currently trading below the Ichimoku cloud. The next bullish target is likely the upper band of the flag around $72,000. However, the bulls face the EMA 50 as a barrier, suggesting that there might be a consolidation phase or a minor pullback to the 38.2% Fibonacci support level before the uptrend resumes. This is particularly plausible considering the standard deviation indicator is losing momentum.

A critical factor keeping the market bullish is the $60,600 mark. Should the Bitcoin price dip below this level, the bullish scenario would need to be reevaluated.​
 

Bullish Gold: Navigating the Upswing with Fibonacci and Technical Indicators​


The gold price returned upward after it touched the 38.2% Fibonacci level, which coincides with the EMA 50 and the Ichimoku cloud, at the $2,324 mark. Interestingly, the XAU/USD 4-hour chart formed a bullish long-wick candlestick pattern, which signals the continuation of the bull market.

The yellow metal is trading at about $2,370 as of this writing, slightly above the 23.6% Fibonacci support, and the technical indicators are bullish as well. The RSI indicator hovers above the 50 level, and the Awesome Oscillator bars are green and above the signal line.

From a technical perspective, as long as the price remains above the EMA 50 and inside the flag, the market trend remains bullish. The next target will likely be April’s high at the $2,432 mark.

On the flip side, the bull market is invalidated if the XAU/USD price dips below the 38.2% Fibonacci support.​
 

USDCHF Dips but Bullish Trend Holds​


The USDCHF currency pair experienced a slight decline, touching down at approximately 0.910. This movement brings it close to the lower boundary of the bullish flag—a pattern suggesting a potential rise in value. This specific price point is bolstered by additional support at 0.908 and further underpinned by the Ichimoku cloud.

Despite the dip, no significant candlestick patterns used to forecast price direction changes were observed on the USDCHF 4-hour chart. This absence typically indicates that the current upward trend may continue, provided the price remains above the Ichimoku cloud. Should this scenario hold, the U.S. Dollar will likely climb toward the 0.915 mark, aiming next for the upper boundary of the bullish flag.

However, there is a flip side to consider. If the price falls below 0.9062, it would signal an end to the bullish trend, transitioning into a bear market. Such a drop could increase selling pressure, potentially pushing the price to around 0.899.​
 

Tracking the Dip: U.S. Oil's Technical Outlook​

Solid ECN – Oil is trading within a bullish flag pattern, indicating potential for future gains. However, it's crucial to note that it remains above the 50-day Exponential Moving Average (EMA 50), a key indicator that suggests bullish momentum is intact. Nevertheless, the plot has a twist as the technical indicators hint at a bearish trend. The Relative Strength Index (RSI) has dipped below 50, and the Awesome Oscillator shows red bars declining toward the signal line. This combination of signals might indicate a potential shift towards bearish territory, especially if prices continue to fall towards the 50% Fibonacci level, which coincides with the EMA 50.​


Short-Term Forecast and Trading Suggestions​

The market appears to be entering a consolidation phase, with a possible decline to the lower boundary of the bullish flag at $76.0. For the bearish trend to gain momentum, prices must breach significant support levels, including the EMA 50 and the psychological $80.0 mark. Traders should closely monitor these levels as they could dictate the market's short-term direction.

Today, we expect the downward trend to extend to the $80.0 support level. If this level fails, further declines could push the price to approximately $77.0 per barrel. Keeping up-to-date on these developments is crucial for traders and market analysts alike.​
 

GBPUSD Sideways Movement: Bearish Signals Despite Consolidation​


Solid ECN—The GBPUSD currency pair trades sideways between 1.249 and 1.240. The Bollinger Bands are squeezed and demonstrate the range area on the 4-hour chart. Other technical indicators, except Standard Deviation, signal and promise a bullish trend while the uptick momentum is weak, and we don't see strength from the buyers.

From a technical standpoint, the primary trend is bearish while the pair hovers below EMA 50 and the Ichimoku cloud. However, the current consolidation phase might test the EMA 50 again in today's trading session, potentially forming a double-top pattern on the 4-hour chart.

Consequently, a failure to stabilize the price above 1.2499 will likely lead to a decline, and initially, the pair would test this week's low at 1.240 support.​
 

Navigating USDCAD's Bearish Momentum & Reversals​


The USDCAD price dipped below the bullish flag, and the EMA 50 is currently trading at about 1.372. This level coincides with the Ichimoku cloud resistance area, which is also close to the 38.2% Fibonacci level. While the RSI indicator hovers below the 50 level, it still has room to drop to 30 or become oversold. Therefore, it can be interpreted that the downward momentum will likely continue but might pause when it reaches the 38.2% Fibonacci level.

The current bearish momentum should be considered as a consolidation phase of the primary trend, which is bullish.

From a technical standpoint, going against the primary trend is risky. Traders should wait and monitor the price action around the 38.2% Fibonacci support level and the bearish flag in the 4-hour chart, depicted in black.

We suggest waiting patiently for the price to climb above the EMA 50 and the 23.6% Fibonacci level and join the bullish trend if there is a new breakout.​
 

Bitcoin Faces Resistance: Can It Break the $67K Barrier?​


Solid ECN – Bitcoin, often called digital gold, has reached a critical resistance level around the $67,236 mark. The upper band of the wide bearish flag and the 50% Fibonacci support level support this barrier.

Technical indicators are signaling the bull market will continue. The BTCUSD price is above the Ichimoku cloud, and the relative strength index and the awesome oscillator hover above 50.

For the uptrend to continue, the price must close and stabilize itself above the 50% Fibonacci level, a task it has failed to achieve in today's trading session. Interestingly, the BTCUSD 4-hour chart has formed a bearish engulfing pattern, a signal that suggests a shift in trend from a bull to a bear market.

Therefore, if the price remains below the flag, a dip in the Bitcoin price is still possible.

We suggest monitoring the price behavior around the 50% Fibonacci level and the EMA 50 in today's trading session.​
 

Gold Prices Stable as Investors Eye U.S. Economic Data​


Solid ECN – Gold prices remained stable at around $2,320 per ounce last Thursday. Investors focused on upcoming U.S. economic updates to get more precise insights into the Federal Reserve's future actions. This interest grew after recent economic reports were reviewed. Orders for long-lasting goods slightly exceeded forecasts in March. However, data released on Tuesday showed a slowdown in growth in the U.S. private sector.

Now, traders are looking forward to the GDP report for the first quarter and the personal consumption expenditures (PCE) data for March, which will be released on Friday. These reports follow a period of higher-than-expected consumer inflation, which has altered the expectations for interest rate reductions. Federal Reserve officials have recently indicated no immediate plans to lower rates, with most market participants expecting a rate cut in September at the earliest.

As interest rates stay elevated, the appeal of gold, which does not yield interest, diminishes. Additionally, decreasing tensions in the Middle East have led investors to opt for riskier assets, further affecting gold prices.​
 

Swiss Franc Stabilizes as Inflation Eases, Rate Hike Possible​


The Swiss franc has stabilized at about 0.91 against the USD, recovering from significant losses earlier in the year that dropped to a six-month low. This change happened due to big differences in the anticipated monetary policies of the US and Switzerland. In March, Switzerland's yearly inflation rate decreased to a low of 1%, not seen in over two years, reinforcing the Swiss National Bank’s (SNB) statement that inflation pressures are easing.

This comes as business optimism declines and retail sales shrink, prompting speculation that the SNB might increase interest rates in its next meeting in June. Previously, the franc fell sharply when the SNB unexpectedly cut rates in March, becoming the first major central bank to do so amid current global inflation concerns.

Additionally, with a more stable inflation forecast, the central bank has been able to reduce its support for the franc, leading to an increase in foreign currency reserves for the third consecutive month since hitting a seven-year low in November.​
 

Euro Stays at $1.07 Amid ECB and Fed Policies​


The euro stayed at $1.07, continuing its fall against the US dollar. This trend is driven by the belief that the European Central Bank (ECB) will adopt a gentler approach than the US Federal Reserve. Recent data reveals that inflation in the Eurozone remained at 2.4% in April, as expected. The core inflation rate, however, dropped slightly to 2.7% from 2.9%.

This supports the possibility of an interest rate cut by the ECB in June. In the first quarter, the Eurozone's economy grew by 0.3%, beating expectations of a 0.1% increase. This suggests a recovery from the slow growth seen since the end of 2022. Meanwhile, the US Federal Reserve has kept interest rates high for the sixth time. They plan to keep rates steady until they are sure inflation will consistently reach their 2% goal.​
 

Bitcoin Analysis: Resistance Turned Support Insight​


Solid ECN – Bitcoin trades in the bearish channel, as shown in the BTCUSD daily chart. Bears managed to close below the $59,598 resistance and are stabilizing the price below this level. As of writing, the BTCUSD pair trades near the broken resistance, which now acts as support.

From a technical standpoint, the trend remains bearish, and Bitcoin might dip to $50,940 in the next selling pressure. For the scenario to come into play, the price should remain below the median line of the Bollinger band.

Conversely, if the BTCUSD price closes above the support at $59,559, the consolidation phase would extend further to the upper band of the flag.​
 

Gold Prices Steady as Investors Wait​


Solid ECN – Gold prices remained stable at around $2,300 per ounce this Friday, marking the lowest level in four weeks. Investors are maintaining caution as they await the release of the US non-farm payroll data later today. This significant economic indicator will provide insights into the Federal Reserve's future monetary policy decisions.​

Federal Reserve and Economic Indicators​

The Federal Reserve opted to keep interest rates unchanged last Wednesday, indicating a possible inclination toward future rate reductions. However, concerns over recent disappointing inflation figures might delay these cuts. Moreover, the stable number of new unemployment claims last week suggests a tight labor market, which is likely to bolster the economy throughout the second quarter.​

Geopolitical Developments Impacting Gold​

Easing geopolitical tensions in the Middle East, particularly the growing optimism for a ceasefire agreement between Israel and Hamas brokered by Egypt, has also influenced gold prices. As a result, the precious metal is set to register a 1.6% decline this week, marking its second consecutive weekly drop.​
 

US Jobs Data Weakens Dollar​


Solid ECN – The euro recently climbed towards $1.08, reaching its highest since April 9th. This rise comes as traders adjusted their forecasts for potential cuts in interest rates, influenced by a surprisingly weak US jobs report. The latest figures showed that the US economy added only 175,000 jobs last month, falling short of expectations. This underperformance has led investors to anticipate that the Federal Reserve might reduce interest rates earlier than previously thought, possibly as soon as September.​

Impact of US Economic Data​

The jobs report showed fewer jobs created and indicated that annual wage growth has slowed to 3.9%. Additionally, the jobless rate unexpectedly increased to 3.9%. These factors contribute to a growing belief among traders that the US economy might need stimulus sooner rather than later, influencing currency values.​

European Economic Stability​

Contrastingly, in Europe, economic indicators have been more stable. Recent data revealed steady inflation rates and moderate GDP growth within the Eurozone. These factors strengthen the argument for the European Central Bank (ECB) to consider reducing interest rates by June. As a result, the euro has gained strength against the dollar, reflecting differing economic forecasts between the US and Europe.​
 

NZ Dollar Dips Amid US Stability​


Solid ECN – The New Zealand dollar recently fell to $0.6 against a stabilizing US dollar. This shift came as fresh economic indicators suggested a potential cut in US interest rates later this year. Concurrently, the Kiwi mirrored the Australian dollar's downturn after the Reserve Bank of Australia opted to maintain its current interest rates, adopting a less aggressive stance than many anticipated.​

Geopolitical Influences​

Investors closely monitor the Middle East, where recent developments could impact global markets. Following Hamas's acceptance of a ceasefire in Gaza proposed by mediators, tensions remain as Israel did not agree to the terms, continuing military operations in Rafah and planning further negotiations.​

New Zealand's Economic Outlook​

In New Zealand, despite market expectations leaning towards an interest rate cut by October, fueled by recent weaker employment figures, the central bank has indicated it might hold off on easing monetary policy until 2025. This decision is based on persistently high inflation rates in the year's first quarter.​
 

Silver Prices Bounce Back​


Solid ECN – Silver prices have risen above $27 per ounce after a dip to one-month lows near $26.3 last week. This rebound aligns with other precious metals and reflects investor anticipation of a possible interest rate cut by the Federal Reserve in September.

The recent U.S. jobs report, which did not meet analysts' expectations, has further convinced traders that the Fed might reduce interest rates later this year. Such economic signals are critical for investors looking to understand potential market movements.

Additionally, silver's demand increased as investors sought safe-haven assets following a military operation in Rafah by Israel, prompting evacuation warnings to Palestinian civilians. This situation has added to the precious metal's appeal during geopolitical uncertainty.​
 

BTC Bulls Eye Higher Targets Despite Price Dip​


Solid ECN – Bitcoin broke out of the descending trendline (in blue), but the bulls failed to stabilize the price above the EMA 50 and the middle line of the Bollinger Band. Consequently, the pair formed a long-wick bearish candle on the daily chart. As of this writing, the BTC/USD pair has dipped and is currently testing the broken resistance at $61,896.

The technical indicators provide mixed signals. RSI hovers below 50, but AO is bullish, showing a green line.

From a technical perspective, the bullish outlook remains valid if the BTC/USD price remains above $61,896. In this case, the next target could be $67,333.

On the flip side, the downtrend will resume if the price falls below the support level, with $56,460 as the next support level.​
 

NZDUSD: Fed Officials Hint at Prolonged Rates​


Solid ECN – The New Zealand dollar (NZD) has shown a minor decline to $0.59, influenced by a slight rise in the US dollar. This movement comes as traders anticipate crucial US economic data that might hint at the Federal Reserve's timing for interest rate reductions. The US will soon disclose figures on jobless claims and consumer sentiment, with significant inflation data on the horizon.​

Fed's Strategy on Interest Rates​

Comments from Federal Reserve officials, particularly Fed Bank of Boston President Susan Collins, suggest a cautious approach to monetary policy. Collins indicated that high interest rates might persist longer than expected to mitigate inflation, affecting forex market dynamics.​

Anticipation of NZ Central Bank​

In New Zealand, the focus shifts to the upcoming central bank meeting scheduled for May 22nd. With inflation exceeding initial forecasts, the bank is poised to maintain the interest rate at 5.50%. This decision could shape the short-term trajectory of the NZD in forex markets.​
 

EURUSD Bearish Outlook​


Solid ECN – As of the latest trading session, the Euro continues to decline, trading at approximately 1.07 against the U.S. dollar, notably below the 38.2% Fibonacci retracement level. The current technical indicators support the bearish outlook; the Awesome Oscillator (AO) has dipped below zero, while the Relative Strength Index (RSI) remains under the median line, suggesting weakened momentum.

The EUR/USD downtrend appears poised to continue as it trades below a significant descending trendline. The primary resistance level is at the 50% Fibonacci level of 1.079.

If this resistance holds, the downtrend initiated on May 3rd will likely extend, potentially reaching a target of 1.069. This target aligns with the ascending trendline and the 23.6% Fibonacci level, providing a technical confluence that supports the bearish scenario.​
 

EURUSD Technical Analysis​


EUR/USD rose from the 61.8% Fibonacci retracement level yesterday and is now testing the descending trendline near 1.07.

The technical indicators are bullish, but for the uptrend to resume, the price must close and stabilize above the trendline. If this happens, the euro will strengthen against the dollar, with the next milestone likely at 1.088.

We recommend closely monitoring price movements near the bearish trendline and checking lower timeframes, such as the 4-hour chart, for bearish candlestick patterns. If the bulls fail to close above the trendline, EUR/USD could face renewed selling pressure, potentially pushing the price down to the 50% Fibonacci support level.​
 

Bulls Eye Key Breakout for EURUSD Rally​


Solid ECN – The EURUSD currency pair pulled back from last week's trading session's 61.8% Fibonacci support level. As of posting, the pair trades around the 1.078 mark, clinging to the descending trendline on the 4-hour chart.

Technical indicators suggest a bullish trend. However, for the uptrend to continue, the bulls must close and stabilize the price above 1.079. If this scenario comes into play, the European currency will likely gain more ground against the U.S. dollar, with 1.081 as the initial target, followed by the 1.083 mark.

Conversely, the downtrend will likely continue if the EURUSD price dips below the 1.075 minor support. In this case, bears would test the 1.073 level, followed by the 50% Fibonacci support.​
 

Create an account or login to comment

You must be a member in order to leave a comment

Create account

Create an account on our community. It's easy!

Log in

Already have an account? Log in here.

Similar threads

Users Who Are Viewing This Thread (Total: 1, Members: 0, Guests: 1)

Top
AdBlock Detected

We get it, advertisements are annoying!

Sure, ad-blocking software does a great job at blocking ads, but it also blocks useful features of our website. For the best site experience please disable your AdBlocker.

I've Disabled AdBlock    No Thanks