What's new

Forex Updates by Solid ECN

5.00 star(s) 1 Vote

Anticipated Rise of Pound Sterling: A Clear Signal from Technical Indicators​


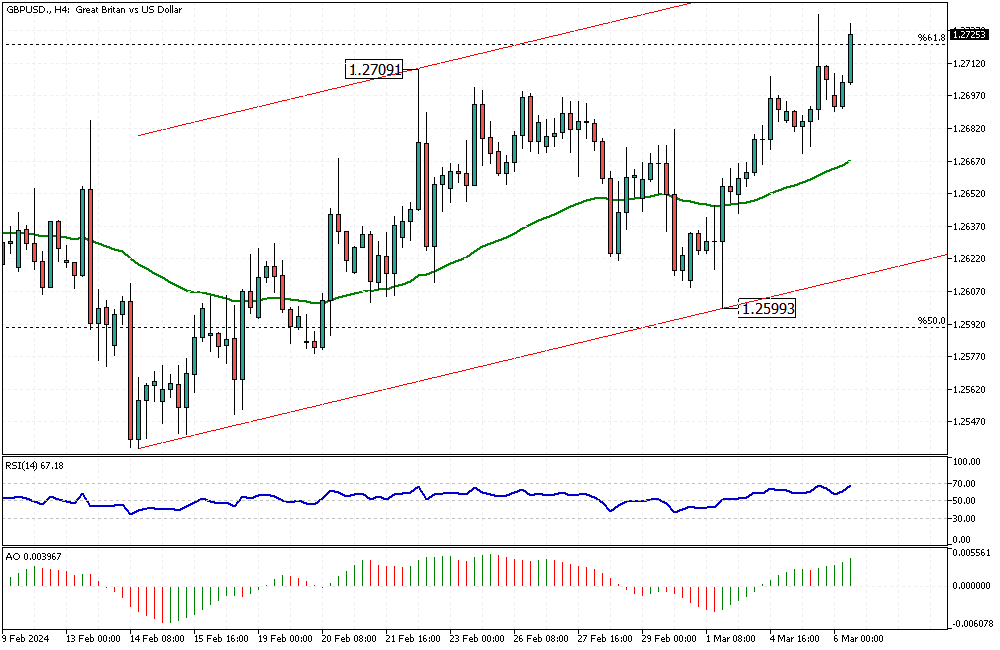
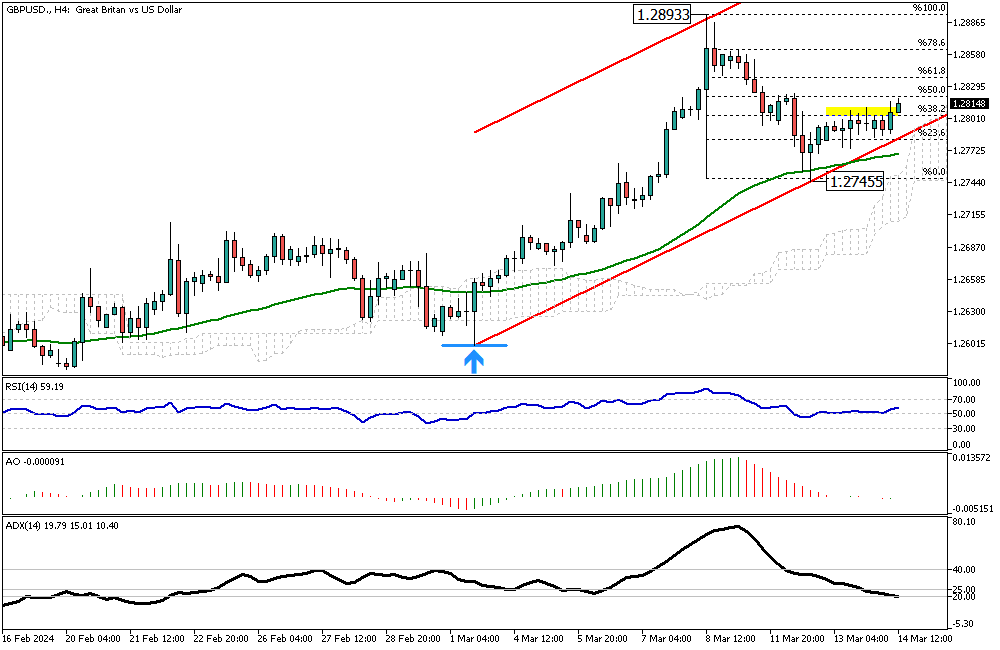
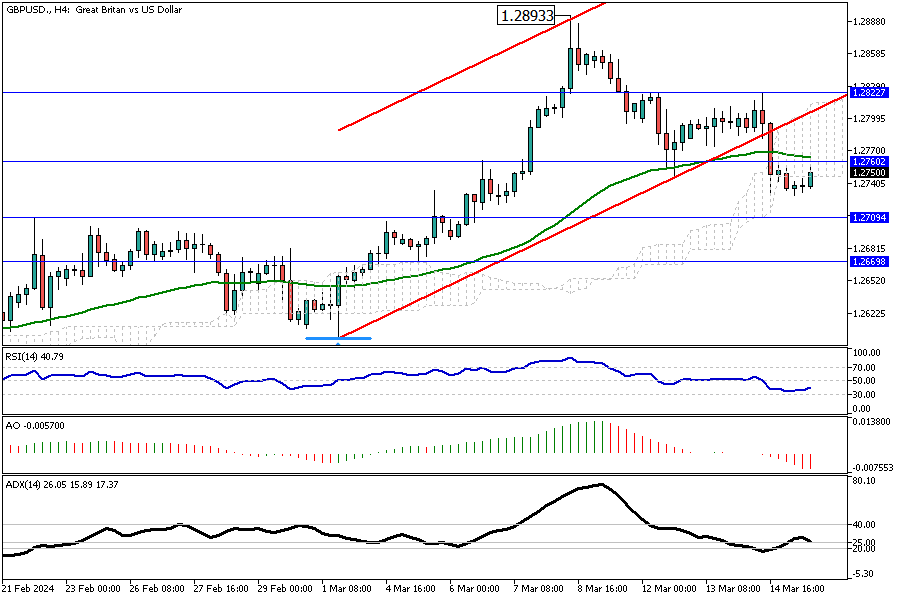
As anticipated, the pound sterling has once again ascended from the resistance zone of the Ichimoku cloud, starting from 1.2621. Today, the technical indicators are providing a more distinct signal. With the RSI flipping above the median line and the appearance of green bars on the awesome oscillator, we can forecast that the bull market will likely expand further.

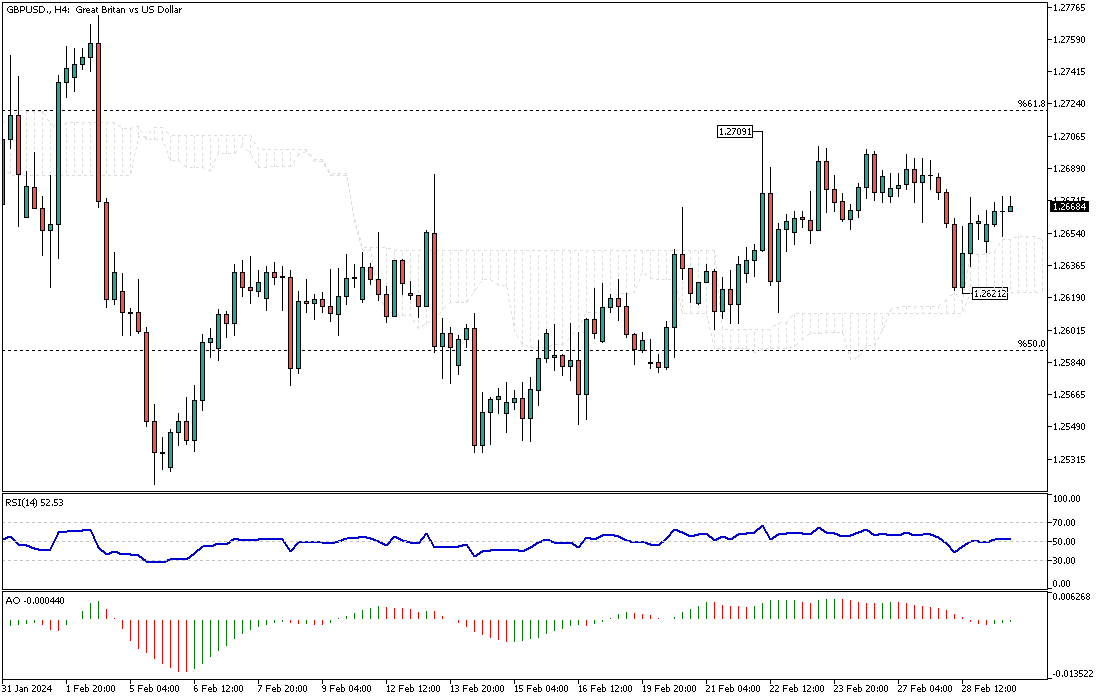
The first significant milestone for the bulls is reaching the February high of 1.2709. Interestingly, this resistance level is reinforced by the 61.8% Fibonacci retracement, adding to its significance.

However, it's important to note that if the GBPUSD price falls below the cloud, the validity of the bull market could be called into question. This is a crucial point to remember as we monitor market trends.​
 

AUDUSD Analysis: Breaking Bullish Trends and Testing Fibo Level​


Solid ECN – The U.S. dollar broke below the ascending bullish channel in yesterday's trading session against the Australian dollar. Interestingly, the pair tested the broken support, which now acts as resistance, specifically at the 50% Fibonacci level or the 0.6521 mark.

The technical indicators give mixed signals: the RSI is bearish, while the Awesome Oscillator signals a bull market.

Based on the price action, the 50% Fibonacci level plays as resistance, and it is expected for the downtrend to extend to the 78.6% Fibonacci support, followed by the February low at 0.6442.

The bearish outlook for the AUD/USD pair should be invalidated if the price stabilizes itself above the 50% Fibonacci level.​
 

Gold Price Analysis: Potential Bullish Breakout​


Solid ECN – The yellow metal is testing the $2,037 mark. What distinguishes this resistance area is its conjunction with the 61.8% Fibonacci level and the descending trendline, depicted in blue.

Upon examining the price action, we observe that the divergence in the awesome oscillator couldn't initiate a shift in the market. Consequently, the Gold price remained above the 50% Fibonacci level and the Ichimoku cloud. With the RSI indicator hovering above the 50 lines, it is likely for the price to make a bullish breakout and climb to the 78.6% Fibonacci resistance, corresponding to the $2,048 mark.

On the other hand, if the XAU/USD price dips and stabilizes below the 50% Fibonacci support, the bullish analysis will be invalidated. In such a scenario, the price might experience a further decline to the 38.2% level.​
 

EURUSD Analysis: A Close Look at Key Fibonacci Levels​


Solid ECN – The EURUSD is trading around 1.0856, slightly below the 38.2% Fibonacci retracement level. Interestingly, the bulls have managed to break above the bearish channel. However, Euro buyers must overcome the 1.0865 barrier for the uptrend to continue. The technical indicators support a bullish market, with the RSI hovering above 50 and the Awesome Oscillator bars turning green and rising above the signal line.

From a technical standpoint, the bulls will likely target the 50% Fibonacci retracement level if they can stabilize the price above 1.0865.

Conversely, if the EURUSD price falls below the 1.0796 mark, representing the 23.6% Fibonacci support, the decline that began in December 2023 will likely resume.​
 

AUDUSD Experiences Pullback from Fibonacci Level​


Solid ECN – The Australian dollar has crossed below the 0.648 resistance level against the U.S. Dollar. The pair bounced from the 78.6% Fibonacci support level and is trading at approximately 0.648 at the time of writing. Upon examining the AUDUSD 4-hour chart, we notice that the price is declining within the bearish channel. The technical indicators support the primary trend, with the RSI hovering below 50, and the Awesome Oscillator bars are red and below the signal line.

Currently, the pair is experiencing a pullback from the aforementioned Fibonacci level, which may extend to the 61.8% resistance level, followed by the upper band of the flag.

From a technical standpoint, the AUDUSD is in a bear market, and the downtrend will likely continue. The next target could be 0.6442, the lower low of February.

Conversely, the bear market should be considered invalid if the AUDUSD price rises above 0.6524, above the 50% Fibonacci resistance level.​
 

EURUSD Bulls Eyeing 1.0865 Resistance for Continued Uptrend​


The EURUSD currency pair is stabilizing itself outside the previously broken bearish channel. Currently, the pair trades slightly below the 38.2% Fibonacci resistance level, around 1.086. For the uptrend to continue, the bulls must overcome the 1.0865 barrier. This resistance level has been holding the Euro from further growth against the U.S. Dollar since February 22.

Conversely, if the EURUSD price falls below the 50 EMA, the decline would likely target the 1.0796 support level, the 23.6% Fibonacci mark. If this scenario plays out, the sellers will find themselves in the bearish flag again, and the push will likely go deeper, aiming for the February low.​
 

RSI Indicator Predicts GBPUSD Bullish Trend Continuation​


Solid ECN – The GBPUSD currency pair has climbed above 1.2709, exceeding the 61.8% Fibonacci resistance level. RSI and Awesome Oscillator support this rise, which suggests continuing the trend. The RSI has room to reach the 70 level, which can be interpreted as the market not being overbought yet. This indicates that the pound sterling will likely target the bullish channel's upper band against the U.S. dollar.

Please note that the bull market will remain valid if the pair trades above the 50% Fibonacci retracement level.​
 

AUDUSD Momentum: Indicators Point Towards Continued Uptrend​


The Awesome Oscillator shows optimistic signs of a trend reversal, having flipped above the signal line. Additionally, the RSI hovers above 50, another cue for continuing the uptick momentum from 0.6476. This minor area supports the bullish momentum. It is worth noting that the price needs to stay above this level for further growth. The bull market will likely aim for the 23.6% Fibonacci resistance level in this scenario.

Conversely, the bullish outlook should be invalidated if the AUDUSD price dips below 0.6511.​
 

Euro Hits New High Amid ECB Meeting Anticipation and Inflation Data Insights​


Solid ECN – The euro rose sharply to $1.085, reaching its highest point since February 1. This spike was due to investors focusing on the European Central Bank's (ECB) next meeting about monetary policy later this week. They are looking for new information on the ECB's plans. Although the bank is expected to keep interest rates high, market participants are eager to hear any updates to economic forecasts and hints from ECB President Christine Lagarde about when borrowing costs might start to decrease.

Recent data showed that inflation in the Eurozone dropped again last month, making it the second month of decline, with a rate of 2.6% in February—a bit higher than the predicted 2.5%. The fundamental inflation rate also fell to 3.1%, above the expected 2.9%. This information suggests that the ECB is careful before reducing monetary policy measures.​
 

EURUSD Strategy: Bullish Channel and Fibonacci Support Insights​


Solid ECN—The EURUSD currency pair started the week slightly below Friday's closing price. At the time of writing, it is trading at about 1.094.

While the technical indicators provide mixed signals, the pair remains within the bullish channel and tested the 50% Fibonacci support on Friday. The primary trend is bullish, supported by the 38.2% Fibonacci level. As the trend suggests a bullish market, we recommend going long. If the price consolidates near the EMA 50, this could provide an excellent opportunity to join the bull market.

Conversely, the bullish outlook should be invalidated if the EURUSD price drops below 38.2%.​
 

NZDUSD Outlook: Technical Indicators Suggest Ongoing Bullish Trend​


Solid ECN – The NZDUSD currency pair formed a long-wick candlestick pattern in Friday's trading session, which suggests a possible trend reversal from an uptrend to a downtrend. The technical indicators still signal a bull market; as we know, all technical indicators are inherently lagging.

From a technical standpoint, if the price stabilizes below the 38.2% Fibonacci support following Friday's wick, it could extend to 23.6%. Otherwise, the bull market will continue, and the next target could be the 61.8% Fibonacci level.​
 

EURUSD's Next Move: Navigating Above 1.091 Key Support​


Solid ECN – The EURUSD formed a hammer candlestick pattern on the 4-hour chart, clinging to the 50% Fibonacci support level at the 1.0914 mark. As of writing, the pair is trading at about 1.093, slightly above the resistance. While the European currency gains ground against the U.S. dollar within the bullish channel, the technical indicators do not offer significant insights.

From a technical standpoint, the next target would be 1.1 if the price maintains its position above 50%.

Conversely, if the price dips below the 50% level, it will likely decline to the 38.2% level, coinciding with the lower band of the channel.​
 

GBPUSD's Potential Downshift and Support Levels​


Solid ECN – The pound sterling has pulled back from a significant level, the 78.6% Fibonacci resistance against the U.S. Dollar, resulting in the pair trading below 1.2827. Concurrently, the RSI indicator has retreated from the overbought area and is heading toward the 50 level.

This downshift could extend to the EMA 50, which aligns with the rising trendline.

Traders should pay close attention to the 61.8% Fibonacci support, which could present buying opportunities. If this level holds, the GBPUSD price will likely rise and retest the 1.2893 resistance.

However, if the rising trendline breaks, it's a clear sign that the bullish scenario should be invalidated. In this case, the consolidation phase will likely extend to the 1.2599 mark, the 50% Fibonacci support.

Therefore, we suggest observing the market's behavior around the EMA 50.​
 

EURUSD's Bullish Momentum: Indicators and Support Levels​


The EURUSD currency pair consolidates its recent gains above the 50% Fibonacci support level, the 1.091 mark, where it formed a hammer candlestick pattern.

As of writing, the Euro trades at about 1.092, with the RSI indicator hovering above 50, which can be interpreted as a signal for the continuation of the uptrend. The EMA 50 and the lower band of the bullish channel support the current uptick momentum. The bull market is likely to extend and test 1.098 as its first barrier.

Conversely, the 38.2% level divides the bull market from the bear market. Therefore, if the price dips below this level, the bull market should be invalidated.​
 

GBPUSD Uptrend Signals: RSI Indicator's Positive Shift​


Solid ECN – The pound sterling is coming back from the 50 EMA, and as of writing, it is trading at about 1.279. The ascending trendline depicted in red provides support alongside the EMA 50. Interestingly, The RSI indicator has returned above the signal line, indicating that the uptrend will likely resume.

From a technical standpoint, as long as GBPUSD trades above the 1.2745 mark, the bull market will remain valid and will likely aim for the 50% Fibonacci resistance, followed by the 61.8%.

Conversely, a dip below the EMA 50 would invalidate the bullish market.​
 

Mixed Indicators for the USDJPY​


The U.S. dollar recovered from 146.4 and tested the 38.2% Fibonacci resistance at 148.1. The EMA 50 and the Ichimoku cloud reinforce this resistance level, making it more robust. The RSI and the AO indicators signal a bull market; however, the ADX indicates a slowdown in market momentum, which could be interpreted as a halt in the recent uptick bias.

From a technical standpoint, we are in a bear market, and the current bullish wave could be a consolidation phase. Therefore, the market will likely decline if the price remains below the EMA 50. A break below the ascending trendline, depicted in red, can trigger selling pressures.

Conversely, if the USDJPY bulls can cross the EMA 50 and stabilize the price above it, the bear market should be invalidated, and traders should reevaluate the market.​
 

GBPUSD's Next Move: A Crucial Phase Beyond Fibonacci Resistance​


As anticipated, the pound sterling is on an upward trajectory against the U.S. Dollar, and this uptrend persists. The RSI indicator remains above 50, while the ADX signal, hovering around the 20 level, does not indicate significant volatility. Apparently, the market awaits for the price to surpass 50% Fibonacci resistance before adding new bets on the current trend.

From a technical perspective, the bulls have already disregarded the previous day's high, and momentum is likely to continue rising after a minor struggle with the aforementioned Fibonacci level.

If this scenario comes into play, the 78.6% level would be the next target.

Please note, dear traders, the bull market is robust, and for it to be invalidated, the price must dip below the Ichimoku cloud.
 

Australian Dollar Outlook: Bullish Trends and EMA 50 Support​


Solid ECN – The Australian dollar has stabilized above the 38.2% Fibonacci support level and the previously broken descending channel. Interestingly, the ADX indicator is making a return above the 25 level, interpreted as a sign that a new trend is on the horizon. This signal from the ADX aligns with the RSI, where it hovers above the 50 level.

From a technical standpoint, the EMA 50 supports the bullish bias on the currency pair. If the price stays above it, the next target for buyers would be the upper band of the bullish channel, which coincides with the 61.8% Fibonacci resistance level.

Conversely, the EMA 50 acts as the critical pivot between the bull and bear markets. The uptrend should be considered invalidated if the U.S. Dollar pushes the Australian dollar below the mentioned moving average.​
 

Analyzing the Potential Reversal in EURUSD Trends​


The U.S. Dollar has made a comeback from the 1.096 resistance level against the European currency. This ceiling is supported by the 61.8% Fibonacci retracement level. As indicated in the 4-hour chart, the pair failed to surpass it on March 8.

As of writing, the EURUSD pair trades at about 1.088, which is close to the 1.086 support and slightly below the lower band of the bullish channel. Interestingly, this price is located below the Ichimoku cloud and the EMA 50, which could be interpreted as a potential trend reversal.

From a technical standpoint, the bullish trend is invalidated since the price dipped below the cloud. However, the bears are required to close below the 38.2% Fibonacci level to trigger the main selling pressure. A failure to push the price below this level will likely lead the price to return above the EMA 50, indicating that the uptrend may continue.

Conclusion:​

For the bearish trend to resume, the price must close below the 1.086 level. Going short in the current market situation is risky because the bearish breakout suffers from a lack of valid confirmation.
 

Indicators Point to a New Bearish Trend in GBPUSD​


The Pound sterling lost ground against the U.S. Dollar in yesterday's trading session. As depicted in the GBPUSD 4-hour chart, the pair dipped below the EMA 50 and is currently testing it as a resistance level.

Technical indicators signal a bearish outlook, with the RSI hovering below 50 and the Awesome Oscillator showing red bars. Interestingly, the ADX currently hovers above the 25 level, which can be interpreted as the beginning of a new trend.

From a technical standpoint, the bears have broken below the bullish channel in red and are currently stabilizing the price at about 1.276. Therefore, as long as the price trades below the cloud, the secondary trend would be bearish, with the bears aiming for the 1.270 resistance, followed by 1.266.

The bearish technical analysis should be invalidated if the Pound sterling rises higher than the March 14 high, the 1.282 mark.
 

Create an account or login to comment

You must be a member in order to leave a comment

Create account

Create an account on our community. It's easy!

Log in

Already have an account? Log in here.

Similar threads

Users Who Are Viewing This Thread (Total: 1, Members: 0, Guests: 1)

Top
AdBlock Detected

We get it, advertisements are annoying!

Sure, ad-blocking software does a great job at blocking ads, but it also blocks useful features of our website. For the best site experience please disable your AdBlocker.

I've Disabled AdBlock    No Thanks