What's new

Forex Updates by Solid ECN

5.00 star(s) 1 Vote

Oil Prices Rise Amid Middle East Tensions, Down 7%​


Solid ECN - WTI crude oil prices climbed above $73.5 a barrel on Wednesday, marking a third consecutive session of gains due to concerns over potential supply interruptions in the Middle East. Market analysts believe that the ongoing tensions in the region could lead to fears of supply shortages being factored into oil prices.

Despite the US responding with airstrikes on Iran-supported groups in Iraq, Syria, and Yemen and hinting at more to come, Iran appears to continue its support for these militias with weapons and intelligence. However, oil prices have fallen by about 7% since the end of January, influenced by progress in peace talks between Israel and Hamas, dwindling hopes for immediate cuts in US interest rates, and ongoing worries about China's economic rebound affecting global demand.​
 

Euro Rises Amid Rate Cut Cautions: ECB & Fed Update​


The euro experienced a slight increase, going over $1.075, following a drop to a low of $1.072 on February 5th. This happened as the major central banks in Europe and the US took a careful stance on reducing interest rates. During a Financial Times interview on Wednesday, Isabel Schnabel, a member of the ECB's board, stressed the need for patience in deciding on changes to interest rates.

She pointed out the risk of inflation rising again as a concern. Additionally, ECB survey results showed that Eurozone consumers expect inflation to be at 3.2% over the next year as of December, the lowest expectation since February 2022. In the US, the anticipation for the Federal Reserve to lower interest rates soon diminished. This change in outlook was influenced by cautious remarks from Federal Reserve officials and the emergence of robust economic data.​
 

NZ Dollar Drops Amid Rate Hike Speculation​


Solid ECN - The New Zealand dollar dropped to approximately $0.612, losing some of its recent gains as investors became wary before an upcoming speech by the central bank, which might impact future interest rate decisions. Adrian Orr, the Governor of the Reserve Bank of New Zealand, is set to speak on Friday. Last week, the Kiwi saw a 1.4% increase amid thoughts that interest rates might increase due to persistent inflation and a strong job market.

ANZ analysts predict the Reserve Bank of New Zealand will raise interest rates by a quarter point in February and April, bringing the policy rate to 6%. Investors also note a worldwide trend among major central banks to delay expected rate reductions, particularly in the US and Europe. According to traders, there's about a 44% probability that the RBNZ will hike rates on February 28.​
 

EURUSD Technical Analysis: Bears Failed to Crosse the Cloud​


Solid ECN - The EURUSD currency pair is trading below the Ichimoku cloud, with the price at 1.076 at the time of writing. The bullish momentum that started from 1.072 was unable to extend beyond the 50% Fibonacci resistance level, the 1.0805 mark. Interestingly, the technical indicators are bearish, with the RSI indicator hovering below the 50 level, and the Awesome Oscillator bars are in red and on the verge of flipping below the signal level.

According to the technical data we receive from the EURUSD 4-hour chart, it is likely for the pair’s price to decline and return below the bearish flag. If this scenario comes into play, the first target could be the recent lower lows, the 1.07228.

Conversely, suppose the bulls stabilize the price above the 50% Fibonacci. In that case, the bearish scenario should be invalidated, and the EURUSD price could climb to %78.6, in conjunction with the upper line of the bearish channel.

This is a technical analysis perspective, and actual market conditions may vary. Always consider multiple factors when making trading decisions.​
 

NZ Dollar Hits Week Low Amid Policy​


The New Zealand dollar fell below $0.61, its weakest in a week, as the market weighed the US Federal Reserve's delayed interest rate cuts against New Zealand's lower inflation forecasts and the Reserve Bank of New Zealand's (RBNZ) firm approach. US data showed a less significant drop in inflation than expected for January, leading investors to delay their expectations for the Fed's policy easing.

In New Zealand, figures showed inflation expectations hitting their lowest in more than two years for the first quarter, indicating that past rate increases effectively controlled rising costs. Yet, RBNZ's Governor Adrian Orr remarked that the battle against inflation isn't over, pointing out widespread financial pressures as the reason for continuing a "restrictive monetary policy."​
 

GBPJPY Breaks January Record: Trading Above 188.8 Support​


Solid ECN - The GBPJPY currency pair trades above the 188.8 support after it broke the January all-time high on Tuesday. As seen in the GBPJPY 4-hour chart, the primary trend is bullish, but the pair bounced from 190.0, perhaps to test the blue trendline, which acts as double support to the price.

Interestingly, the technical indicators show signs of divergence, which can be interpreted as the beginning of a consolidation phase or a trend reversal. Therefore, the uptrend would continue if the GBPJPY price can maintain its position above the 23.6% of the Fibonacci retracement level.

On the other hand, if the price falls below the Fibo level mentioned above, the consolidation phase might extend to the 50% Fibonacci level, which is backed up by the Ichimoku cloud.​
 

USDCAD Analysis: Bullish Trendline Supports Above 50% Fibonacci Level​


Solid ECN - The USDCAD currency pair dipped to 1.3447 in today's trading session. The current USDCAD price is 1.348, which is above the 50% Fibonacci retracement level. This deck is further supported by the Ichimoku cloud and the bullish trendline, both visible in red on the USDCAD 4-Hour chart. From a technical perspective, if the bulls maintain the market above the 61.8% Fibonacci support, the bullish trend will likely persist. In this scenario, the following targets could be the 23.6% retracement level, followed by the recent peak of 1.3585.

Conversely, if the bears manage to lower the price below the 1.3447 support and stabilize it there, the downward momentum could extend to the 1.3357 support level.​
 

EURUSD Correction Phase and Fibonacci Retracement​


Solid ECN - The EURUSD currency pair entered a correction phase after the bears hit the 1.06946 bottom. Currently, the price of the most traded currency pair is 1.0758, and it is about to test the 23.6% Fibonacci retracement level, which also aligns with the Ichimoku cloud. The main barrier for further rise is the 1.0805 resistance. Should this level be breached, the consolidation phase would extend to the 38.2% Fibonacci resistance, the upper band of the bearish flag.

On the flip side, if the EURUSD price falls below 1.07316, the downtrend is likely to continue, and the first target would be the February 14th low, the 1.0694 mark.​
 

Bitcoin’s Uptrend Momentum: A Market Analysis​


Solid ECN - The momentum of Bitcoin’s uptrend eased after it surged as high as $52,866. This digital gold has risen since January 20, while the RSI indicator has been hovering in the overbought area for a week now. Interestingly, sellers in the market have created a bearish, long-wick candlestick on the daily chart, which could signal an end or a pause in the bullish market.

Based on the data we’ve received for the candlestick patterns and the technical indicators, waiting for the BTCUSD price to end its consolidation phase before placing new bets on the bullish trend is recommended. The 23.6% Fibonacci retracement level, which aligns with the $49,000 support, could be a decent offering price.​
 

GBPUSD Price Decline: Ichimoku Cloud and Channel Analysis​


Solid ECN - The GBPUSD price has declined from 1.2629, which aligns with the Ichimoku cloud and the descending trendline, depicted in red. The pair is currently testing the 23.6% Fibonacci support level, which appears weak and may not keep the price from falling. Moreover, the technical indicators support the bearish market, with the RSI indicator hovering below the middle line and the Awesome Oscillator flipping below the signal line.

From a technical standpoint, the downtrend will likely continue as long as the GBPUSD price maintains a position below the 1.2629 resistance. The next target could be 1.2550, followed by 1.2517, the lower low of February 5th.

On the flip side, to invalidate the bearish scenario, the bulls must close and stabilize the price above 1.2629.​
 

USDCHF Bullish Trend Supported by Ichimoku Cloud​


The USDCHF currency pair is trading sideways above the 0.8782 resistance level inside the Ichimoku cloud. It's worth mentioning that the Ichimoku cloud adds an extra layer of support to the bullish trend that began on February 2 from the 0.8852 mark. The technical indicators on the 4-hour chart don't provide noteworthy data, so we should rely on the horizontal channel depicted in blue on the 4-hour chart.

From a technical standpoint, the upward trend on the 4-hour chart should continue if the bulls cross above the 0.8839 level. This scenario is more likely due to the primary USDCHF trend and the awesome oscillator bar turning green in the current trading session.

Conversely, the bears need to stabilize the price below the 0.8782 support level to target the 38.2% Fibonacci support level. If this scenario comes into play, the high of February 12 can be considered the new higher high, and the price might experience a further decline to the 50% Fibonacci retracement level.​
 

USDCAD Tests Fibonacci Resistance Amid Bullish Wave​


The USDCAD pair is testing the 23.6% Fibonacci resistance at the 1.3529 mark, following the bullish wave that began on February 15th from the 1.3447 mark, which is the 61.8% Fibonacci support level. The 4-hour chart shows that the bulls have crossed above the bearish trendline with a long-bodied candlestick. This could be interpreted as a continuation of the uptrend momentum. Interestingly, the technical indicators back up this momentum, with the relative strength index pointing upwards and the awesome oscillator flipping above the signal line.

From a technical standpoint, the U.S. dollar is likely to gain more against the Canadian dollar, and the next target for the buyers could be the 1.3585 resistance.

On the flip side, the bullish trendline is the primary support for the uptrend. The bullish scenario outlined above should be invalidated if the price falls below this level, corresponding to the 50% Fibonacci level or the 1.3471 mark.​
 

Euro’s Struggle Against the U.S. Dollar Amid Fibonacci Resistance​


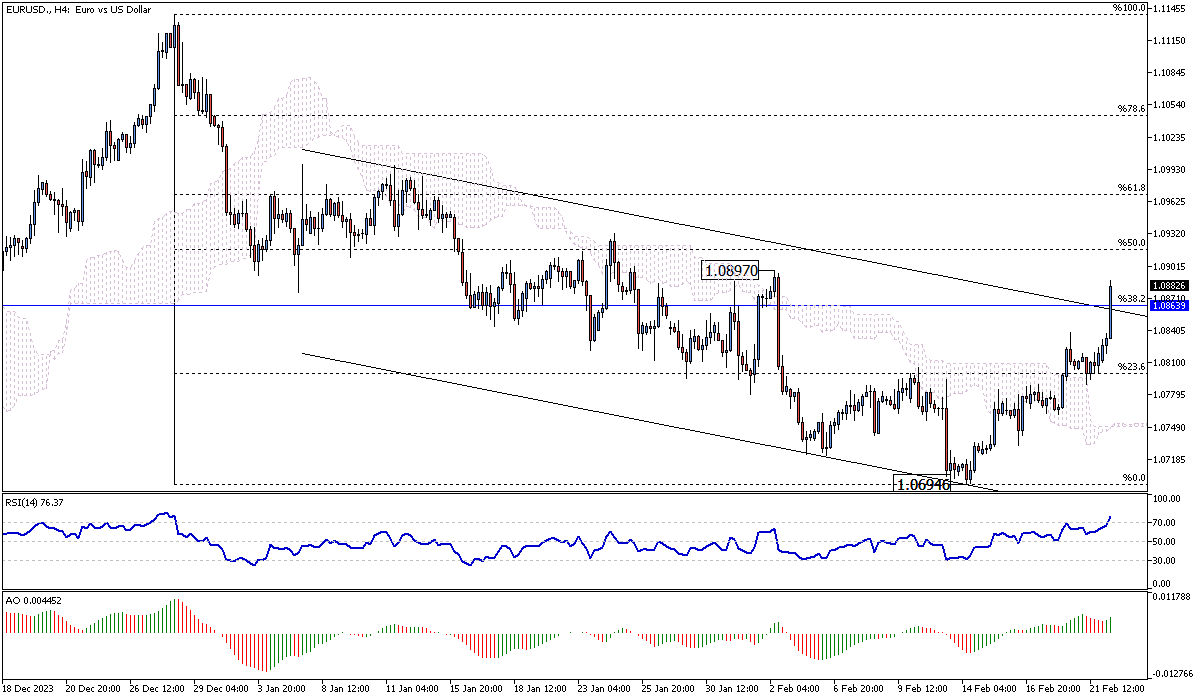
Solid ECN – The Euro is trading above the 38.2% Fibonacci resistance against the U.S. Dollar, which stands at 1.085. This level is clinging to the upper band of the bearish flag. Interestingly, the RSI indicator has stepped into the overbought zone. This could be interpreted as a sign that the uptick in momentum, which began on February 12, might ease near this level.

From a technical standpoint, the primary trend is bearish. However, this could be invalidated if the bulls manage to cross and stabilize the price above the 1.08639 ceiling.

On the other hand, if the 1.08639 level holds, the EURUSD pair will likely turn downward again. In this scenario, the 23.6% Fibonacci support would be tested once more.

Happy trading!​
 

Euro Faces Bearish Trends Against U.S. Dollar​


Solid ECN – The Euro trades around 1.083 against the U.S. Dollar in today's trading session, remaining within the bearish channel. Despite an upward jump in Friday's session, the bears quickly pushed the price back down, firmly within the channel, indicating that the bulls' attempt to break out of the bearish channel might have failed.

From a technical standpoint, as long as the pair trades below the 38.2% Fibonacci resistance level, the downtrend will likely persist. The 1.0802 level acts as minor support; if this level is breached, the decline is expected to continue. In this scenario, the following targets for the bear market would be around the 1.076 mark.

Conversely, the 38.2% Fibonacci level serves as the primary resistance point. Should the price sustain itself above this level, it could invalidate the current bearish scenario.​
 

GBPUSD Bullish Trend Faces Slowdown​


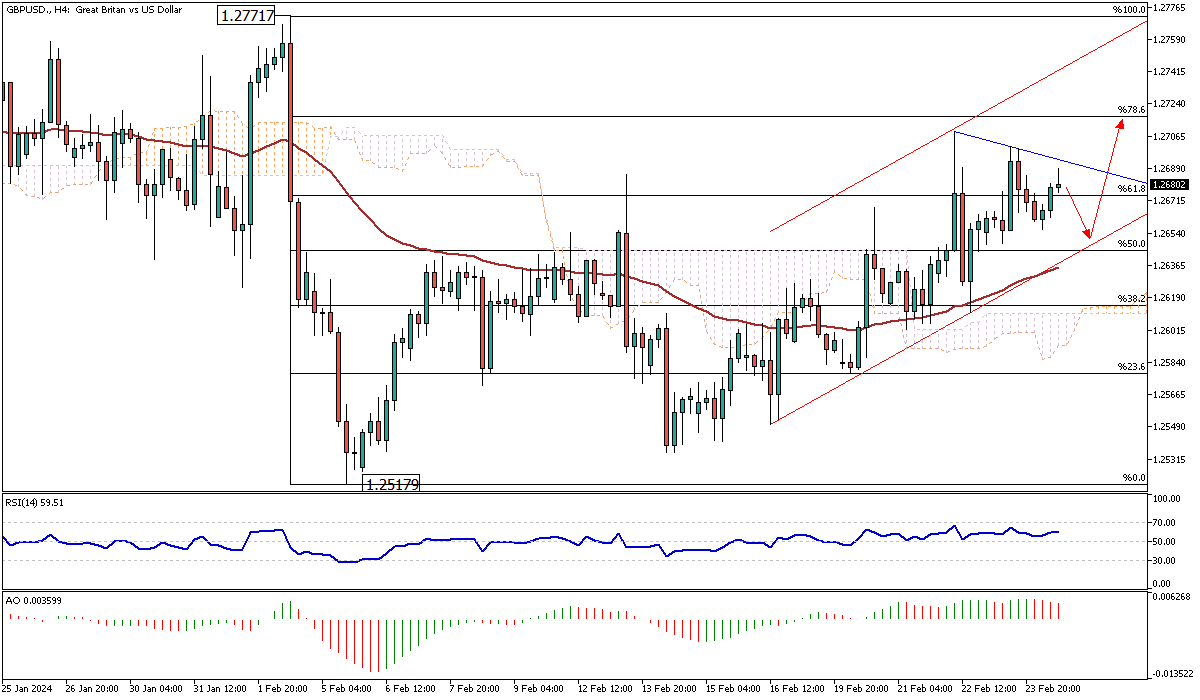
Solid ECN – The GBPUSD trades inside the bullish channel and above the 50 exponential moving average (EMA). This indicates that the primary trend is bullish. However, the awesome oscillator shows signs of a slowdown in the trend.

From a technical standpoint, the 50%Fibonacci retracement level supports the bull market, and the bottom line of the flag further supports this zone. Therefore, as long as the pair trades above it, the technical analysis for the GBPUSD predicts more upward momentum. In this case, the channel's upper band can be considered the next bullish target. It is worth noting that the price must exceed the declining trendline, depicted in blue, to reach the target.

Conversely, the above technical analysis would be invalidated if the price falls below %50 Fibonacci. If this scenario continues, traders should wait to see how the price reacts to the 50 EMA and the Ichimoku cloud support zone.​
 

USDJPY Pair Analysis: Bullish Channel and Ichimoku Cloud​


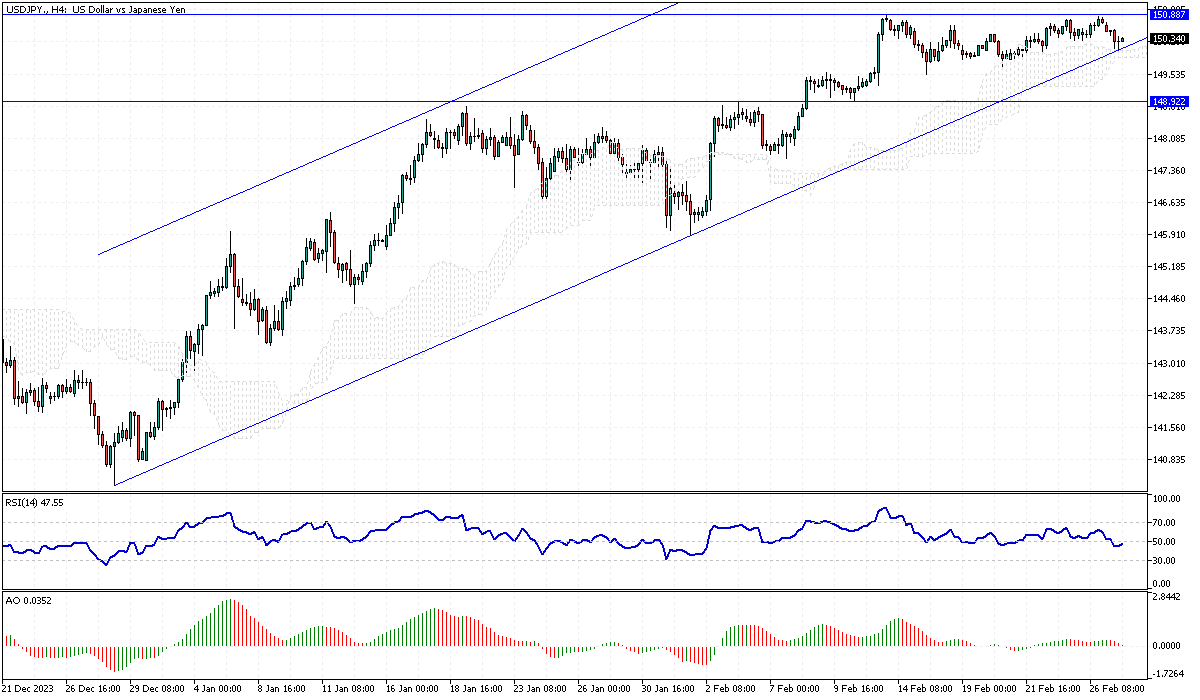
Solid ECN – The USDJPY pair is testing the lower band of the bullish channel, which coincides with the Ichimoku cloud. The 4-hour chart has formed a doji candlestick, which can be interpreted as a signal for the continuation of the bull market.

From a technical standpoint, if the Ichimoku cloud remains intact, the bullish trend should continue, and the first milestone would be the 150.8 resistance.

On the other hand, if the USDJPY price falls below the Ichimoku cloud, the consolidation might extend to the 148.9 support.​
 

EURUSD Trading at 1.085 Amid Multiple Resistance Levels​


Solid ECN – The EURUSD currency pair trades around 1.085 today. Currently, the price is in conjunction with multiple resistance levels. These include the 38.2% Fibonacci support, the upper band of the bearish flag, and the rising trendline. While the technical indicators give mixed signals, the EURUSD 4-hour chart has formed a long-wick candlestick pattern, which can be interpreted as the bears being more active than the bulls in the current session.

From a technical standpoint, the primary trend remains bearish as long as the price is suppressed below 1.0865s, the 38.2% Fibonacci retracement level. However, for the downtrend to continue, the price must fall below the ascending, precisely the 1.0832 mark.

On the other hand, the uptick momentum that began on February 13th should continue if the bulls cross above the Fibonacci level under discussion and maintain a position above it.​
 

EURUSD Analysis: Bearish Trend is Likely to Continue​


Solid ECN – The Euro trades around 1.082 against the U.S. Dollar in Wednesday's trading session, stabilizing itself below the broken ascending trendline, as illustrated in the 4-hour chart. This breakout could be interpreted as a temporary or long-term shift in market direction, transitioning from a bull to a bear market.

Furthermore, as the EURUSD tests the 38.2% Fibonacci support level, technical indicators suggest that the decline, which began from the 1.0865 higher low, is likely to continue.

Therefore, from a technical standpoint, with the price maintaining its position within the bearish flag, depicted in black lines, the bear market is expected to extend and potentially test the 50% Fibonacci support, followed by the 61.8% level.

Conversely, the 1.0866 level acts as resistance. The bearish outlook should be invalidated if the EURUSD price exceeds this level.​
 

U.S. Dollar Leads in Today's Market Against GBP​


Solid ECN – The U.S. Dollar is leading in today's trading against the pound sterling, with the GBPUSD pair trading around 1.263. The Ichimoku cloud supports this price area. From a technical standpoint, for the downtrend to continue, bears must stabilize the price below this level. Although technical indicators support a bearish scenario, there is still a chance for the bulls to take control, especially if the 1.2611 level holds firm.

In conclusion, the price must fall below the cloud for the bear market to extend further. Otherwise, we will likely witness the GBPUSD pair rise again, aiming for the 1.2709 resistance level.​
 

GBPJPY Navigates Bullish Patterns Amid Mixed Signals​


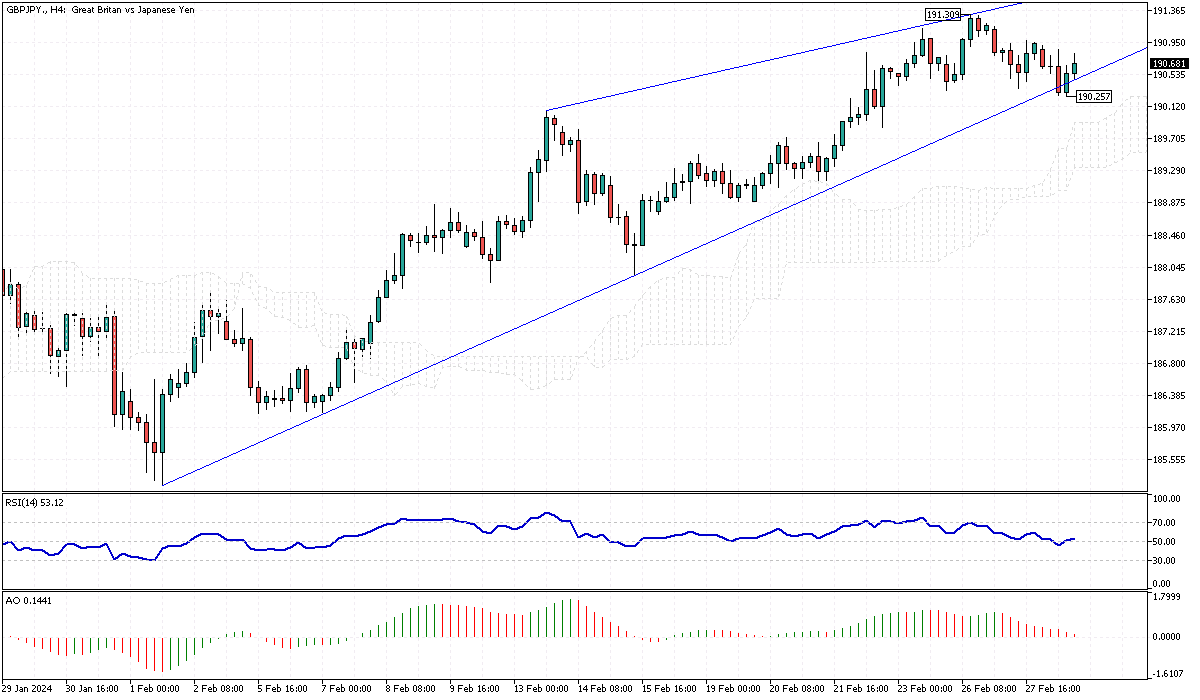
Solid ECN – The GBPJPY currency pair recently declined from the upper line of its bullish wedge pattern at the 191.0 mark. Subsequently, the pair tested the lower band and bounced back from 190.2, and it currently trades around 190.6.

The primary trend remains bullish, but the technical indicators provide mixed signals. On one hand, the RSI indicator suggests continuing the bull market. On the other hand, the Awesome Oscillator bars have turned red and are approaching the signal line, indicating potential caution. Based on the primary GBPJPY trend, we can predict that the uptick momentum will likely resume if the pair maintains its position within the wedge's boundaries.

Even if the price dips below the 190.2 level, considered a resistance point, the Ichimoku cloud emerges as the next significant barrier for the sellers.

From a technical standpoint, as long as the price remains above the cloud, our technical analysis remains unchanged. This situation suggests a potential for continued bullish behavior, securing any significant market shifts.​
 

Create an account or login to comment

You must be a member in order to leave a comment

Create account

Create an account on our community. It's easy!

Log in

Already have an account? Log in here.

Similar threads

Users Who Are Viewing This Thread (Total: 1, Members: 0, Guests: 1)

Top
AdBlock Detected

We get it, advertisements are annoying!

Sure, ad-blocking software does a great job at blocking ads, but it also blocks useful features of our website. For the best site experience please disable your AdBlocker.

I've Disabled AdBlock    No Thanks