


skrimon
Active Member
A pattern is recognized by a line linking common price points, such as closing prices, highs, and lows, throughout a specified time period.
Technical analysts attempt to uncover patterns to forecast the future price movement of a security.
These patterns can range in complexity from trendlines to double head-and-shoulders formations.
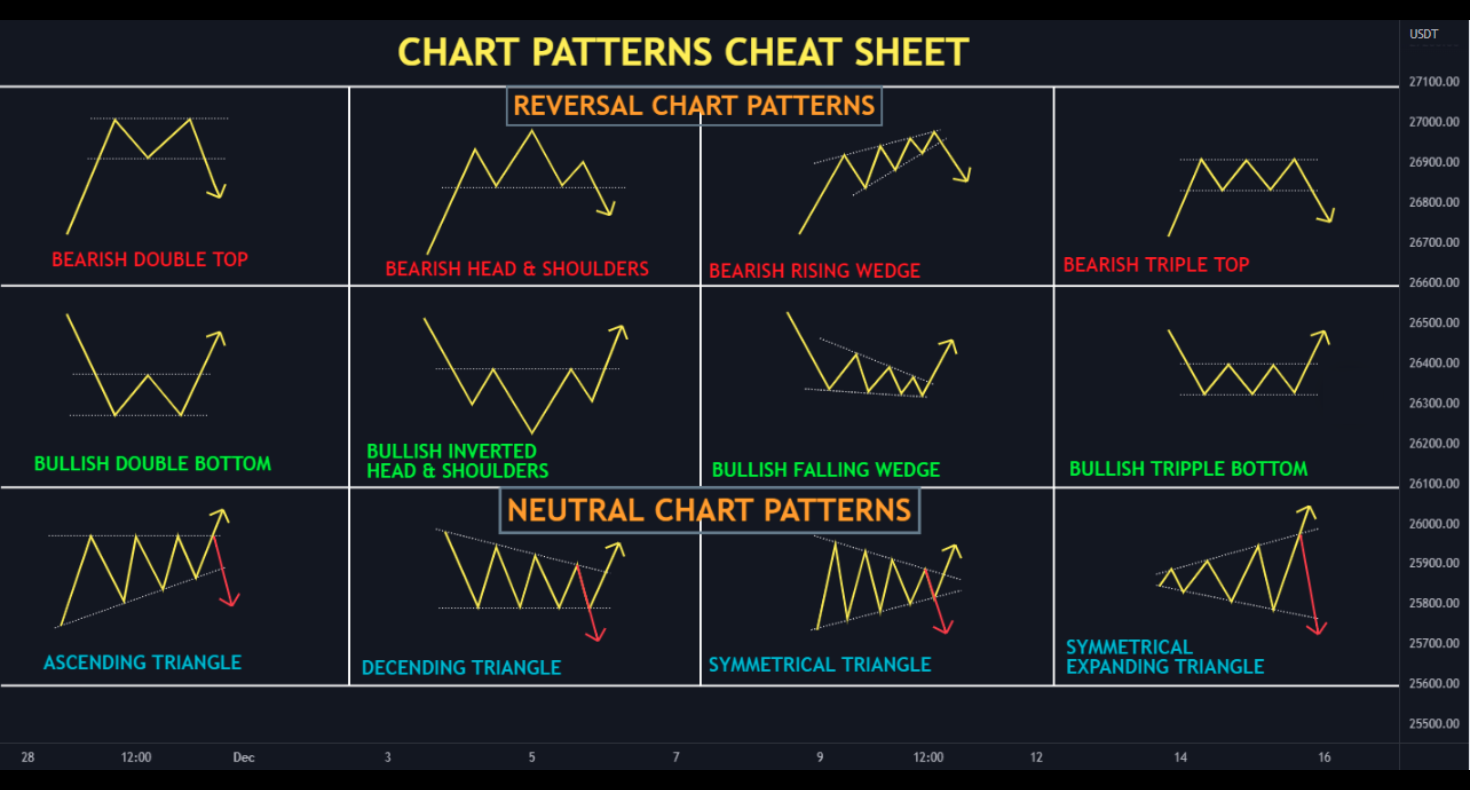
Reversal patterns are chart formations that indicate an impending reversal of the current trend.
During an uptrend, the formation of a reversal chart pattern indicates that the trend will soon reverse and the price will decline.
In contrast, the presence of a reversal chart pattern during a downtrend indicates that the price will eventually rise.
Continuation chart patterns are chart formations that indicate the continuation of an ongoing trend.
Typically, these patterns are also referred to as consolidation patterns, as they illustrate how buyers or sellers take a brief pause before continuing in the same direction as the prior trend.
Generally, trends do not go in a straight line up or down. They pause and move sideways, then "correct" lower or upward before regaining momentum and continuing the main trend.