What's new

Forex Updates by Solid ECN

5.00 star(s) 1 Vote

Analyzing GBPUSD's Bullish Sentiments Amid Recent Downtrend​


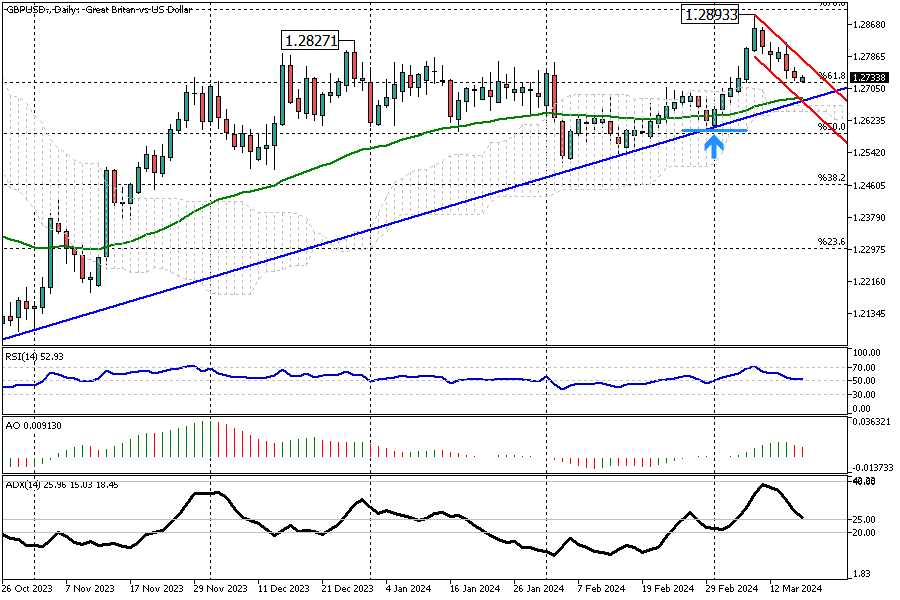
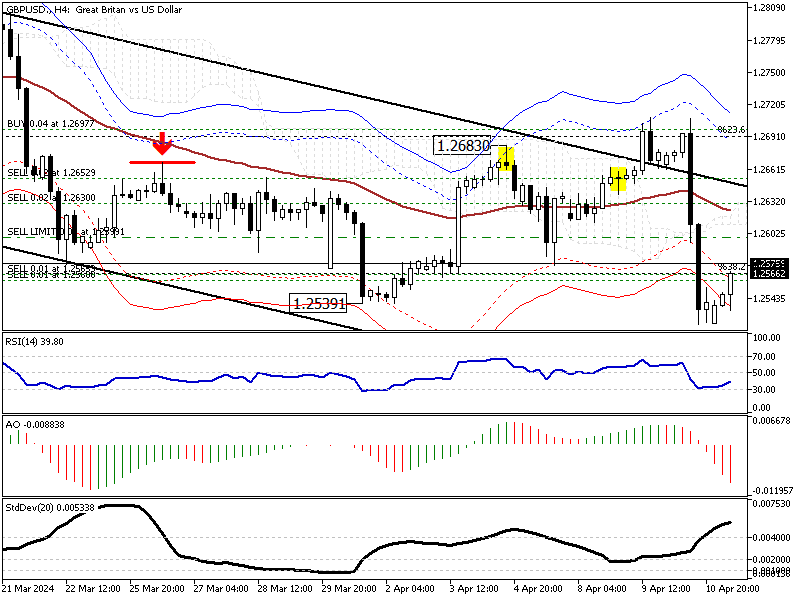
Solid ECN – Pound Sterling demonstrated its resilience at the start of the Monday trading session. It opened with a slight gap against the U.S. Dollar but quickly recovered. It is currently holding strong at around 1.273.

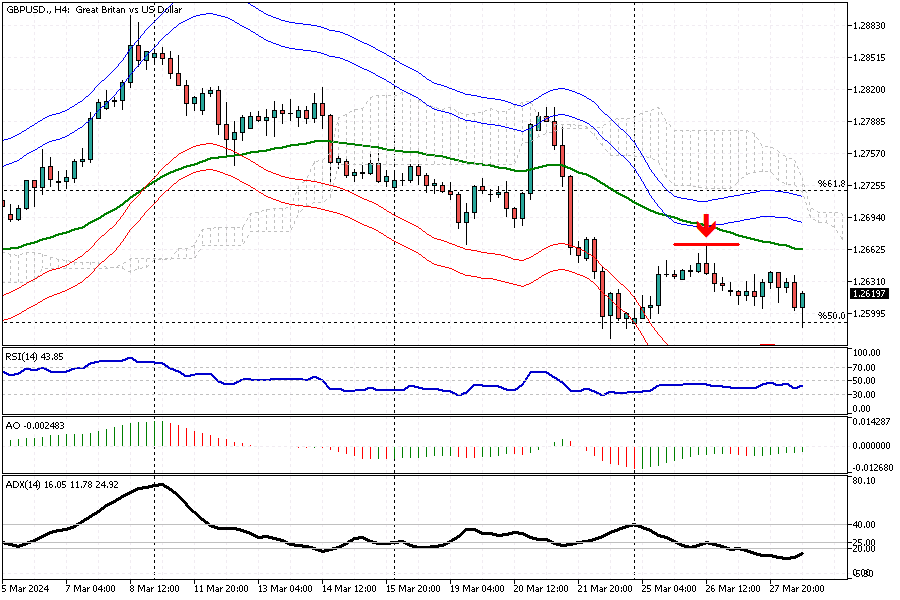
The pair trades above the bullish trend line, as indicated in blue on the GBPUSD chart. Therefore, the primary trend remains bullish. However, the price has fallen from the 1.289 high and is now experiencing a downtrend within the bearish channel, marked in red.

The data from the chart suggests that the current downward momentum may represent a consolidation phase, setting the stage for a potential bullish comeback. The EMA 50, aligning with the trend line and the resistance level supported by the Ichimoku cloud, could provide a solid support for buyers to initiate this optimistic turn of events.

Please note that the price must break out of the bearish channel for the uptrend to resume. In this scenario, the rise could continue and target the high from February as its first significant milestone.​
 

Bitcoin's March 2024 Rebound: Analyzing the Latest Price Movements​


Solid ECN – Bitcoin bounced from its March 2024 low, the $60,700 mark, in yesterday's trading session, Tuesday.

As of this writing, the BTCUSD pair trades at about $67,700, slightly below the Ichimoku Cloud. The 4-hour chart shows that digital gold is trying to stabilize the price above the EMA 50, while the Awesome Oscillator and the RSI have flipped above their signal lines. Therefore, the technical indicators are bullish, but the Bitcoin bulls face the $68,900 barrier to overcome if they wish the price to surge higher.

From a technical standpoint, the downtrend will likely extend if the price stabilizes itself below the EMA 50. This attempt hasn't been achieved so far in today's trading session. Therefore, watch the EMA 50 on the BTCUSD 4-hour chart.

Conversely, the uptrend would continue if bullish traders break the aforementioned barrier. In this scenario, the March higher high, $73,700, would be the initial target for the bull market.​
 

USDJPY: November 2023 Highs Revisited, Consolidation Ahead?​


Solid ECN – The U.S. Dollar has reached the November 2023 high against the Japanese Yen, hitting the 151.9 mark for the second time this week. However, this time, a long wick candlestick pattern has emerged on the USDJPY 4-hour chart.

Additionally, the Awesome Oscillator shows a divergence in its bars, which could signal an imminent consolidation phase. This could drive the price down to the 150.2 mark, followed by the 38.2% Fibonacci support level, which the 50 EMA supports. These levels provide favorable entry points for retail traders looking to join the primary upward trend.

Conversely, the 151.8 hard resistance level must be breached for the uptrend to continue.​
 

Gold Prices Near Record Highs Amid Rate Cut Expectations​


Solid ECN – On Monday, the price of gold remained steady around $2,175, nearing its record high of $2,185 set on March 20th. This stability comes amid increasing bets on the Federal Reserve reducing interest rates.

Recently, the Fed kept its forecast, expecting to lower rates three times in 2024, making gold more attractive. Moreover, investors now believe there's over a 70% likelihood that the Fed will cut rates in June, a jump from the 55% probability anticipated before their latest meeting.

This week, all eyes are on important U.S. inflation data and speeches from several Federal Reserve officials for further indications of future monetary policies. Additionally, ongoing conflicts in Russia and the Middle East support gold's status as a reliable safe-haven asset.
 

Gold Prices Surge Amid Economic Shifts and Global Tensions​


On Tuesday, the price of gold climbed to a new peak, approximately $2,190 per ounce. This increase was mainly due to the weakening of the US dollar. Investors are anticipating rate cuts, especially with the upcoming US PCE price index report expected this Friday. Following last week's announcement by the Federal Reserve, which kept its prediction of three interest rate cuts for the year, gold became more attractive.

However, February saw better-than-expected US durable goods orders, and various Federal Reserve officials have voiced concerns regarding persistent inflation and a strong economy. There's a roughly 70% expectation among markets that the Federal Reserve will begin to lower rates in June, a notable increase from the 55% likelihood anticipated before their last meeting.

Rising geopolitical tensions in the Middle East and Eastern Europe, underscored by the UN Security Council's call for an immediate ceasefire in Gaza, bolster gold's status as a secure asset.​
 

GBPUSD Drops, Awaiting Bank Decisions​


Solid ECN – In late March, the British pound fell to just above $1.26, its weakest since February 19, and was on track to lose almost 1% over the quarter compared to the US dollar. This happened as investors paid careful attention to cautious words from bank officials. Fed Governor Waller mentioned that the latest inflation figures back the idea that the US Federal Reserve might not soon lower its short-term interest rate goal, though he didn't rule out cuts later in the year.

In Britain, Bank of England's Haskel stated that it's too soon to consider rate cuts, and his colleague Mann warned against expecting too many rate reductions this year. She suggested it's unlikely the UK would reduce rates before the US.

During its March session, the Bank of England kept its interest rates the same. Two members, who had earlier supported increasing rates, now preferred to wait, leading to a softer approach than many had predicted.​
 

AUDUSD's Technical Outlook: Pullback Opportunities in Sight​


In today's market, the Australian dollar is losing value compared to the U.S. Dollar. The exchange rate fell below the 0.6503 support level, and it’s currently trading around 0.6493 after a slight recovery from 0.6475.

Despite the bearish trend, the Awesome Oscillator indicates a divergence, suggesting we might soon enter a consolidation phase. This means the AUD/USD pair could temporarily rise, possibly retesting the 0.6503 level and then the 50 EMA, before continuing its downward trajectory.

Technically speaking, the AUD/USD is experiencing a bear market, but there's a chance for a short-term pullback because the Awesome Oscillator is showing divergence. The levels around 0.6503 and 0.6504 could offer good opportunities for those looking to enter the market with this bearish trend in mind.

However, should the pair close above and find stability over the Ichimoku cloud, it would challenge the current bearish outlook and potentially shift the market sentiment.​
 

How to Trade the NZD/USD Pullback: Insights from the Awesome Oscillator​


The NZD/USD currency pair is currently in a bear market, trading below the 61.8% Fibonacci resistance level. The ADX indicator signifies that the trend is strong on the daily chart, as it nears the 40 level. However, the Awesome Oscillator indicates divergence, suggesting that the New Zealand dollar is likely to experience a pullback to the 0.602 resistance area.

Technically speaking, the next bearish target could be the 78.2% Fibonacci level, but the decline may continue after a consolidation phase. Therefore, the 0.602 level can provide a decent entry point for joining the sellers in the NZD/USD market.
 

Navigating the Bear Market: Entry Points for EUR/USD Traders​


Solid ECN – The U.S. Dollar is stabilizing below the 38.2% Fibonacci level against the European currency today, Monday, April 1st, 2024.

The divergence signaled by the Awesome Oscillator could indicate a potential consolidation phase on the horizon.

From a technical perspective, the primary trend for EUR/USD is bearish. The pair will likely regain some of its losses from last week by rising to the 50% Fibonacci level, which coincides with the EMA 50. This resistance level could provide a suitable entry point for retail traders looking to join the bear market.

Conversely, the bear market should be invalidated if the pair stabilizes above the Ichimoku Cloud.​
 

Bitcoin Tests the Bullish Trendline for Next Moves​


Bitcoin's price dipped to as low as $65,796 in today's trading session against the U.S. dollar. As of this writing, the pair is testing the ascending trendline highlighted in red. The technical indicators are not providing valuable information now, so we focus on price action analysis.

From a technical perspective, the trend remains bullish as long as the price stays above the red trendline. However, if bears push and maintain the BTC/USD price below this trendline, the dip could extend further, with the next bearish target potentially being the $68,000 resistance level.
 

Bearish Trend in AUD/USD: Key Indicators and Price Targets​


Solid ECN – The momentum of the Australian dollar against the U.S. Dollar has paused in today's trading session. As of this writing, the AUD/USD pair is testing the EMA 50 at about 0.651, which coincides with the Ichimoku Cloud.

The 4-hour chart has formed a Doji candlestick pattern, which could be interpreted as a sign of a trend reversal or a halt to the current uptick in momentum.

From a technical standpoint, as long as the AUD/USD pair trades below the cloud, the primary trend remains bearish. In this scenario, the next target will likely be March's lowest price, the 0.647 mark. Please note that if the Standard Deviation indicator rises above the 0.002 level, the pace of the downtrend will escalate.

On the flip side, the bear market should be invalidated if the price of the Australian dollar closes and stabilizes above the 0.6538 resistance mark. In this case, the rise will likely extend and aim for the upper band of the flag.​
 

AUDUSD Climbs Higher: A Look into the Bullish Trend​


Solid ECN – Yesterday, the Australian dollar saw a significant rise against the U.S. dollar. This increase in value started when it surpassed the EMA 50 and reached 0.6524, marked by a large bullish candle. Following this, there were four more strong bullish candles, pushing the price beyond the Envelopes band, suggesting the market was in an overbought state. This was further supported by the RSI indicator moving above 70.

Today, the market is correcting itself slightly after reaching a high of 0.661 on Thursday. Currently, the AUD/USD pair is trading around 0.657, still above the 50% Fibonacci support level, and maintaining its position over the Ichimoku Cloud. Despite technical indicators showing a bearish trend, the overall outlook remains bullish as long as the price stays above the cloud and the EMA 50.

The AUD/USD price might climb further to challenge the 78.6% Fibonacci resistance level at 0.6626, moving towards the top of the bullish channel shown in red on the 4-hour chart for AUD/USD.

However, if the price falls below the EMA 50 or the 38.2% Fibonacci support level at 0.5548, this would signal an end to the bullish trend.
 

EURUSD Market Update​


Solid ECN – In Monday's trading session, the Euro trades at about 1.083 against the U.S. Dollar, which is slightly above the EMA 50 and the 38.2% Fibonacci support level. It seems the pair is trying to stabilize itself above the aforementioned level after pulling back from the 23.6% Fibonacci level in Friday's late trading session.

The technical indicators give mixed signals, but the Standard Deviation indicates low activity and sideways momentum in the EURUSD market. That said, with the RSI (Relative Strength Index) hovering above 50, the price of the EURUSD might grow higher to test the 50% Fibonacci level followed by the 1.088 strong resistance area.

However, entering the market with a bullish outlook is risky since the primary trend is bearish. Therefore, it is recommended to wait and monitor the price action closely near the key levels mentioned above and seek opportunities to join the bear market.

From a technical standpoint, if the price rises to the 1.088 resistance, it would offer a decent price to go short on the EURUSD pair if the 4-hour chart forms a bearish candlestick pattern.

On the other hand, if the Euro dips below the EMA 50, this could signal a continuation in the downtrend, and retail traders can adjust their strategies accordingly and join the primary trend, which is bearish.​
 

EURUSD Steady at $1.08 as ECB Meeting Nears, Rate Cut Hints Awaited​


Solid ECN—The euro remained steady at about $1.08, with investors taking a cautious stance as they awaited Thursday's European Central Bank (ECB) announcement.

It's widely anticipated that ECB officials will keep interest rates at their current record highs for the sixth time in a row. The focus is now on how the statement is worded and what ECB President Lagarde might say in her press conference to hint at when the first interest rate decrease of the year could happen.

Recent documents from the ECB show that the officials are more confident about inflation moving towards their goal of 2%, which makes a strong argument for a reduction in interest rates. On the other hand, the US dollar kept getting support because the latest data showed the American job market is still doing well, indicating that the Federal Reserve might not hurry to lower interest rates soon.​
 

EURUSD Trends: A Shift Below Key Levels This Week​


Solid ECN – In the 4-hour chart, the EURUSD currency pair trades under the descending trendline, shown in black. This position came about after the pair developed a bearish engulfing pattern right around the 61.8% Fibonacci support level, suggesting the possibility of a trend change. At the same time, the awesome oscillator gives off a divergence signal, matching what the candlestick pattern indicates.

The pair must end below the 50 EMA for the downtrend to press on. If this happens, we could see the price heading towards the 23.6% Fibonacci support level, marking it as the initial goal for this week.

However, should the EURUSD pair's price climb above the 61.8% Fibonacci resistance level, the current bearish market analysis might no longer be applicable.​
 

GBPUSD's Pullback: An Opportunity?​


Solid ECN—In yesterday's trading session, The GBPUSD pair dipped below 1.2593, April's lowest point against the U.S. dollar. As of writing, the pair is experiencing a pullback toward the broken support at 1.2575. This pullback was expected because the price exceeded the envelope indicator's lines, interpreted as an oversold market.

From a technical perspective, the market is bearish as long as the GBPUSD price hovers below the Ichimoku Cloud and the EMA 50. The pullback can provide opportunities to join the bear market if it stops at the 1.2575 resistance, followed by 1.2613. Therefore, monitoring these levels and looking for bearish candlestick patterns, such as a doji or a bearish engulfing pattern, can signal investors to join the sellers.

If this scenario comes into play, the next target for the bears will likely be the 50% Fibonacci level, the 1.247 mark, followed by the lower band of the bearish flag.

Conversely, if the GBPUSD closes and stabilizes itself above the cloud and the upper band of the flag, the bear market should be considered invalid.​
 

AUDUSD Recovery and Future Market Trends​


The Australian dollar has pulled back to 0.6554 (the 38.2% Fibonacci support level) against the U.S. Dollar after yesterday's slump to 0.6499.

From a technical standpoint, the downtrend in the AUDUSD will likely continue if the price holds below the Ichimoku cloud and the 38.2% Fibonacci resistance.

On the flip side, if the AUDUSD price crosses above the EMA 50 level, the bearish analysis should be invalidated, and the market would extend, aiming for the 61.8% Fibonacci resistance level, which is in conjunction with the upper band of the young flag.​
 

Monitoring Yen's Rally Against Sterling​


Solid ECN – The Japanese yen is making a comeback against the pound sterling from 192.9 and is increasing its pace toward the 23.6% Fibonacci level.

The pair trades in the bullish flag depicted in red, as shown on the daily chart. The current downward momentum occurs while the RSI indicator closes on the 50 levels and the Awesome Oscillator signals divergence. This could be interpreted as a trend reversal or the beginning of a new consolidation phase, which appears stronger.

From a technical standpoint, the primary trend is bullish. Still, due to the divergence signal, the consolidation phase might extend to the 23.6% Fibonacci support, followed by the lower band of the bearish flag in blue.

Therefore, we suggest monitoring the aforementioned levels closely for a hammer stick pattern since these levels provide a decent price point for joining the bull market.​
 

EURUSD Trading Tips Amid Market Volatility​


Solid ECN – The EURUSD currency pair dipped to as low as 1.062 during Friday's trading session and traded at about 1.066, with an increase in today's trading session.

The RSI indicator signals that the market is oversold, while the Standard Deviation indicator hovers at a peak of around 0.0079 and is declining. This can be interpreted as the market being oversold and market volatility slowing down.

From a technical perspective, joining the bears in an oversold market condition is not recommended. Therefore, waiting patiently for the EURUSD to correct some of its losses is logical and wise. However, we don't see signals from the Awesome Oscillator indicating the start of a consolidation phase. Regardless of the AO, if the price reaches the 23.6% Fibonacci level, this resistance area can provide a decent entry point for retail traders to join the bear market.

Please be aware that the Ichimoku cloud stands between bear and bull markets. As long as the price hovers below the cloud, the market remains bearish.​
 

Create an account or login to comment

You must be a member in order to leave a comment

Create account

Create an account on our community. It's easy!

Log in

Already have an account? Log in here.

Similar threads

Users Who Are Viewing This Thread (Total: 1, Members: 0, Guests: 1)

Top
AdBlock Detected

We get it, advertisements are annoying!

Sure, ad-blocking software does a great job at blocking ads, but it also blocks useful features of our website. For the best site experience please disable your AdBlocker.

I've Disabled AdBlock    No Thanks