Descending Triangle pattern
As you probably guessed, descending triangles are the exact opposite of ascending triangles (we knew you were smart!).
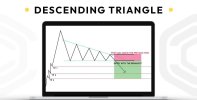
In descending triangle chart patterns, there is a string of lower highs that forms the upper line. The lower line is a support level in which the price cannot seem to break.
In the case of a Descending triangle chart pattern, the stop loss should be placed at the previous high of the pattern.
The limitation for the target will be the previous support level which was formed before by the price action.
As you probably guessed, descending triangles are the exact opposite of ascending triangles (we knew you were smart!).
In descending triangle chart patterns, there is a string of lower highs that forms the upper line. The lower line is a support level in which the price cannot seem to break.
In the case of a Descending triangle chart pattern, the stop loss should be placed at the previous high of the pattern.
The limitation for the target will be the previous support level which was formed before by the price action.