


Volty MACD Forex Trading Strategy
Indicator based trading systems are one of the best ways to trade the forex market. It is not the only way, but it does work. In fact, most traders use some sort of indicator in one way or another.
There are a lot of advantages to using indicators when trading forex. First, it allows traders to make a sense of what the market might be doing by making the charts more decipherable. An otherwise random walk looking type of chart would start to make sense if you’d put a few indicators on it. Aside from allowing traders to visually decipher what the market is doing, indicators also quantifiably qualify trading setups because the plots on the chart are derived from mathematical equations that come from price itself. Lastly, because indicators are quantifiable, it allows traders to devise a systematic trading approach, more of an if-then set of rules, which would allow traders to have more consistent and measurable results.
The Moving Average Convergence-Divergence Indicator (MACD)
The MACD is one of the staple trading indicators that many traders use. It is an oscillating indicator that is derived from a couple of moving averages. What it does is that it measures the crossovers between the two moving averages and measures its separation. The bigger the separation, the stronger the trend.
MACDs excel in assessing mid to longer-term trends. This is because it tends to respond a tad slower than most oscillating indicators and at the same time it also has a smoother oscillation, which in my opinion smoothens out the noise which some indicators are plagued of.
What I like most about the MACD is that it has a couple of plots, a signal line and a histogram. These two lines oscillate above a zero midline and crossover each other. Those crosses between each other is in itself a signal. Also, the cross over the zero line could also be a signal or a filter.
The Trading Strategy Concept
This strategy is built around those signals and filters on the MACD plus a couple of high probability custom technical indicator.
The first technical indicator would be the Volty Channel Stop indicator. It is an indicator that plots lines above or below price. It could be used for many purposes, either a stop loss placement, a trailing stop for exiting in profit, a trend direction bias filter, or an entry signal. For this strategy, we will be using it as an entry signal or indication. A blue Volty line below price indicates a probably start of a bullish trend, while a red Volty line above price could be the start of a bearish trend. We will be taking trades only when a fresh Volty line has appeared.
Next, the Wilders DMI. This indicator also tends to plot the bias of the trend. Lime bars indicate a bullish trend bias, while Tomato bars indicate a bearish trend bias. This indicator will serve as a filter. We will only take trades if the Wilders DMI agrees with our direction.
Lastly, our good old friend, the MACD. We will use it as a filter based on the zero line, and the histogram and signal line crosses. We will only be taking buy (long) trades if the MACDs are above zero and sell (short) trades if below zero. Also, we will be taking buy trades if the histogram is above the signal line and sell trades if it is the reverse.
Timeframe: any
Currency Pair: any
Session: any
Buy (Long) Trade Setup Rules
Entry
Sell (Short) Trade Setup Rules
Entry
Conclusion
This strategy is excellent in catching big wave trends. By having a confluence of all three indications of trend direction, we get to have a high probability trade. This is the main strength of this strategy, the confluence of trend direction bias. Although the entry signal is not surgical as some, where after an entry, price usually goes the direction of the trade, but with the right stop loss placement, this strategy does produce great results.
Because this combination is great at catching big waves, any trailing exit that allows winning trades to run would be great. You could tweak the exit strategy to your own preference if you opt to do trailing stop exits. You could either trail based on fractals formed, or trail using the high or low of the last two or three candles. Some would also opt for a trail stop based on ATR. This would be up to you.
As long as you test your configurations and practice it yourself, you should make some profits if done right.
Indicator based trading systems are one of the best ways to trade the forex market. It is not the only way, but it does work. In fact, most traders use some sort of indicator in one way or another.
There are a lot of advantages to using indicators when trading forex. First, it allows traders to make a sense of what the market might be doing by making the charts more decipherable. An otherwise random walk looking type of chart would start to make sense if you’d put a few indicators on it. Aside from allowing traders to visually decipher what the market is doing, indicators also quantifiably qualify trading setups because the plots on the chart are derived from mathematical equations that come from price itself. Lastly, because indicators are quantifiable, it allows traders to devise a systematic trading approach, more of an if-then set of rules, which would allow traders to have more consistent and measurable results.
The Moving Average Convergence-Divergence Indicator (MACD)
The MACD is one of the staple trading indicators that many traders use. It is an oscillating indicator that is derived from a couple of moving averages. What it does is that it measures the crossovers between the two moving averages and measures its separation. The bigger the separation, the stronger the trend.
MACDs excel in assessing mid to longer-term trends. This is because it tends to respond a tad slower than most oscillating indicators and at the same time it also has a smoother oscillation, which in my opinion smoothens out the noise which some indicators are plagued of.
What I like most about the MACD is that it has a couple of plots, a signal line and a histogram. These two lines oscillate above a zero midline and crossover each other. Those crosses between each other is in itself a signal. Also, the cross over the zero line could also be a signal or a filter.
The Trading Strategy Concept
This strategy is built around those signals and filters on the MACD plus a couple of high probability custom technical indicator.
The first technical indicator would be the Volty Channel Stop indicator. It is an indicator that plots lines above or below price. It could be used for many purposes, either a stop loss placement, a trailing stop for exiting in profit, a trend direction bias filter, or an entry signal. For this strategy, we will be using it as an entry signal or indication. A blue Volty line below price indicates a probably start of a bullish trend, while a red Volty line above price could be the start of a bearish trend. We will be taking trades only when a fresh Volty line has appeared.
Next, the Wilders DMI. This indicator also tends to plot the bias of the trend. Lime bars indicate a bullish trend bias, while Tomato bars indicate a bearish trend bias. This indicator will serve as a filter. We will only take trades if the Wilders DMI agrees with our direction.
Lastly, our good old friend, the MACD. We will use it as a filter based on the zero line, and the histogram and signal line crosses. We will only be taking buy (long) trades if the MACDs are above zero and sell (short) trades if below zero. Also, we will be taking buy trades if the histogram is above the signal line and sell trades if it is the reverse.
Timeframe: any
Currency Pair: any
Session: any
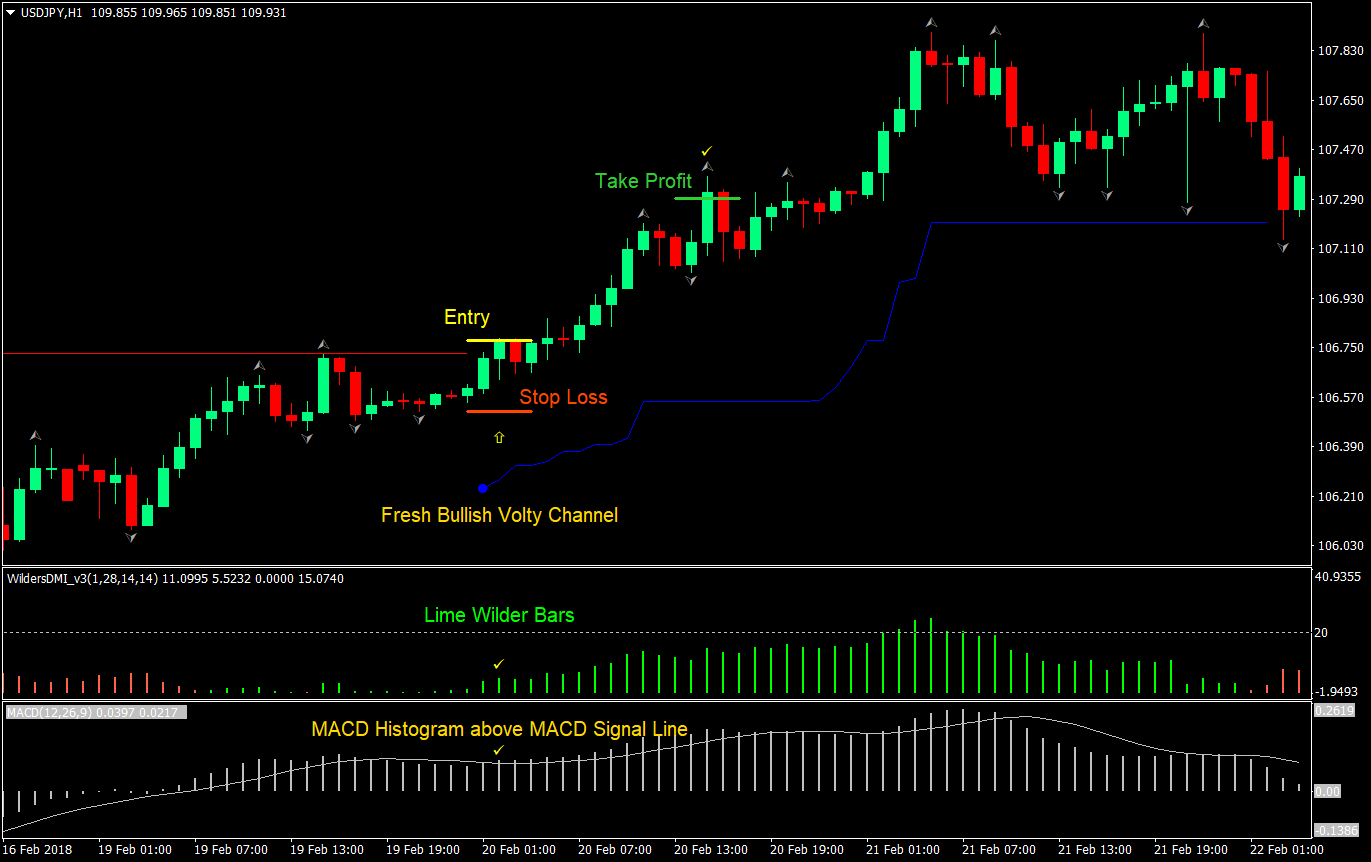
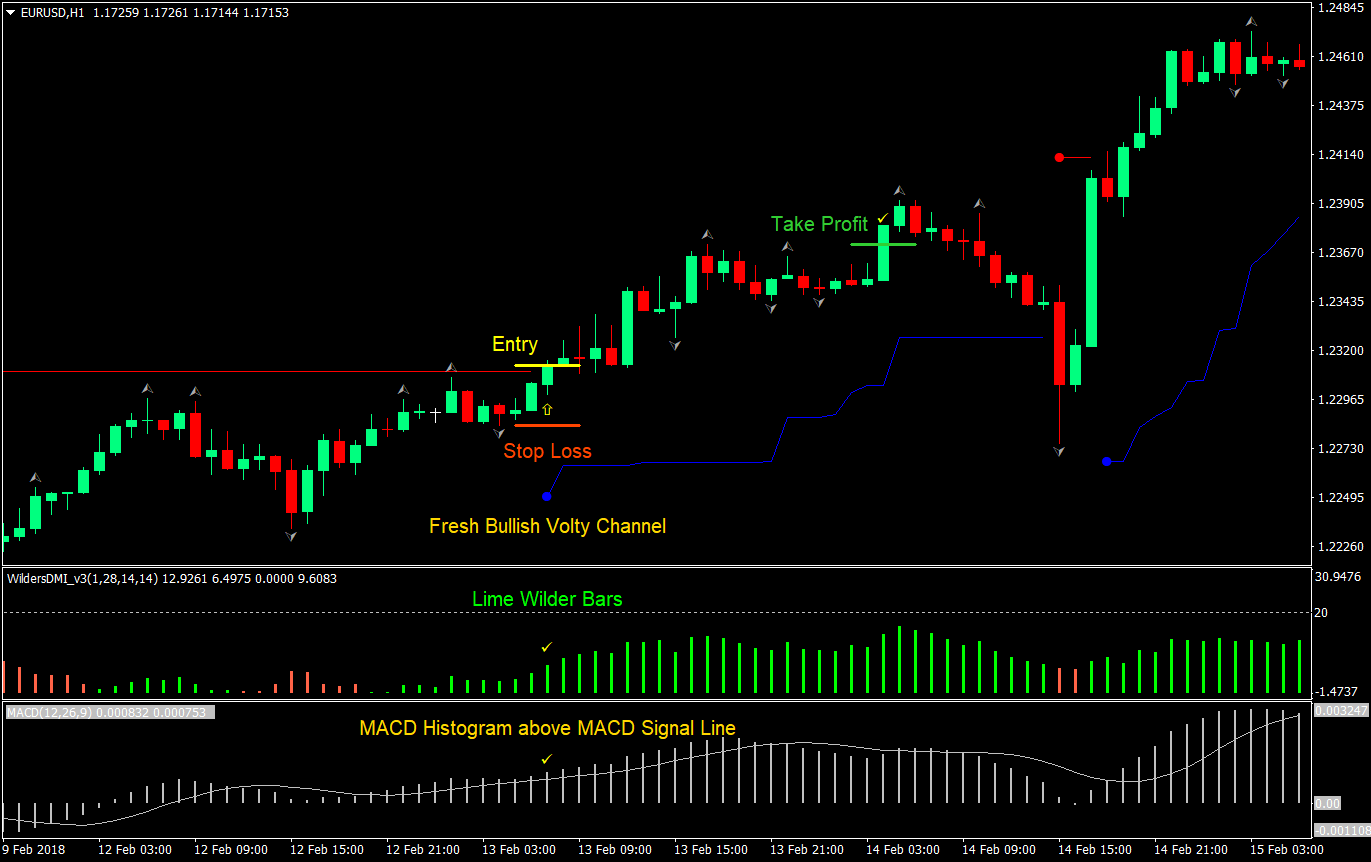
Buy (Long) Trade Setup Rules
Entry
- MACD histogram and signal line should be above zero
- MACD histogram should be above the signal line
- Wilders DMI should print lime signal bars
- A fresh blue Volty line should be printed below price
- Enter a buy market order on the close of the candle coinciding with the confluence of the above rules
- Set the stop loss at the fractal below the entry candle
- Set the target take profit at 2x the risk on the stop loss
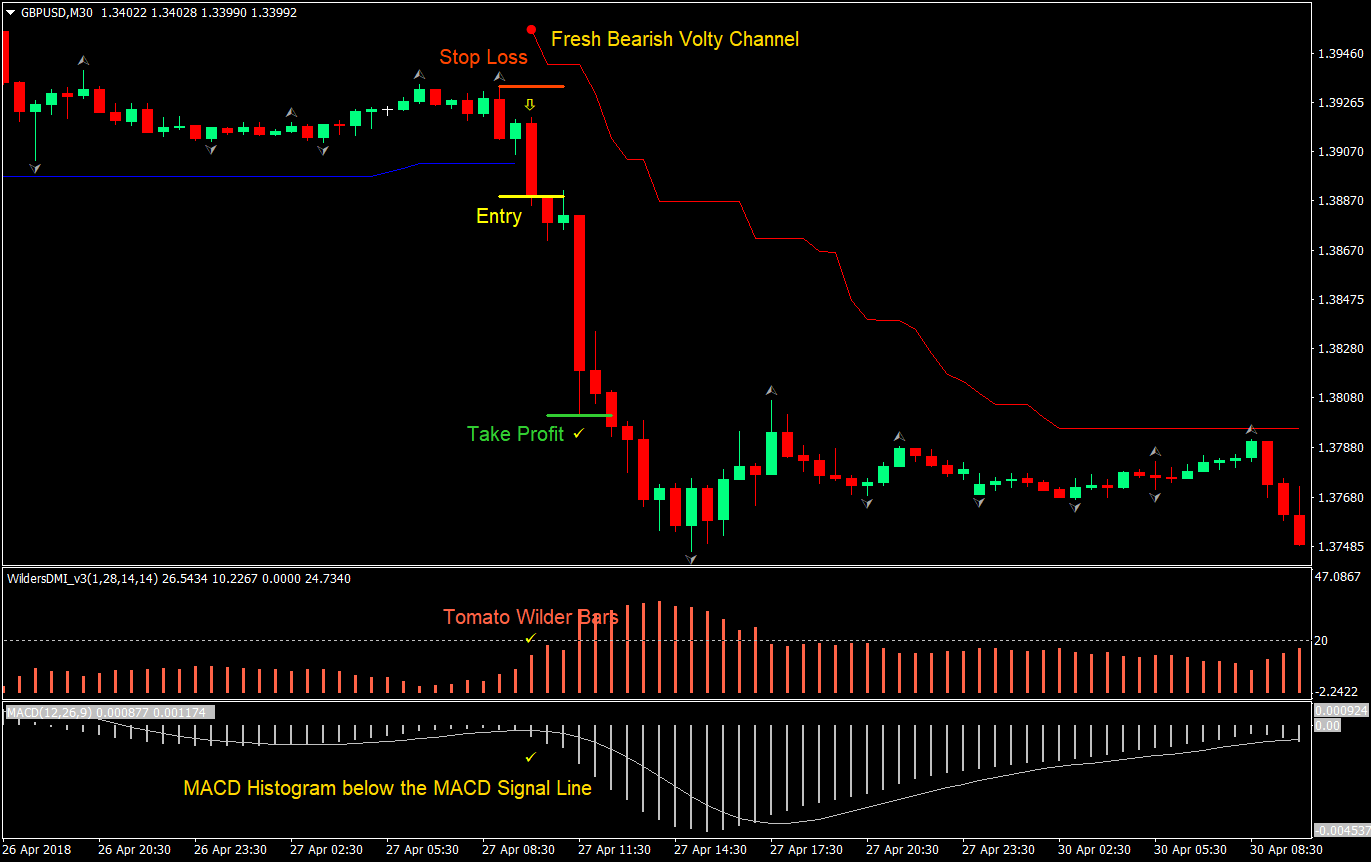
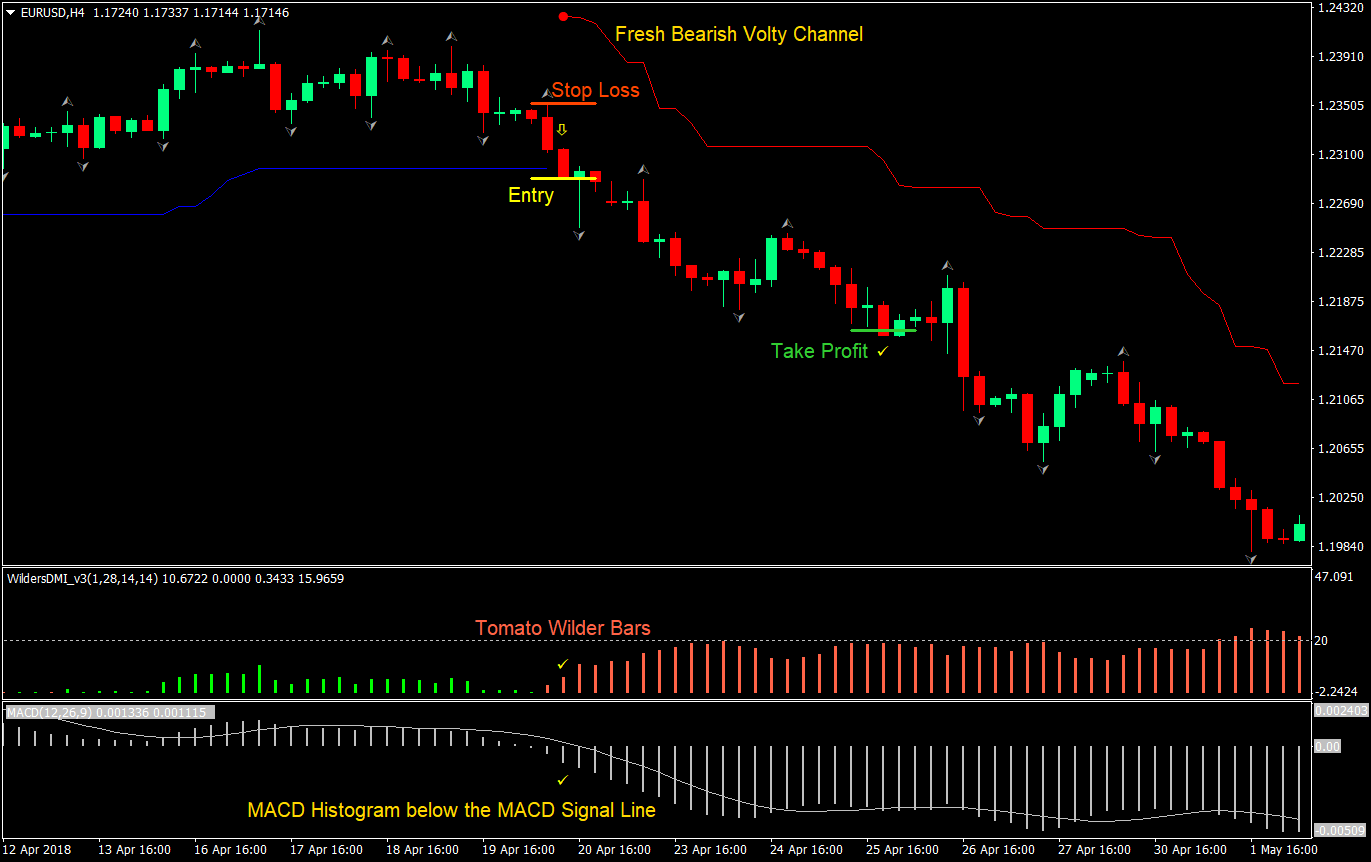
Sell (Short) Trade Setup Rules
Entry
- MACD histogram and signal line should be below zero
- MACD histogram should be below the signal line
- Wilders DMI should print tomato signal bars
- A fresh red Volty line should be printed above price
- Enter a sell market order on the close of the candle coinciding with the confluence of the above rules
- Set the stop loss at the fractal above the entry candle
- Set the target take profit at 2x the risk on the stop loss
Conclusion
This strategy is excellent in catching big wave trends. By having a confluence of all three indications of trend direction, we get to have a high probability trade. This is the main strength of this strategy, the confluence of trend direction bias. Although the entry signal is not surgical as some, where after an entry, price usually goes the direction of the trade, but with the right stop loss placement, this strategy does produce great results.
Because this combination is great at catching big waves, any trailing exit that allows winning trades to run would be great. You could tweak the exit strategy to your own preference if you opt to do trailing stop exits. You could either trail based on fractals formed, or trail using the high or low of the last two or three candles. Some would also opt for a trail stop based on ATR. This would be up to you.
As long as you test your configurations and practice it yourself, you should make some profits if done right.