skrimon
Active Member
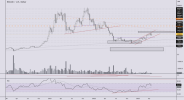
My price target WAS 34k, with the INV HNS pattern. But we have problems
Bullish argument:
INV HNS
Weekly 30 and 50 cross
MACD in the green
Bearish argument:
Reversal divergence RSI daily and 4hr
Low volume
Expanding wedge/ bear flag
Fake out 27/04/23- shows bullish weakness
Currently forming bearish HNS
34 K is still possible, but BTC needs a pullback for RSI to reset. 24k, 22k possible. If so, expect alts to bleed HARD with BTC dominance so high, USD dollar looking for a bounce, and general recession data. Also possible is a new yearly low, it’ll take time, wait for the pullback to confirm, but 10k is the current WCS.
I was really hoping for 34k. Oh well…


