THE CASH BANDS SYSTEM

Download The Cash Bands System instantly, scroll below on this page!
There are absolutely no strings attached… This is my gift to you.
This system is simple — and profitable.
It is so simple that you may think it looks too easy… It really is this easy to trade Forex, and you could be banking pips with this today!
Traders consistently ask for a super-simple, easy to understand, and instant way to begin trading. The Forex Cash Bands system is designed to fit the bill in every way!
With your exclusive Forex Cash Bands gift you get:
You don’t have to give me anything. No money, no credit card number. It is yours right here. Right now.
Introduction
With this system, we want to lay down all the necessary concepts of trading the Cash Bands system.
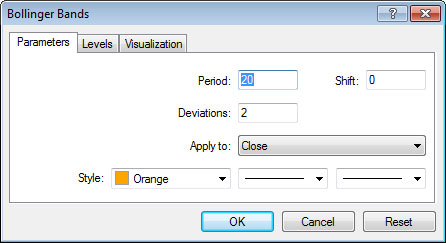
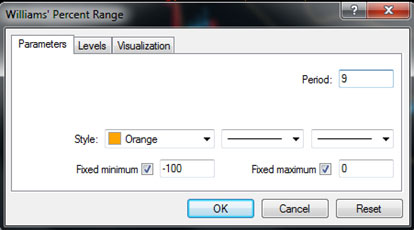
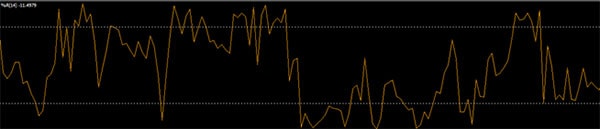
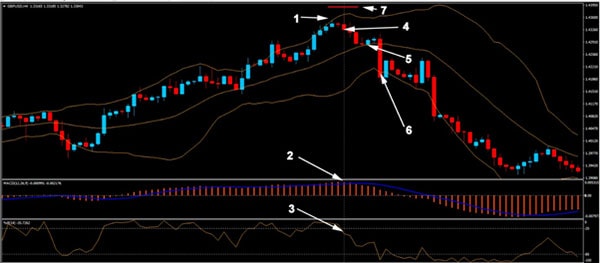
This system can be used by uses a combination of the MACD Histogram, Bollinger Bands and Williams %R indicator.
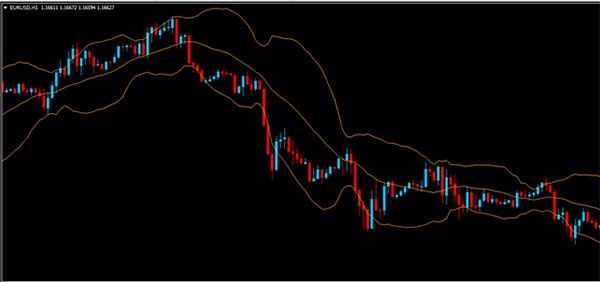
This is a great system when the currency is in a trading range – going in a sideways direction rather than trending up or down.
If you are a beginner, it’s advisable that you limit your use of this system to times when the currency is ranging.
Let’s begin by covering the various indicators that make up the base of the system…
Moving Average Convergence Divergence (MACD)
I. Definition/Description
MACD stands for Moving Average Convergence/Divergence which basically means moving together (convergence) and moving apart (divergence). There is another definition of divergence, but that is a whole other manual altogether. This indicator is based on a short term exponential moving average, 12, a longer term exponential moving average, 26, and a simple moving average of the difference between the two, or signal line, 9.
If you were to place a 12 EMA and a 26 EMA on the charts along with the MACD, each time the EMAs would cross, you would have a crossover of the MACD above or below its zero line, indicating the potential start or finish of a trend.
The farther apart the 12 and 26 EMAs get, the stronger the trend – divergence. The closer they get together, the weaker the trend – convergence.
This indicator was developed in the 1970s by Gerald Appel as a trending momentum indicator and moves above and below a zero line to indicate bias of the market. Above the zero line means the market is trending upwards. Below the zero line means the market is trending downwards.
Now we don’t see the moving averages in the MACD. Instead they are represented by what’s called a histogram. Other signals besides the zero line crossover include the signal line exiting the histogram. This will be the basis for our signals.

II. Application & Settings
We’ll follow the same steps as before to load our MACD only this time we’ll go to Oscillators.

Next, a pop up window appears just like for the SMA. We’re going to Plot MACD Histogram Settings (9, 12, 26, Close, Exponential) leave MACD on the default settings of Fast EMA – 12, Slow EMA – 26, and MACD SMA (single line) 9, applied to close, so your window should look just like the one below.

Now we’re going to change the colors on the second tab – Colors. We’re going to select Red for the Main (histogram).

Next, select the thickness setting just like this….

Next we’re going to change the Signal Color to Blue and have that set on the second thickness setting as well, just like so…

Next we’ll pop over to the Levels tab and click the Add button and then press OK twice and that will add the MACD to your platform.

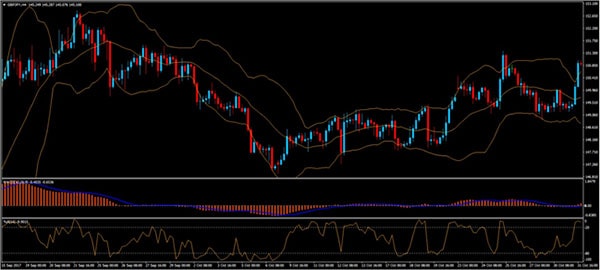
Once on your charts the Macd will look like the image below:

Download The Cash Bands System instantly, scroll below on this page!
There are absolutely no strings attached… This is my gift to you.
This system is simple — and profitable.
It is so simple that you may think it looks too easy… It really is this easy to trade Forex, and you could be banking pips with this today!
Traders consistently ask for a super-simple, easy to understand, and instant way to begin trading. The Forex Cash Bands system is designed to fit the bill in every way!
With your exclusive Forex Cash Bands gift you get:
- A personal video tutorial that takes you through exactly how to make the best possible trades.
- A complete system report, that walks you from the basics through the rules so you will understand how to read every indicator for maximum cash flow.
- This completely free system is a perpetual cash machine, and could have you cranking out consistently successful trades and big profits faster than anything you’ve used yet.
You don’t have to give me anything. No money, no credit card number. It is yours right here. Right now.
Introduction
With this system, we want to lay down all the necessary concepts of trading the Cash Bands system.
This system can be used by uses a combination of the MACD Histogram, Bollinger Bands and Williams %R indicator.
This is a great system when the currency is in a trading range – going in a sideways direction rather than trending up or down.
If you are a beginner, it’s advisable that you limit your use of this system to times when the currency is ranging.
Let’s begin by covering the various indicators that make up the base of the system…
Moving Average Convergence Divergence (MACD)
I. Definition/Description
MACD stands for Moving Average Convergence/Divergence which basically means moving together (convergence) and moving apart (divergence). There is another definition of divergence, but that is a whole other manual altogether. This indicator is based on a short term exponential moving average, 12, a longer term exponential moving average, 26, and a simple moving average of the difference between the two, or signal line, 9.
If you were to place a 12 EMA and a 26 EMA on the charts along with the MACD, each time the EMAs would cross, you would have a crossover of the MACD above or below its zero line, indicating the potential start or finish of a trend.
The farther apart the 12 and 26 EMAs get, the stronger the trend – divergence. The closer they get together, the weaker the trend – convergence.
This indicator was developed in the 1970s by Gerald Appel as a trending momentum indicator and moves above and below a zero line to indicate bias of the market. Above the zero line means the market is trending upwards. Below the zero line means the market is trending downwards.
Now we don’t see the moving averages in the MACD. Instead they are represented by what’s called a histogram. Other signals besides the zero line crossover include the signal line exiting the histogram. This will be the basis for our signals.
II. Application & Settings
We’ll follow the same steps as before to load our MACD only this time we’ll go to Oscillators.
- Insert
- Indicators
- Oscillators
- Left Click MACD
Next, a pop up window appears just like for the SMA. We’re going to Plot MACD Histogram Settings (9, 12, 26, Close, Exponential) leave MACD on the default settings of Fast EMA – 12, Slow EMA – 26, and MACD SMA (single line) 9, applied to close, so your window should look just like the one below.
Now we’re going to change the colors on the second tab – Colors. We’re going to select Red for the Main (histogram).
Next, select the thickness setting just like this….
Next we’re going to change the Signal Color to Blue and have that set on the second thickness setting as well, just like so…
Next we’ll pop over to the Levels tab and click the Add button and then press OK twice and that will add the MACD to your platform.
Once on your charts the Macd will look like the image below: