What's new

5 minutes Scalping Forex

2.00 star(s) 1 Vote

Imtiyaz335

New Member
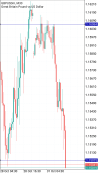
if 5 In order to make money from the forex market in you. Must see first. Where is the market support or resistance? To see this, you have to look at the chart of 30 minutes. In the 30 minute chart. Where is the market from? Most came down. Or from which place it has gone up the most. Just at that place you will put a horizontal line.

Screenshot_20221031-182821-966.png

As you can see in the above chart. We have shown the chart of gbpusd. There is a blue line at the bottom. likewise above there is a blue line The time frame of the chart is 30 minutes. This blue bottom line is support and the blue line above it is resistance , Here's what you see. The market went through our support to the resistance. And from there it turned back. After visiting our support has come.


Now we have created support and resistance in a time frame of 30 minutes. Now how do we do trading so that we can make good profits? Learn to trade.


Screenshot_20221031-194256~3.png

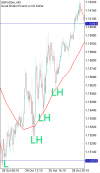
You can see in the above picture. The chart of 5 minute time frame we have taken for trading. And we have put a moving average of 50 in it. With our support, gbpusd wakes up and makes a lower high. As you can see. to HL That's all we have to see HL. The market should move upwards after our support. And HL banaye by touching our moving average of 50. As the moving average makes the first HL. We have to wait for a bullish candle to form. After the bullish candle is formed. Us. have to buy. and put stop loss on us support Similarly here. To you. to sell. Taking a trade to go from top to bottom
 
if 5 In order to make money from the forex market in you. Must see first. Where is the market support or resistance? To see this, you have to look at the chart of 30 minutes. In the 30 minute chart. Where is the market from? Most came down. Or from which place it has gone up the most. Just at that place you will put a horizontal line.


View attachment 23017

As you can see in the above chart. We have shown the chart of gbpusd. There is a blue line at the bottom. likewise above there is a blue line The time frame of the chart is 30 minutes. This blue bottom line is support and the blue line above it is resistance , Here's what you see. The market went through our support to the resistance. And from there it turned back. After visiting our support has come.


Now we have created support and resistance in a time frame of 30 minutes. Now how do we do trading so that we can make good profits? Learn to trade.


View attachment 23019

You can see in the above picture. The chart of 5 minute time frame we have taken for trading. And we have put a moving average of 50 in it. With our support, gbpusd wakes up and makes a lower high. As you can see. to HL That's all we have to see HL. The market should move upwards after our support. And HL banaye by touching our moving average of 50. As the moving average makes the first HL. We have to wait for a bullish candle to form. After the bullish candle is formed. Us. have to buy. and put stop loss on us support Similarly here. To you. to sell. Taking a trade to go from top to bottom
thats a good enrty
 
if 5 In order to make money from the forex market in you. Must see first. Where is the market support or resistance? To see this, you have to look at the chart of 30 minutes. In the 30 minute chart. Where is the market from? Most came down. Or from which place it has gone up the most. Just at that place you will put a horizontal line.


View attachment 23017

As you can see in the above chart. We have shown the chart of gbpusd. There is a blue line at the bottom. likewise above there is a blue line The time frame of the chart is 30 minutes. This blue bottom line is support and the blue line above it is resistance , Here's what you see. The market went through our support to the resistance. And from there it turned back. After visiting our support has come.


Now we have created support and resistance in a time frame of 30 minutes. Now how do we do trading so that we can make good profits? Learn to trade.


View attachment 23019

You can see in the above picture. The chart of 5 minute time frame we have taken for trading. And we have put a moving average of 50 in it. With our support, gbpusd wakes up and makes a lower high. As you can see. to HL That's all we have to see HL. The market should move upwards after our support. And HL banaye by touching our moving average of 50. As the moving average makes the first HL. We have to wait for a bullish candle to form. After the bullish candle is formed. Us. have to buy. and put stop loss on us support Similarly here. To you. to sell. Taking a trade to go from top to bottom

how long you try this strategy?
 

Create an account or login to comment

You must be a member in order to leave a comment

Create account

Create an account on our community. It's easy!

Log in

Already have an account? Log in here.

Members Online

No members online now.

Similar threads

Users Who Are Viewing This Thread (Total: 1, Members: 0, Guests: 1)

Top
AdBlock Detected

We get it, advertisements are annoying!

Sure, ad-blocking software does a great job at blocking ads, but it also blocks useful features of our website. For the best site experience please disable your AdBlocker.

I've Disabled AdBlock    No Thanks