What's new

General EURUSD Chart Analysis

3.70 star(s) 30 Votes


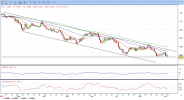
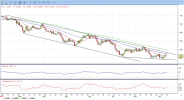
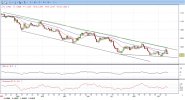
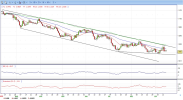
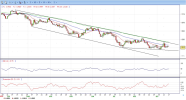
GBPAUD today as you see here, the price is going bullish, it is good if you open buy position to follow the trend, you can open buy position when the price bouncing in support area 1.6980 with potential target up to 1.7048
 
The price broke out on Monday with a small bullish candle which continued for the next two days.

The price managed to reach the first small supply zone around $1.00570 and then stopped.

For the next week we need to wait for the price to make its way outside of the indecision area like this week.

If the price breaks out to the downside and the second candle closes below the first candle it will be indication of bearish pressure and price will mode to $0.96716 support level.
 
Last edited by a moderator:
Resistance Level: 1.0000, 1.0090, 1.0200
Support Level : 0.9875, 0.9800, 0.9750

  • EUR/USD resumes the leg lower and breaks below the 0.9900 level to reach new 2-decade lows in the 0.9880/75 band on Monday. The pair ended Monday with some recovery to around 0.9930, still bearish in the daily chart.
  • Indeed, the US Dollar Index (DXY) rose to more than 20-year highs north of the 110.00 hurdle before the opening bell in the old continent on Monday, as investors continue to adjust to the prospects for extra rate hikes by the Fed in the next months.
  • However, and before the Fed’s event, the ECB will meet later this week and expectations among investors appear to still favour a 75 bps rate hike, all amidst the unabated elevated inflation and with the spectre of the energy crush still hovering around the region.
  • The EUR/USD pair is trading near the 0.9930, down for the day with the bearish stance in daily chart. The pair still develops below all main SMAs, indicates bearish strength. Meanwhile, 20 SMA continues accelerating south and developing below longer ones, suggests bears not exhausted yet. On upside, the immediate resistance is 1.0000, break above this level will extend the advance to 1.0200.
  • Techinical readings in the daily chart support the bearish stances. The RSI indicators hovering below the midlines and stabilized around 36, shows bearish strength. The Momentum indicator stabilized in negative territory, indicating downward potentials. On downside, the immediate support is 0.9875 and below this level will open the gate to 0.9800.

1662467081426.png
 
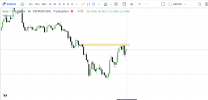
The breakout was a false one on Tuesday and what usually happens after a false breakout the price moved in the opposite direction.

Friday shows price decline after traders taking profits around $1.01368 who bought the price at the $0.99314 which activated a sell off returning the price down.

Next week we need to see the price above the small downtrend channel resistance line with daily close above which will allow price reaching $1.01368 level.


We can expect bearish candle at the confluence area of resistance with price targeting to reach the upper side of the current indecision area which is around $1.0000.
 
Last edited by a moderator:
Resistance Level: 1.0120, 1.0200, 1.0270
Support Level : 1.0000, 0.9875, 0.9800

  • EUR/USD regains upside traction and climbs to levels beyond 1.0100, or multi-week highs, on Friday. It soared above 1.0100 but ended the week with, neutral to bullish in the daily chart.
  • Extra upside in the pair also derives fresh oxygen from the intense selling pressure in the greenback, which currently forces the US Dollar Index (DXY) to confront multi-session lows in the 108.40 zone, all following new cycle highs near 110.80 recorded just a couple of sessions ago.
  • As market participants continue to digest Thursday’s unprecedented interest rate hike by the ECB, Friday’s focus of attention is expected to shift to the EU Energy Ministers emergency meeting amidst the ongoing energy cruch in the region.
  • The EUR/USD pair is trading near the 1.0045, up for the day with the neutral to bullish stance in daily chart. The pair stabilized above 20 SMA, indicates bullish strength in short term. Meanwhile, 20 SMA started turning north and heading towards longer ones, suggests bulls not exhausted yet. On upside, the immediate resistance is 1.0120, break above this level will extend the advance to 1.0200.
  • Techinical readings in the daily chart support the bullish stances. The RSI indicators hovering above the midlines and stabilized around 53, shows bullish strength. The Momentum indicator stabilized near the midline, indicating directionless potentials. On downside, the immediate support is 1.0000 and below this level will open the gate to 0.9800.

1662976141062.png
 
Resistance Level: 1.0120, 1.0200, 1.0270
Support Level : 1.0000, 0.9875, 0.9800

  • EUR/USD regains upside traction and climbs to levels beyond 1.0100, or multi-week highs, on Friday. It soared above 1.0100 but ended the week with, neutral to bullish in the daily chart.
  • Extra upside in the pair also derives fresh oxygen from the intense selling pressure in the greenback, which currently forces the US Dollar Index (DXY) to confront multi-session lows in the 108.40 zone, all following new cycle highs near 110.80 recorded just a couple of sessions ago.
  • As market participants continue to digest Thursday’s unprecedented interest rate hike by the ECB, Friday’s focus of attention is expected to shift to the EU Energy Ministers emergency meeting amidst the ongoing energy cruch in the region.
  • The EUR/USD pair is trading near the 1.0045, up for the day with the neutral to bullish stance in daily chart. The pair stabilized above 20 SMA, indicates bullish strength in short term. Meanwhile, 20 SMA started turning north and heading towards longer ones, suggests bulls not exhausted yet. On upside, the immediate resistance is 1.0120, break above this level will extend the advance to 1.0200.
  • Techinical readings in the daily chart support the bullish stances. The RSI indicators hovering above the midlines and stabilized around 53, shows bullish strength. The Momentum indicator stabilized near the midline, indicating directionless potentials. On downside, the immediate support is 1.0000 and below this level will open the gate to 0.9800.

View attachment 22076
 
Resistance Level: 1.0200, 1.0280, 1.0370
Support Level : 1.0000, 0.9875, 0.9800

  • EUR/USD adds to Friday’s advance and tests fresh peaks near 1.0200 at the beginning of the week. It trimmed some gains but still hold above 1.0100, neutral to bullish in the daily chart.
  • Extra gains in the pair seem to have picked up extra pace following the unprecedented 75 bps interest rate hike by the ECB at its event on September 8, while Monday’s market chatter around the probability that interest rates in the region could move to restrictive territory also lent legs to the single currency.
  • Still around the ECB, Vice-President De Guindos said he does not know how high rates could climb at the time when he stressed that the recent 75 bps hike is expected to anchor inflation expectations.
  • The EUR/USD pair is trading near the 1.0115, up for the day with the neutral to bullish stance in daily chart. The pair stabilized above 20 and 50 SMA, indicates bullish strength in short term. Meanwhile, 20 SMA started turning north and heading towards longer ones, suggests bulls not exhausted yet. On upside, the immediate resistance is 1.0200, break above this level will extend the advance to 1.0280.
  • Techinical readings in the daily chart support the bullish stances. The RSI indicators hovering above the midlines and stabilized around 55, shows bullish strength. The Momentum indicator stabilized near the midline, indicating directionless potentials. On downside, the immediate support is 1.0000 and below this level will open the gate to 0.9800.

1663061174901.png
 
Resistance Level: 1.0200, 1.0280, 1.0370
Support Level : 0.9875, 0.9800, 0.9750

  • EUR/USD printed a fresh low in midday New York near 0.9970 and fell from a high of 1.0187 on the day following the US inflation data. It ended the day near the bottom, bearish in the daily chart.
  • Consumer prices handily beat expectations according to the Labor Department report, underlying inflation picked up amid rising costs for rents and healthcare. The core index significantly exceeded expectations as well, on the back of unrelenting shelter price inflation, rising at a robust 0.6% MoM. The YoY change in headline CPI fell to a four-month low of 8.3%, but prices in the core index accelerated to a five-month high of 6.3% YoY
  • Meanwhile, however, Nomura analysts said on Tuesday that the Fed is likely to raise its short-term interest rate target by a full percentage point at its policy meeting next week, because of the emergence of upside inflation risks. The Federal Reserve will release its policy decision at the close of its two-day meeting next week, on Sept. 20-21.
  • The EUR/USD pair is trading near the 0.9975, down for the day with the bearish stance in daily chart. The pair stabilized below 20 and 50 SMA, indicates bearish strength in short term. Meanwhile, 20 SMA started turning flat but continued developing below longer ones, suggests bears not exhausted yet. On upside, the immediate resistance is 1.0200, break above this level will extend the advance to 1.0280.
  • Techinical readings in the daily chart support the bearish stances. The RSI indicators hovering below the midlines and stabilized around 44, shows bearish strength. The Momentum indicator stabilized in negative territory, indicating downward potentials. On downside, the immediate support is 0.9875 and below this level will open the gate to 0.9800.


1663147741142.png
 
Resistance Level: 1.0200, 1.0280, 1.0370
Support Level : 0.9875, 0.9800, 0.9750

  • The EUR/USD began trading near the day’s lows at 0.9955 but climbed toward the daily high above 1.0020 before losing the parity again. The pair ended Wednesday at 0.9980, bearish in the daily chart.
  • Before Wall Street opened, the US Labor Department reported that prices paid by the producer in August contracted as estimated by 0.1%, flashing signs that the supply chain headwinds are easing. In the meantime, the core reading edged up by 0.4%. In the meantime, annual-based numbers in the Producer Price Index (PPI) decelerated from 9.8% in the previous reading to 8.7%, while the core PPI exceeded estimations of 7%, peaking at around 7.3%.
  • In the Euro area side, July’s Industrial Production fell 2.3% MoM, vs. a contraction of 1.1% estimated, showing the deterioration in the bloc’s economy. As a result, the annually-based reading fell 2.4%, against expectations of 0%. Weakness in Germany spread toward other larger economies in the Eurozone. Meanwhile, Short Term Interest Rates (STIRs) have priced in an 80% chance of an ECB 75 bps rate hike in October, amidst a 250 bps tightening over the next 12 months.
  • The EUR/USD pair is trading near the 0.9980, unchanged for the day with the bearish stance in daily chart. The pair stabilized below 20 and 50 SMA, indicates bearish strength in short term. Meanwhile, 20 SMA started turning flat but continued developing below longer ones, suggests bears not exhausted yet. On upside, the immediate resistance is 1.0200, break above this level will extend the advance to 1.0280.
  • Techinical readings in the daily chart support the bearish stances. The RSI indicators hovering below the midlines and stabilized around 44, shows bearish strength. The Momentum indicator stabilized in negative territory, indicating downward potentials. On downside, the immediate support is 0.9875 and below this level will open the gate to 0.9800.


1663235735588.png
 
Resistance Level: 1.0200, 1.0280, 1.0370
Support Level : 0.9875, 0.9800, 0.9750

  • The EUR/USD began trading at around 0.9980, sliding toward the daily low at 0.9955 in the early European session. However, fresh bids lifted the shared currency towards hitting the daily high at 1.0018 before settling at. The pair ended Thursday at 0.9990, bearish in the daily chart.
  • The US Commerce Department reported that Retail Sales in August jumped by 0.3% MoM, higher than expectations of a 0.1% contraction, while the annual base reading was 9.37%, less than the previous month’s data. At the same time, the Department of Labor showed that unemployment claims for the past week, ending on September 10, decreased to 213K, lower than economists’ estimates of 227K, showing the labor market’s resilience.
  • Of late, a tranche of manufacturing data revealed by regional Fed banks began with the New York Fed Empire State Index and the Philadelphia Fed Index. The New York Fed Index showed signs of improvement though remains in contractionary territory, while the Philadelphia Fed index dropped to the contractionary part after rebounding in the August report.
  • The EUR/USD pair is trading near the 0.9990, unchanged for the day with the bearish stance in daily chart. The pair stabilized below 20 and 50 SMA, indicates bearish strength in short term. Meanwhile, 20 SMA started turning flat but continued developing below longer ones, suggests bears not exhausted yet. On upside, the immediate resistance is 1.0200, break above this level will extend the advance to 1.0280.
  • Techinical readings in the daily chart support the bearish stances. The RSI indicators hovering below the midlines and stabilized around 46, shows bearish strength. The Momentum indicator stabilized in negative territory, indicating downward potentials. On downside, the immediate support is 0.9875 and below this level will open the gate to 0.9800.

1663319807459.png
 
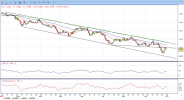
The price opened a week with a gap to the upside and reached the weekly target mentioned last week.

The strong bullish trigger to the upside pushed the price higher and the price reached $1.01960.

The price still needs to break above the small downtrend channel resistance line and small supply zone slightly above that resistance line.

And then the strong supply zone around $1.01368.
 
Last edited by a moderator:
Resistance Level: 1.0200, 1.0280, 1.0370
Support Level : 0.9875, 0.9800, 0.9750

  • The EUR/USD rose from 0.9970 and climbed to 1.0035, hitting the highest level since Tuesday amid a reversal of the US dollar across the board following University of Michigan's Consumer Sentiment report. The pair ended Friday around 1.0015, neutral to bearish in the daily chart.
  • On European hours, the EUR/USD hit the lowest level in a week under 0.9950 and a few hours later printed a multi-day high, driven by a weaker dollar, affected by UoM Consumer Sentiment. The main index rose to 59.2, below the 60 of market consensus. The key numbers were inflation expectations that dropped across the curve.
  • The key event ahead is the FOMC decision on Wednesday. A 75 basis points rate hike is expected. The decision, the dot plot and the tone of the Fed will likely determine the next direction of the EUR/USD.
  • The EUR/USD pair is trading near the 1.0015, up for the day with the bearish stance in daily chart. The pair stabilized below 20 and 50 SMA, indicates bearish strength in short term. Meanwhile, 20 SMA started turning flat but continued developing below longer ones, suggests bears not exhausted yet. On upside, the immediate resistance is 1.0200, break above this level will extend the advance to 1.0280.
  • Techinical readings in the daily chart support the bearish stances. The RSI indicators hovering below the midlines and stabilized around 48, shows bearish strength. The Momentum indicator stabilized near the midline, indicating directionless potentials. On downside, the immediate support is 0.9875 and below this level will open the gate to 0.9800.


1663567787809.png
 
On Monday the price formed a bullish candle with daily close above previous day candle close.

This was indication the price is continuing moving in the same direction as the previous week has ended.

The first small support and demand zone that will hold the price is $0.96000 price that acted as a support in the previous bearish attempt to reach lower levels.

From there we can expect the price to return back up and if the bulls are strong enough the price could reach the first supply zone at $0.98300.
 
Last edited by a moderator:
The price reversed from that demand zone and formed a strong bullish engulfing candle that took the price back to downtrend channel resistance line which is a small confluence of resistance with supply zone at $0.98300.

Higher price level where we can expect the price is around $0.99134 which is the first strong resistance for the price.

On a weekly time frame and monthly time frame we have a price in between support and resistance level where a bullish scenario is likely on a short term.
 
Last edited by a moderator:
Support Level: 0.9700- 0.9630- 0.9535
Resistance Level: 0.9850 - 0.9920- 1.0000

  • The EUR/USD retraces from daily highs of around 0.9853 due to Fed officials expressing the necessity of higher rates for longer. The pair ended Friday around 0.9800, still bearish in the daily chart.
  • A bunch of Fed policymakers crossing news wires, led by Vice-Chair Lael Brainard, expressed that the Fed needs to keep interest rates higher-for-longer, so the bank can attain its goal. She added that the Fed would not pull back prematurely while echoing other colleagues’ expression of not knowing where rates would peak. Later in the same tone, San Francisco’s Mary Daly commented that further hikes were coming and that the Fed is “resolute” in taming inflation.
  • Aside from this, the US Commerce Department revealed that the US Federal Reserve’s favorite measure of inflation, known as the PCE, increased more than estimated in August, at a 0.3% MoM pace, 6.2% YoY, while core PCE, which excludes volatile items, accelerated at a 0.6% MoM, up 4.9% YoY.
  • The EUR/USD pair is trading near the 0.9800, unchanged for the day with the bearish stance in daily chart. The pair still stabilized below 20 and 50 SMA, indicates bearish strength. Meanwhile, 20 SMA continued accelerating south and developing below longer ones, suggests bears not exhausted yet. On upside, the immediate resistance is 0.9830, break above this level will extend the advance to 0.9920.
  • Technical readings in the daily chart support the bearish stances. The RSI indicators hovering below the midlines and stabilized around 43, shows bearish strength. The Momentum indicator stabilized below the midline, indicating downward potentials. On downside, the immediate support is 0.9700 and below this level will open the gate to 0.9630.

1664777638886.png
 
Previous EURUSD forecast mentioned the price could reach $0.99134 and the price succeeded in the first two days.

With closing below support level and on Thursday testing $0,99134 as a resistance level it was a confirmation the price will move down.

The price is falling down and the next support is at $0.96716 where we have a demand zone where the sellers will get out.

The bounce from $0.96716 is likely to reach $0.97000 and then $0.98000 which are smaller resistance levels.
 
Last edited by a moderator:

Create an account or login to comment

You must be a member in order to leave a comment

Create account

Create an account on our community. It's easy!

Log in

Already have an account? Log in here.

Similar threads

Users Who Are Viewing This Thread (Total: 1, Members: 0, Guests: 1)

Top
AdBlock Detected

We get it, advertisements are annoying!

Sure, ad-blocking software does a great job at blocking ads, but it also blocks useful features of our website. For the best site experience please disable your AdBlocker.

I've Disabled AdBlock    No Thanks