What's new

General EURUSD Chart Analysis

3.70 star(s) 30 Votes
The price on Monday has made a first step to make a breakout reaching first resistance level $1.01368 and breaking above with a wick

This was a small signal the price will reach a higher level because the small breakout from the previous week’s small range.

The next week’s target is to break above $1.02975 resistance level.

Because the price is right in the middle between support and resistance levels it is good to wait until the price reaches a lower level close to $1.01368
 
Last edited by a moderator:
Resistance Level: 1.0280, 1.0350, 1.0400
Support Level : 1.0120, 1.0000, 0.9950

  • Following Thursday’s advance to the proximity of the 1.0300 neighbourhood, the pair gives away some of those gains at the end of the week on the back of the resumption of the buying interest surrounding the greenback and dwindling enthusiasm in the wake of the ECB event. The pair ended the week around 1.0210, neutral to bearish in the daily chart.
  • EUR/USD comes under selling pressure on Friday, as market participants seem to have already digested the unexpected ECB 50 bps rate hike, while others appear to have sold the uptick ahead of the weekend and the upcoming FOMC gathering on July 27. However, another test of the parity zone does not look favoured now, as the central bank expects inflation to remain elevated and therefore the door remains open to further hikes at the next couple of meetings
  • Looking at the broader picture, the outlook for the greenback still looks constructive despite occasional bouts of weakness and remains well propped up by the Fed’s normalization plans. In addition, the war in Ukraine and the idea that the spectre of the energy crunch could extend further and hurt the economies in the old continent emerges as a tangible risk for the euro and a solid source of extra weakness in the near term.
  • The EUR/USD pair is trading near the 1.0210, unchanged for the day with the bearish stance in daily chart. The pair still maintains the downward slope and stabilized below 50 and 200 SMAs, bearish in the long term. Meanwhile, 20 SMA continued developing far below longer ones, suggests bears not exhausted yet. On upside, the immediate resistance is 1.0280, break above this level will extend the advance to 1.0350.
  • Techinical readings in the daily chart support the bearish stances. The RSI indicators hovering below the midlines and stabilized around 45, shows bearish strength. The Momentum indicator struggled below the midline, indicating downward potentials. On downside, the immediate support is 1.0120 and below this level will open the gate to 0.9950.

1658728893292.png
 
Resistance Level: 1.0280, 1.0350, 1.0400
Support Level : 1.0100, 1.0000, 0.9950

  • EUR/USD is lower on the day, has been pressured from a high of 1.0250 amid a risk-off tone stemming from both sides of the pond. The pair ended the Tuesday around 1.0120, bearish in the daily chart.
  • In the US, risk appetite was squashed on Wall Street. Profit warnings by Walmart and fears of an inflation-led recession in the US economy have sapped flows from stocks and sent them towards US debt instead and the US dollar. At the same time, the International Monetary Fund sliced its outlook for global growth this year which is supportive of the greenback.
  • Meanwhile, the euro has been hit this week by a poor business sentiment survey in Germany in the wake of the gas crisis. Eurozone growth risks have risen sharply as Russia announced another cut in natural gas shipments. On Monday, Russian energy giant Gazprom said gas flows to Germany through the Nord Stream 1 pipeline would fall to 33 million cubic metres per day from Wednesday, or half of the current flow, which was already at only 40% capacity. Subseqent Kremlin-related commentary has resulted in European Union countries approving a weakened emergency plan to curb their gas demand as they brace for further Russian reductions in supply.
  • The EUR/USD pair is trading near the 1.0120, down for the day with the bearish stance in daily chart. The pair still maintains the downward slope and stabilized below 50 and 200 SMAs, bearish in the long term. Meanwhile, 20 SMA continued developing far below longer ones, suggests bears not exhausted yet. On upside, the immediate resistance is 1.0280, break above this level will extend the advance to 1.0350.
  • Techinical readings in the daily chart support the bearish stances. The RSI indicators hovering below the midlines and stabilized around 39, shows bearish strength. The Momentum indicator struggled below the midline, indicating downward potentials. On downside, the immediate support is 1.0100 and below this level will open the gate to 0.9950.


1658898699062.png
 
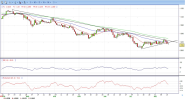
The price started with an indecision candle where the bulls and bears could not take the price to higher or lower levels.

On Tuesday the price strongly moved down making a breakout from the small range that has formed in the previous week.

On the upside we have $1.03600 as a bulls target where the price needs to break above $1.02660 to reach higher levels.

We have now a downtrend resistance line that is on the $1.02975 which will make small pressure on the price and prevent reaching higher levels.
 
Last edited by a moderator:


EURNZD today as we see here, the trend is bullish, so it is good if you open buy position, you can open buy position when the price bounce in support area at 1.6204 with potential target up to 1.6313
 
Resistance Level: 1.0280, 1.0350, 1.0400
Support Level : 1.0200, 1.0100, 1.0000

  • The EUR/USD advances for the fourth consecutive day, amidst an upbeat mood, as investors shrugged off US-China tensions. The pair is trading at 1.0255 after hitting a daily low at 1.0205, though it climbed sharply towards its daily high at 1.0274 but settled around current levels, neutral in the daily chart.
  • During the New York session, the US ISM Manufacturing PMI came in at 52.8, higher than the 52.0 estimations, though it trailed the previous reading at 53. What’s worth noting is that New Orders continue to shrink, from 49.2 in the last month to July 48.0. According to Timothy Fiore, chair of ISM’s Manufacturing Business Survey Committee, “Panelists are now expressing concern about a softening in the economy, as new order rates contracted for the second month amid developing anxiety about excess inventory in the supply chain.”
  • In the meantime, during the European session, German Retail Sales plunged the most since 1994, by 8.8% YoY. Additionally, S&P Global Manufacturing PMIs for the bloc, Germany and France, remain in contractionary territory, fueling speculations of an impending recession in the Eurozone. Nevertheless, the Unemployment rate kept steady, illustrating a tight labor market.
  • The EUR/USD pair is trading near the 1.0255, up for the day with the neutral stance in daily chart. The pair still maintains the downward slope and stabilized below 50 and 200 SMAs, bearish in the long term. Meanwhile, 20 SMA started turning flat but continued developing far below longer ones, suggests bears not exhausted yet. On upside, the immediate resistance is 1.0280, break above this level will extend the advance to 1.0350.
  • Techinical readings in the daily chart support the neutral to bearish stances. The RSI indicators hovering near the midlines and stabilized around 50, shows neutral strength. The Momentum indicator struggled below the midline, indicating downward potentials. On downside, the immediate support is 1.0200 and below this level will open the gate to 1.0000.

1659421857069.png
 
Resistance Level: 1.0300, 1.0370, 1.0430
Support Level : 1.0100, 1.0000, 0.9950

  • EUR/USD is under pressure and has fallen from a high of 1.0210 to a low of 1.0122. It then trimmed some losses and ended Wednesday around 1.0165, neutral to bearish in the daily chart.
  • On Wednesday, US stock futures rose as investor apprehension over hostile US-China relations subsided, yet the euro remains on the backfoot with the greenback firm due to US treasuries declining as a result of hawkish Federal Reserve comments.
  • Markets have been calmer since US House Speaker Nancy Pelosi returned from a trip to Taiwan that sparked a furious response from China. US stocks on Wall Street have advanced with government bond yields after a services gauge unexpectedly advanced and new orders for factory goods beat expectations. This has implied that the projected hike in interest rates this year may not necessarily coincide with an economy in recession, a relief for risk assets in general.
  • The EUR/USD pair is trading near the 1.0165, unchanged for the day with the neutral stance in daily chart. The pair still maintains the downward slope and stabilized below 50 and 200 SMAs, bearish in the long term. Meanwhile, 20 SMA started turning flat but continued developing far below longer ones, suggests bears not exhausted yet. On upside, the immediate resistance is 1.0300, break above this level will extend the advance to 1.0370.
  • Techinical readings in the daily chart support the neutral to bearish stances. The RSI indicators hovering below the midlines and stabilized around 44, shows bearish strength. The Momentum indicator struggled near the midline, indicating directionless potentials. On downside, the immediate support is 1.0100 and below this level will open the gate to 1.0000.

1659595929278.png
 
Resistance Level: 1.0300, 1.0370, 1.0430
Support Level : 1.0100, 1.0000, 0.9950

  • EUR/USD is treading water in the green at the start of the week and holding up by 0.20% in the midday New York session. The pair has ranged between a low of 1.0159 and 1.0221 so far and is currently trying to hold onto 1.0200 but is pressured. It ended Monday just below 1.0200, neutral to bearish in the daily chart.
  • Investors remained cautious as the payrolls data added to expectations of a hawkish US Federal Reserve. US rate futures have priced in a 67.5% chance of a 75-basis-point hike at the Fed's September meeting, up from about 41% before payrolls data on Friday beat market expectations.
  • However, US 10-year yields are anchored below 2.869% so far, ducking below those recently made highs. However, there is daily support in Monday's lows near 2.7610% at this juncture which could mean the relief is temporary with the focus now on consumer prices data on Wednesday. The inflation data will help to confirm if the Fed's tightening efforts have been successful in starting to tame inflation or if continued Fed tightening is needed and could be a critical milestone for forex markets and indeed the euro.
  • The EUR/USD pair is trading near the 1.0190, unchanged for the day with the neutral to bearish stance in daily chart. The pair still maintains the downward slope and stabilized below 50 and 200 SMAs, bearish in the long term. Meanwhile, 20 SMA started turning flat but continued developing below longer ones, suggests bears not exhausted yet. On upside, the immediate resistance is 1.0300, break above this level will extend the advance to 1.0370.
  • Techinical readings in the daily chart support the neutral to bearish stances. The RSI indicators hovering below the midlines and stabilized around 45, shows bearish strength. The Momentum indicator struggled near the midline, indicating directionless potentials. On downside, the immediate support is 1.0100 and below this level will open the gate to 1.0000.


1660036931030.png
 
Resistance Level: 1.0300, 1.0370, 1.0430
Support Level : 1.0100, 1.0000, 0.9950

  • EUR/USD is trading at 1.0216, above its opening price but below its daily high reached during the day at 1.0247. Nevertheless, buyers could not hold the fort or book profits with US economic data looming. It ended Monday around 1.0210, neutral in the daily chart.
  • US equities are trading with minimal losses. A light US calendar keeps investors reassessing last week’s US jobs report, with the US Nonfarm payrolls doubling expectations, increasing by 528K. Nevertheless, traders’ focus has shifted towards the Consumer Price Index (CPI). Estimations of headline inflation lie at 8.7% YoY, less than June’s 9.1%, while core-CPI, which excludes food and energy, is expected to rise by 6.1% YoY, vs. 6.2% in last month’s reading.
  • Across the pond, headlines that Russia’s halted oil pumping through the Druzbha pipeline since Thursday added to an already negative mood, weighing on the EUR/USD. The Russian oil company Transneft blamed problems with payment to UkrTransNafta, the operator of the Ukrainian side.
  • The EUR/USD pair is trading near the 1.0210, unchanged for the day with the neutral stance in daily chart. The pair still maintains the downward slope and stabilized below 50 and 200 SMAs, bearish in the long term. Meanwhile, 20 SMA started turning flat but continued developing below longer ones, suggests bears not exhausted yet. On upside, the immediate resistance is 1.0300, break above this level will extend the advance to 1.0370.
  • Techinical readings in the daily chart support the neutral stances. The RSI indicators hovering near the midlines and stabilized around 50, shows neutral strength. The Momentum indicator struggled above the midline, indicating upward potentials. On downside, the immediate support is 1.0100 and below this level will open the gate to 1.0000.


1660123042110.png
 
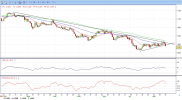
We had a false breakout to the upside where the second candle had returned the price back inside the price range.

When the price reached the resistance line the price broke to the upside and closed the day above price range.

The price could reach $1.02000 level to find better support for future move up.

We now have a price between upper level of a price range and resistance level at $1.02975 which needs to define where the price will move.
 
Last edited by a moderator:
Resistance Level: 1.0370, 1.0430, 1.0500
Support Level : 1.0200, 1.0100, 1.0000
  • The EUR/USD ended Friday at 1.0255 after hitting a daily high at 1.0321, but overall US dollar strength sent the shared currency diving below the 1.03000 figure, towards a fresh two-day low at 1.0238, neutral to bullish in the daily chart.
  • In the meantime, investors’ mood is positive, further underpinned by the University of Michigan’s Consumer Sentiment. The August reading exceeded estimates, at 55.1, higher than the 52.5 forecasted by the street. Meanwhile, consumer inflation expectations for 1-year decreased from 5.2% to 5%, while 5-year rose above 3%, from 2.9%.
  • Across the pond, the Euro area reported Industrial Production, which came better than expected, at 0.7% MoM vs. 0.2%, and May’s reading was upward revised to 2.1%. The annual basis figures rose by 2.4%, vs. 1.0% foreseen. Nevertheless, the ongoing EU energy crisis and fragmentation risks lingering keep the EU economic outlook aiming towards a recession.
  • The EUR/USD pair is trading near the 1.0255, down for the day with the neutral to bullish stance in daily chart. The pair now is challenging upside long-term bearish trend line and stabilized above 20 and 50 SMAs, indicating bullish strength. Meanwhile, 20 SMA started turning north and heading towards longer ones, suggests bulls not exhausted yet. On upside, the immediate resistance is 1.0370, break above this level will extend the advance to 1.0500.
  • Techinical readings in the daily chart support the bullish stances. The RSI indicators hovering near the midlines and stabilized around 50, shows directionless strength. The Momentum indicator struggled above the midline, indicating upward potentials. On downside, the immediate support is 1.0200 and below this level will open the gate to 1.0100.


1660541197205.png
 
Resistance Level: 1.0270, 1.0370, 1.0430
Support Level : 1.0100, 1.0000, 0.9950

  • EUR/USD is falling like a house of cards, having surrendered the 1.0200 mark amid intense buying pressure seen around the US dollar. The pair ended Monday around 1.0160, bearish in the daily chart.
  • Markets prefer to pile onto the dollars heading into Wednesday’s FOMC minutes showdown, which may reveal Fed policymakers' intent on the size of the future rate rises. The minutes may influence the market’s pricing of the September Fed rate hike, eventually impacting the USD valuations.
  • Meanwhile, the souring sentiment-driven sell-off in the US Treasury yields fail to lend any support to the spot. The main currency pair also remains undermined by growing recession risks in the euro area. Europe’s economic powerhouse, Germany, could enter into a recession amid the deepening energy crisis, with sinking Rhine waters making shipping along the river harder and adding to the supply-side issue.
  • The EUR/USD pair is trading near the 1.0160, down for the day with the bearish stance in daily chart. The pair now is developing below all main SMAs, indicating bearish strength. Meanwhile, 20 SMA started turning south and developing below longer ones, suggests bears not exhausted yet. On upside, the immediate resistance is 1.0270, break above this level will extend the advance to 1.0370.
  • Techinical readings in the daily chart support the bearish stances. The RSI indicators hovering below the midlines and stabilized around 43, shows bearish strength. The Momentum indicator struggled below the midline, indicating downward potentials. On downside, the immediate support is 1.0100 and below this level will open the gate to 1.0000.

1660627597678.png
 
Resistance Level: 1.0270, 1.0370, 1.0430
Support Level : 1.0100, 1.0000, 0.9950

  • The EUR/USD rose more than 50 pips from the weekly low it reached earlier at 1.0121. The euro printed a fresh daily high at 1.0194 and then pulled back modestly. The pair ended Tuesday around 1.0170, bearish in the daily chart.
  • The DXY is flat after erasing gains. The Index hit two-week highs near 107.00 and then dropped back toward 106.50. In Wall Street, the Dow Jones is up by 0.73% and the S&P 500 climbs 0.28%. US yields are modestly higher, keeping the dollar’s retreat limited. Economic data from the US came in mixed. Industrial Production rose above expectations in July (0.6% vs 0.3%) while Housing Starts tumbled by 9.6%.
  • Price action around the European currency, in the meantime, is expected to closely follow dollar dynamics, geopolitical concerns, fragmentation worries and the Fed-ECB divergence.
  • The EUR/USD pair is trading near the 1.0170, unchanged for the day with the bearish stance in daily chart. The pair now is developing below all main SMAs, indicating bearish strength. Meanwhile, 20 SMA started turning south and developing below longer ones, suggests bears not exhausted yet. On upside, the immediate resistance is 1.0270, break above this level will extend the advance to 1.0370.
  • Techinical readings in the daily chart support the bearish stances. The RSI indicators hovering below the midlines and stabilized around 45, shows bearish strength. The Momentum indicator struggled below the midline, indicating downward potentials. On downside, the immediate support is 1.0100 and below this level will open the gate to 1.0000.


1660715559873.png1660715559873.png
 
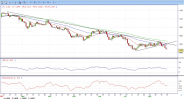
At the end of the week strong selling pressure took the price below $1.01368 support and reached almost parity.

Small bounce back to $1.00700 is likely because this level is a small resistance level where price reacted when moving down.

Long term target is $0.99134 as a strong demand zone where the price will stop moving down.

For now we can expect $1.0000 as a first support and then $1.0070 as a first resistance level.
 
Last edited by a moderator:
Resistance Level: 1.0100, 1.0200, 1.0270
Support Level : 1.0000, 0.9950, 0.9900

  • The EUR/USD slides for the second consecutive day due to broad US dollar strength, courtesy of a dampened market mood spurred by Fed officials’ commentary, while US Treasury bond yield rise. The ended the week at 1.0040 below its opening price after hitting a daily high at 1.0095, still bearish in the daily chart.
  • Fed officials are to blame for recent US dollar strength. On Friday, Richmond’s Fed Thomas Barkin said there’s a lot of time to decide on the size of the September meeting rate hike, adding that the Fed needs to move to restrictive territory. Barkin’s comments echoed Kansas City Fed George, who said that although July CPI data was “encouraging,” the case for further tightening remains strong,
  • In the meantime, on the Eurozone side, the lack of economic releases on Friday left EUR/USD traders leaning towards ECB’s commentary, led by Schnabel. In an interview with Reuters, she said that “any decision is going to be taken on the basis of incoming data. If I look at the most recent data, I would say that the concerns we had in July have not been alleviated.” Echoing Schnabel's comments was ECB’s Kazaks, noting that “we will continue to increase rates” so as to prevent inflation from becoming entrenched.
  • The EUR/USD pair is trading near the 1.0040, down for the day with the bearish stance in daily chart. The pair now is developing below all main SMAs, indicating bearish strength. Meanwhile, 20 SMA started turning south and developing below longer ones, suggests bears not exhausted yet. On upside, the immediate resistance is 1.0100, break above this level will extend the advance to 1.0270.
  • Techinical readings in the daily chart support the bearish stances. The RSI indicators hovering below the midlines and stabilized around 37, shows bearish strength. The Momentum indicator struggled below the midline, indicating downward potentials. On downside, the immediate support is 1.0000 and below this level will open the gate to 0.9950.


1661150162641.png
 
Resistance Level: 1.0000, 1.0100, 1.0200
Support Level : 0.9920, 0.9850, 0.9800

  • EUR/USD has been marking fresh lows below parity in the New York session. The cross has fallen from a high of 1.0046 to a low of 0.9926 on the day so far and is down by some 1% on the day. It settled around 0.9945, still bearish in the daily chart.
  • The ECB meets to discuss monetary policy on Sept. 9. On the weekend, Bundesbank President Joachim Nagel told a German newspaper that the European Central Bank must keep raising rates even if a recession in Germany is increasingly likely, as inflation will stay uncomfortably high through 2023.
  • In the meantime, Russia's announcement late on Friday of a three-day halt to European gas supplies via the Nord Stream 1 pipeline at the end of this month has weighed heavily on the euro for fears that this could tip the economy into a recession in the face of higher inflation.
  • The EUR/USD pair is trading near the 0.9945, down for the day with the bearish stance in daily chart. The pair now is developing below all main SMAs, indicating bearish strength. Meanwhile, 20 SMA continued accelerating south and developing below longer ones, suggests bears not exhausted yet. On upside, the immediate resistance is 1.0000, break above this level will extend the advance to 1.0200.
  • Techinical readings in the daily chart support the bearish stances. The RSI indicators hovering below the midlines and stabilized around 33, shows bearish strength. The Momentum indicator struggled below the midline, indicating downward potentials. On downside, the immediate support is 0.9920 and below this level will open the gate to 0.9850.

1661236805994.png
 
Resistance Level: 1.0020, 1.0100, 1.0200
Support Level : 0.9900, 0.9850, 0.9800

  • The EUR/USD is moving without a clear direction on Thursday ahead of a key speech from Jerome Powell at the Jackson Hole Symposium. The pair failed to hold above parity and then pulled back, finding support above 0.9950, still bearish in the daily chart.
  • The US dollar gained momentum following the release of US economic data. The Q2 GDP growth rate was revised higher from -0.9% to -0.6% and jobless claims declined more than expected. US yields peaked after the reports and then retreated.
  • Regarding the European Central Bank, the minutes from the latest meeting showed a “large number” of members agreed it was appropriate to raise interest rates by 50 basis points. Aside from the numbers, market participants await Powell’s speech to be delivered on Friday. His words could bring clarity regarding the path of the Fed’s monetary policy.
  • The EUR/USD pair is trading near the 0.9975, unchanged for the day with the bearish stance in daily chart. The pair now is developing below all main SMAs, indicating bearish strength. Meanwhile, 20 SMA continued accelerating south and developing below longer ones, suggests bears not exhausted yet. On upside, the immediate resistance is 1.0020, break above this level will extend the advance to 1.0200.
  • Techinical readings in the daily chart support the bearish stances. The RSI indicators hovering below the midlines and stabilized around 34, shows bearish strength. The Momentum indicator struggled below the midline, indicating downward potentials. On downside, the immediate support is 0.9900 and below this level will open the gate to 0.9850.

1661495671299.png
 
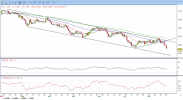
The first day of the trading week the price reached parity and on Tuesday it reached $0.99000

Both, bulls and bears, are pushing in the thier direction, but the last two days shows bulls trying to move the price higher.

In the next week I am expecting the price to make a breakout to the upside reaching $1.00400 which is above previous candle wicks.

From there we need to see will the price return down because of selling pressure or it will stall and try to break to higher levels.
 
Last edited by a moderator:
Create an account or login to comment

You must be a member in order to leave a comment

Create account

Create an account on our community. It's easy!

Log in

Already have an account? Log in here.

Similar threads

Users Who Are Viewing This Thread (Total: 1, Members: 0, Guests: 1)

Top
AdBlock Detected

We get it, advertisements are annoying!

Sure, ad-blocking software does a great job at blocking ads, but it also blocks useful features of our website. For the best site experience please disable your AdBlocker.

I've Disabled AdBlock    No Thanks