What's new

Forex Updates by Solid ECN

5.00 star(s) 1 Vote

Understanding Bitcoin’s Recent Price Recovery​


Bitcoin's price has rebounded from the $60,600 resistance, coinciding with the lows of April 5 and 20. This recovery was anticipated as the RSI indicator was previously in the oversold territory. As of this writing, the indicator is showing bullish signs, having flipped above the 50 level.

Consequently, the BTCUSD pair remains bullish, although it is currently trading below the Ichimoku cloud. The next bullish target is likely the upper band of the flag around $72,000. However, the bulls face the EMA 50 as a barrier, suggesting that there might be a consolidation phase or a minor pullback to the 38.2% Fibonacci support level before the uptrend resumes. This is particularly plausible considering the standard deviation indicator is losing momentum.

A critical factor keeping the market bullish is the $60,600 mark. Should the Bitcoin price dip below this level, the bullish scenario would need to be reevaluated.​
 

Bullish Gold: Navigating the Upswing with Fibonacci and Technical Indicators​


The gold price returned upward after it touched the 38.2% Fibonacci level, which coincides with the EMA 50 and the Ichimoku cloud, at the $2,324 mark. Interestingly, the XAU/USD 4-hour chart formed a bullish long-wick candlestick pattern, which signals the continuation of the bull market.

The yellow metal is trading at about $2,370 as of this writing, slightly above the 23.6% Fibonacci support, and the technical indicators are bullish as well. The RSI indicator hovers above the 50 level, and the Awesome Oscillator bars are green and above the signal line.

From a technical perspective, as long as the price remains above the EMA 50 and inside the flag, the market trend remains bullish. The next target will likely be April’s high at the $2,432 mark.

On the flip side, the bull market is invalidated if the XAU/USD price dips below the 38.2% Fibonacci support.​
 

USDCHF Dips but Bullish Trend Holds​


The USDCHF currency pair experienced a slight decline, touching down at approximately 0.910. This movement brings it close to the lower boundary of the bullish flag—a pattern suggesting a potential rise in value. This specific price point is bolstered by additional support at 0.908 and further underpinned by the Ichimoku cloud.

Despite the dip, no significant candlestick patterns used to forecast price direction changes were observed on the USDCHF 4-hour chart. This absence typically indicates that the current upward trend may continue, provided the price remains above the Ichimoku cloud. Should this scenario hold, the U.S. Dollar will likely climb toward the 0.915 mark, aiming next for the upper boundary of the bullish flag.

However, there is a flip side to consider. If the price falls below 0.9062, it would signal an end to the bullish trend, transitioning into a bear market. Such a drop could increase selling pressure, potentially pushing the price to around 0.899.​
 

Tracking the Dip: U.S. Oil's Technical Outlook​

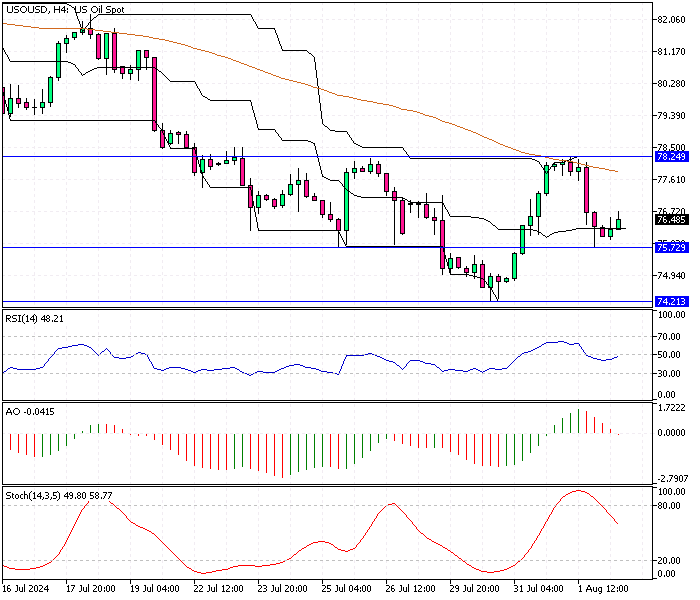
Solid ECN – Oil is trading within a bullish flag pattern, indicating potential for future gains. However, it's crucial to note that it remains above the 50-day Exponential Moving Average (EMA 50), a key indicator that suggests bullish momentum is intact. Nevertheless, the plot has a twist as the technical indicators hint at a bearish trend. The Relative Strength Index (RSI) has dipped below 50, and the Awesome Oscillator shows red bars declining toward the signal line. This combination of signals might indicate a potential shift towards bearish territory, especially if prices continue to fall towards the 50% Fibonacci level, which coincides with the EMA 50.​


Short-Term Forecast and Trading Suggestions​

The market appears to be entering a consolidation phase, with a possible decline to the lower boundary of the bullish flag at $76.0. For the bearish trend to gain momentum, prices must breach significant support levels, including the EMA 50 and the psychological $80.0 mark. Traders should closely monitor these levels as they could dictate the market's short-term direction.

Today, we expect the downward trend to extend to the $80.0 support level. If this level fails, further declines could push the price to approximately $77.0 per barrel. Keeping up-to-date on these developments is crucial for traders and market analysts alike.​
 

GBPUSD Sideways Movement: Bearish Signals Despite Consolidation​


Solid ECN—The GBPUSD currency pair trades sideways between 1.249 and 1.240. The Bollinger Bands are squeezed and demonstrate the range area on the 4-hour chart. Other technical indicators, except Standard Deviation, signal and promise a bullish trend while the uptick momentum is weak, and we don't see strength from the buyers.

From a technical standpoint, the primary trend is bearish while the pair hovers below EMA 50 and the Ichimoku cloud. However, the current consolidation phase might test the EMA 50 again in today's trading session, potentially forming a double-top pattern on the 4-hour chart.

Consequently, a failure to stabilize the price above 1.2499 will likely lead to a decline, and initially, the pair would test this week's low at 1.240 support.​
 

Create an account or login to comment

You must be a member in order to leave a comment

Create account

Create an account on our community. It's easy!

Log in

Already have an account? Log in here.

Similar threads

Users Who Are Viewing This Thread (Total: 1, Members: 0, Guests: 1)

Top
AdBlock Detected

We get it, advertisements are annoying!

Sure, ad-blocking software does a great job at blocking ads, but it also blocks useful features of our website. For the best site experience please disable your AdBlocker.

I've Disabled AdBlock    No Thanks