DominicWAlsh
Member
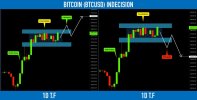
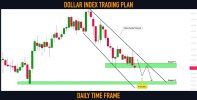
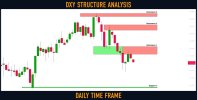
Dollar Index (#DXY): Key Levels to Watch This Week
Here is my latest structure for Dollar Index.
Resistance 1: 103.11 - 103.63 area
Resistance 2: 104.74 - 105.1 area
Resistance 3: 105.667 - 105.88 area
Support 1: 100.82 - 100.88 area
Consider these structures for pullback/breakout trading.
Here is my latest structure for Dollar Index.
Resistance 1: 103.11 - 103.63 area
Resistance 2: 104.74 - 105.1 area
Resistance 3: 105.667 - 105.88 area
Support 1: 100.82 - 100.88 area
Consider these structures for pullback/breakout trading.
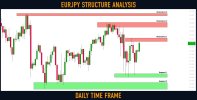
 EURJPY.