What's new

My personal FX pairs and XAUUSD analysis

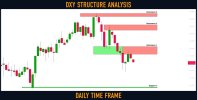
Dollar Index (#DXY): Key Levels to Watch This Week

Here is my latest structure for Dollar Index.

Resistance 1: 103.11 - 103.63 area
Resistance 2: 104.74 - 105.1 area
Resistance 3: 105.667 - 105.88 area

Support 1: 100.82 - 100.88 area

Consider these structures for pullback/breakout trading.
 

Attachments

  • dxy.jpg
    dxy.jpg
    89.3 KB · Views: 2
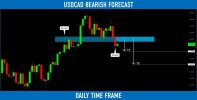
#USDCAD: Important Breakout

USDCAD broke and closed below a solid horizontal demand cluster on a daily.
The broken structure turned into resistance now.

Probabilities will be high to see a bearish move from that.
The goals will be 1.356 / 1.346
 

Attachments

  • usdcad.jpg
    usdcad.jpg
    86.3 KB · Views: 2
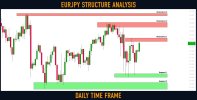
#EURJPY: Detailed Structure Analysis

Here are my latest structure analysis for ⚠️EURJPY.

Support 1: 138.80 - 139.25 area
Support 2: 137.38 - 138.18 area

Resistance 1: 143.19 - 143.6 area
Resistance 2: 145.00 - 145.58 area
Resistance 3: 146.40 - 146.7 area

Consider these structures for pullback/breakout trading.
 

Attachments

  • eurjpy.jpg
    eurjpy.jpg
    117.6 KB · Views: 2
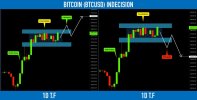
BITCOIN (#BTCUSD): Waiting For The Next Move ₿

⚠️Bitcoin is consolidating after a sharp bullish rally.
The price is coiling within a horizontal trading range on a daily.

Depending on the reaction of the price to its boundaries, I see 2 potential scenarios.

Bullish
If the price breaks and closes above 28950 on a daily,
I will expect a bullish trend continuation.
Target will be 31000.

Bearish
If the price drops and closes below 26300 on a daily,
a bearish move will be expected.
Goal will be 24300.

Because the trend is bullish, I am on a bulls' side as well.
However, let's see what will happen.
 

Attachments

  • btc.jpg
    btc.jpg
    59.4 KB · Views: 2
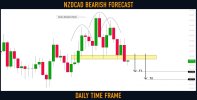
#NZDCAD: Classic Bearish Pattern

NZDCAD formed a head & shoulders pattern on a daily time frame.
Its neckline was successfully broken yesterday.

I expect a further decline on the pair.
Targets: 0.84 / 0.837
 

Attachments

  • nzdcad.jpg
    nzdcad.jpg
    92.4 KB · Views: 2
Market Breakdown | GOLD, USDJPY, SILVER, US30

Here are the updates & outlook for multiple instruments in my watchlist.

Gold (#XAUUSD) 4h time frame
Gold is perfectly respecting a minor rising trend line .
So far, I would expect a bullish continuation from that.
Goal for buyers might be the underlined yellow resistance.

If you are looking for shorting, consider a bearish breakout of the trend line .
I can give you a perfect confirmation to sell.

#USDJPY daily time frame
The market is approaching a solid horizontal resistance.
Taking into consideration that the pair is quite overbought and trading in a bearish trend ,
I believe that probabilities will be high to see a bearish move from that.

Silver (#XAGUSD) 4h time frame
I spotted a cute bullish accumulation pattern - an ascending triangle formation.
The price has successfully violated its neckline.
It looks like the market will keep growing.

Dow Jones (#US30) daily time frame
The market is approaching a solid daily resistance.
We see its breakout attempt now.
If a daily candle closes above that, the Index may go much higher.
 

Attachments

  • market.jpg
    market.jpg
    105.5 KB · Views: 3
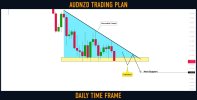
#AUDNZD: Waiting For Breakout

⚠️AUDNZD is trading in a bearish trend.
The price is currently accumulating within a descending triangle formation.

1.067 - 1.069 is its neckline.
If the price breaks and closes below that on a daily, probabilities will be high that the market will drop lower.
Next support will be 1.0627
 

Attachments

  • audnzd.jpg
    audnzd.jpg
    80.6 KB · Views: 2
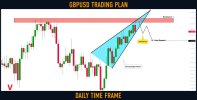
#GBPUSD: Your Detailed Trading Plan For This Week

⚠️GBPUSD is approaching a key daily structure resistance.
The price is currently stuck with a rising wedge pattern.

To catch a bearish move from that, watch a reaction of the price to the support of the wedge.
If the price breaks and closes below that on a daily, a bearish move will be expected
at least to 1.225.

Alternatively, a bullish breakout of the underlined resistance will push the price much higher.
 

Attachments

  • gbpusd.jpg
    gbpusd.jpg
    70.4 KB · Views: 2
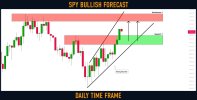
S&P500 Index (#SPY): Bullish Outlook Explained

S&P500 Index is trading in a rising channel on a daily.
The price was approaching a solid resistance cluster on Thursday and Friday.
The market managed to break that and successfully closed above.

I believe that the Index may go higher this week.
Next goal for buyers will be 4155
 

Attachments

  • spy.jpg
    spy.jpg
    99.5 KB · Views: 2
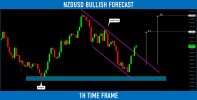
#NZDUSD: Bullish Setup Explained

NZDUSD reached a solid horizontal support.
The price was steadily falling within a bullish flag pattern.
Once the underlined structure was reached, the market bounced
and broke the resistance of the flag.

I believe the pair will go higher now.
Goals: 0.6267 / 0.62895
 

Attachments

  • nzdusd.jpg
    nzdusd.jpg
    102.2 KB · Views: 2
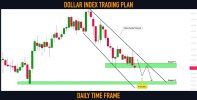
Dollar Index (#DXY): Waiting For Breakout

Dollar Index is trading in a minor bearish trend on a daily.
The market is steadily falling within a falling parallel channel.

The Index is currently approaching a solid horizontal support.
I believe that the fall will resume after its breakout.
To confirm that, we will need a daily candle close below 101.9.

A bearish continuation will be expected to 101.0 support then.
For Additional confirmation use: the Momentum Indicator
 

Attachments

  • dxy.jpg
    dxy.jpg
    105.3 KB · Views: 2

Create an account or login to comment

You must be a member in order to leave a comment

Create account

Create an account on our community. It's easy!

Log in

Already have an account? Log in here.

Members Online

No members online now.

Similar threads

Users Who Are Viewing This Thread (Total: 1, Members: 0, Guests: 1)

Top
AdBlock Detected

We get it, advertisements are annoying!

Sure, ad-blocking software does a great job at blocking ads, but it also blocks useful features of our website. For the best site experience please disable your AdBlocker.

I've Disabled AdBlock    No Thanks