What's new

My personal FX pairs and XAUUSD analysis

#CADCHF: Important Breakout

CADCHF was coiling for more than a month within a wide horizontal trading range on a daily.
Its support was finally broken yesterday.

I believe that the pair will keep falling now.
Next support - 0.679
 

Attachments

  • cadchf.jpg
    cadchf.jpg
    111.6 KB · Views: 2
#USDCHF: Bearish Move From Key Level

USDCHF looks overbought to me,
The price formed a double top pattern approaching a key structure resistance.
Its neckline has been just broken.

Probabilities are high that we will see a correctional movement on the pair.
Goals: 0.935 / 0.931
 

Attachments

  • usdchf.jpg
    usdchf.jpg
    63.7 KB · Views: 2
#USDCHF: Detailed Technical Outlook

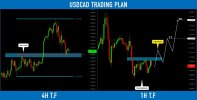
⚠️USDCHF is currently consolidating.
The price is stuck between 2 horizontal key levels that compose a range.

0.9425 - 0.946 is the resistance of the range.
0.9285 - 0.9306 is the support of the range.

Depending on the reaction of the price to its boundaries,
I see 2 potential scenarios:

1️⃣If the price breaks and closes above the resistance of the range,
a bullish continuation will be expected at least to 0.9537.

2️⃣If the price breaks and closes below the support of the range,
a bearish move will be expected to 0.9193 support.

Wait for a breakout, that will clarify the future direction of the market.
 

Attachments

  • usdchf.jpg
    usdchf.jpg
    120.9 KB · Views: 2
Binance Coin (#BNBUSD): Very Bearish Outlook! Here is Why:

Have you seen that huge head & shoulders pattern that was formed
on Binance Coin on a daily.

After yesterday's fundamentals, the price successfully violated its neckline and closed below that.
Probabilities are high now, and the market will keep falling.

Goals: 256 / 243
 

Attachments

  • bnbusd.jpg
    bnbusd.jpg
    56.8 KB · Views: 2
#GBPAUD: Time For Pullback

GBPAUD reached a key daily structure resistance.
The market was nicely rejected from that on 4H first,
then, a bearish engulfing candle was formed.

I expect a retracement from that structure.
Goal - 1.804
 

Attachments

  • gbpaud.jpg
    gbpaud.jpg
    97.3 KB · Views: 2
S&P500 Index (#SPY) Bearish Outlook Explained

S&P500 reached a solid horizontal key level.
The price formed a tiny double top on that and a doji candle.
Now, bears are pushing.

I expect a fall to 3886 / 3851
 

Attachments

  • 500.jpg
    500.jpg
    57.4 KB · Views: 2
#NZDJPY: Pullback From Key Level

NZDJPY formed a cute double bottom pattern on a solid support on 1H time frame.
Its neckline has just been broken.

I expect a pullback to 83.24
 

Attachments

  • nzdjpy.jpg
    nzdjpy.jpg
    52.6 KB · Views: 2
#CHFJPY: Bullish Continuation Pattern

CHFJPY is trading in a minor bullish trend on a daily.
The price was accumulating for 3 weeks within an ascending triangle formation.
Its resistance was broken on Friday, we see its retest now.

I expect a bullish continuation to 148.3
 

Attachments

  • chfjpy.jpg
    chfjpy.jpg
    99.5 KB · Views: 2
#EURCHF: Trend-Following Setup

EURCHF is approaching a confluence zone based on a horizontal supply area
and 618 retracement of the last bearish impulse.

The price formed a head & shoulders pattern, testing that.
Its neckline was broken then.

I expect a bearish move to 0.9732
 

Attachments

  • eurchf.jpg
    eurchf.jpg
    62.6 KB · Views: 2
#EURCAD: Important Breakout!

EURCAD was consolidating for 3 months on a weekly.
The price was coiling within a horizontal range.
Its upper boundary was broken last week, and a weekly candle closed above that.

Probabilities will be high, that a new bullish wave will initiate soon.

Next resistance - 1.5
 

Attachments

  • eurcad.jpg
    eurcad.jpg
    94.9 KB · Views: 2
#USDCAD: Your Trading Plan For Today

⚠️USDCAD is consolidating on a key level.
We see a narrow horizontal range on 1H time frame.

To buy the pair with a confirmation, watch 1.369 - 1.37 horizontal resistance.
If the price breaks and closes above that on 1H, the probability will be high that we will see
a pullback from the underlined structure.

The goals will be 1.374 / 1.378

If the price sets a new lower low, the setup will become invalid.
 

Attachments

  • usdcad.jpg
    usdcad.jpg
    111.3 KB · Views: 2
CRUDE OIL (#WTI) Bearish Setup Explained

On a today's live stream, we discussed WTI Oil.
The price formed a tiny double top pattern on 1H time frame,
approaching a wide supply cluster.
Its neckline was broken.

I expect a bearish continuation to 70.9 now.
 

Attachments

  • oil.jpg
    oil.jpg
    81.9 KB · Views: 2
#CADCHF: Bearish Move From Key Level

CADCHF is approaching a key daily structure resistance.
The price formed a double top pattern on an hourly time frame
and broke its neckline to the downside then.

I expect the retracement from the underlined zone.
Goals: 0.673 / 0.67
 

Attachments

  • cadchf.jpg
    cadchf.jpg
    100.7 KB · Views: 2
GOLD (#XAUUSD): Key Levels to Watch

Here is my updated structure analysis for Gold.

Support 1: 1875 - 1890 area
Support 2: 1855 - 1858 area
Support 3: 1805 - 1813 area

Resistance 1: 1950 - 1960 area
Resistance 2: 1978 - 1998 area

As I predicted on a live stream, the price nicely bounced from Support 1.
I believe that the market will head towards Resistance 1.

Consider the underlined structures for pullback / breakout trading.
 

Attachments

  • gold.jpg
    gold.jpg
    100.4 KB · Views: 2
Dow Jones Index (#US30): Waiting For Breakout

⚠️Dow Jones Index is very bearish since 7th of March.
Currently, the price is stuck on a solid horizontal support, though.

For now, I am patiently waiting for its breakout.
Daily candle close below that area will confirm the violation.

A bearish wave will be expected then at least to 30900 support.

I will post an update once I spot a confirmed breakout.
 

Attachments

  • us30.jpg
    us30.jpg
    93.5 KB · Views: 2
#EURCAD: Top-Down Analysis & Trading Plan

⚠️EURCAD is approaching a peculiar horizontal demand zone.
The price formed a doji candle, testing that on a daily.

Analyzing a 4H, I spotted a double bottom with a higher low.
1.458 - 1.462 is its neckline.
If the price breaks and closes above that on 4H, I will expect a bullish movement.

Goals will be 1.469 / 1.473.

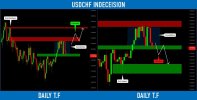
❗️If the price sets a new low though, the setup will become invalid
 

Attachments

  • eurcad.jpg
    eurcad.jpg
    61.6 KB · Views: 2
#CADJPY: Bullish Outlook Explained

CADJPY formed a cute double bottom on a key horizontal support on 4H.
Its neckline was broken during the Asian session.

I believe that the pair will most likely bounce.
Target - 98.3
 

Attachments

  • cadjpy.jpg
    cadjpy.jpg
    88.9 KB · Views: 2
Bitcoin (#BTCUSD) has just broken a new yearly high!

Bulls are pushing Bitcoin again.
The price have updated a new high and currently approaching 27000 level.

From a technical perspective, we see a breakout attempt of a major weekly resistance cluster.
The weekly candle closes in 2 days. Closing above the underlined area, Bitcoin will open a potential
for a further bullish continuation.
 

Attachments

  • btc.jpg
    btc.jpg
    69.7 KB · Views: 2
Gold (#XAUUSD): Your Trading Plan For This Week


⚠️Gold is unstoppable.

The market closed, forming a high momentum bullish candle on a daily.

The price is currently approaching a solid resistance cluster.


To catch a bullish continuation, watch 1977 - 2000 area.

If the price breaks and closes above that, probabilities will be high,

that the market will go much higher.


Next goal for buyers will be 2050.
 

Attachments

  • gold.jpg
    gold.jpg
    116 KB · Views: 3
#EURCAD: Time to Grow!
Update for my Friday's post on EURCAD.
The price has perfectly respected a horizontal key level on a daily:
after a formation of a double bottom pattern on 4H, its neckline was successfully broken.

Now, a bullish continuation is expected.
Targets: 1.469 / 1.4735
 

Attachments

  • eurcad.jpg
    eurcad.jpg
    66 KB · Views: 3

Create an account or login to comment

You must be a member in order to leave a comment

Create account

Create an account on our community. It's easy!

Log in

Already have an account? Log in here.

Similar threads

Users Who Are Viewing This Thread (Total: 1, Members: 0, Guests: 1)

Top
AdBlock Detected

We get it, advertisements are annoying!

Sure, ad-blocking software does a great job at blocking ads, but it also blocks useful features of our website. For the best site experience please disable your AdBlocker.

I've Disabled AdBlock    No Thanks