What's new

My personal FX pairs and XAUUSD analysis

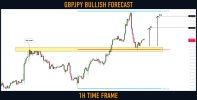
#GBPJPY: Classic Trend Following

GBPJPY remains very bullish from the beginning of the year.
After the last impulsive movement, the market retraced to a peculiar confluence zone.
I see a perfect match between 0.5 retracement of the last bullish leg and a horizontal structure support.

I will expect a pullback from that to 165.0 / 165.7
 

Attachments

  • gbpjpy.jpg
    gbpjpy.jpg
    93 KB · Views: 2
#USDCHF: Detailed Structure Analysis

Here is my latest structure analysis for ⚠️USDCHF.

Support 1: 0.928 - 0.933 area
Support 2: 0.922 - 0.923 area
Support 3: 0.9137 - 0.916 area

Resistance 1: 0.942 - 0.946 area
Resistance 2: 0.954 - 0.955 area

Consider these structure for pullback/breakout trading.
 

Attachments

  • usdchf.jpg
    usdchf.jpg
    111.5 KB · Views: 2
Dow Jones Index (#US30): Oversold Market & Pullback

Dow Jones Index reached a key level.
Testing that, the price formed an inverted head & shoulders pattern on an hourly time frame
and broke a resistance line of a falling wedge pattern then.

I expect a pullback now.
Goals: 32950 / 33110
 

Attachments

  • us30.jpg
    us30.jpg
    113.8 KB · Views: 2
Crude Oil (#WTI): Bearish Outlook Explained

Crude Oil is coiling on a key horizontal resistance.
The price formed a double top pattern, testing that
and broke its neckline then.

We may see a retracement from the underlined blue zone.
Goals: 76.9 / 76.36
 

Attachments

  • oil.jpg
    oil.jpg
    92.7 KB · Views: 2
#EURCAD: Important Breakout

EURCAD broke and closed above a major horizontal supply cluster with a high momentum bullish candle yesterday.
1.441 - 1.446 is now turned into a demand zone.

I will expect a bullish wave from that area to 1.455 / 1.46 levels.
 

Attachments

  • eurcad.jpg
    eurcad.jpg
    59.8 KB · Views: 2
#CADCHF: Bearish Move From Key Level

It looks like CADCHF may drop.
The price reached a solid horizontal resistance and formed a tiny double top pattern on an hourly time frame. Now we see a strong bearish pressure.

I expect a bearish continuation to 0.6913 / 0.6905
 

Attachments

  • cadchf.jpg
    cadchf.jpg
    85.4 KB · Views: 2
#GBPCAD: Your Trading Plan For Today

⚠️GBPCAD is coiling on a key level.
I see a horizontal trading range on 1H time frame.

1.6263 - 1.6274 is its neckline.
Wait for its bullish breakout (hourly candle close above).
It will be your confirmation to buy.

Open long aggressively or on a retest then.
Goals will be 1.6307 / 1.633

If the price sets a new lower low, the setup will become invalid.
 

Attachments

  • gbpcad.jpg
    gbpcad.jpg
    105.2 KB · Views: 2
#NZDCAD: Bullish Outlook Explained

NZDCAD is taking off from a key horizontal support.
The price formed a double bottom on that and broke its neckline then.

I expect a bullish continuation to 0.851 / 0.854
 

Attachments

  • nzdcad.jpg
    nzdcad.jpg
    89.6 KB · Views: 2
Gold (#XAUUSD): Key Levels to Watch This Week

Here is my latest structure analysis for ⚠️Gold.

Support 1: 1843 - 1853 area
Support 2: 1804 - 1811 area

Resistance 1: 1875 - 1904 area
Resistance 2: 1950 - 1959 area

Consider these structures for pullback/breakout trading next week.
 

Attachments

  • gold.jpg
    gold.jpg
    60.4 KB · Views: 2
#AUDNZD: Bearish Outlook Explained

AUDNZD is testing a wide daily horizontal supply area.
The price formed a double top pattern, approaching that on an hourly time frame
and broke its neckline with a high momentum bearish candle.

I expect a retracement to 1.0848 / 1.0828
 

Attachments

  • audnzd.jpg
    audnzd.jpg
    102.5 KB · Views: 2
S&P500 Index (#SPY): Time to Sell

S&P500 Index is testing a wide daily horizontal resistance cluster.
Probabilities will be high to see a bearish reaction from that.

I believe that the market may drop today to 4032 / 4021 levels.
 

Attachments

  • spy.jpg
    spy.jpg
    98.3 KB · Views: 2
BITCOIN (#BTCUSD): Detailed Technical Outlook ₿

⚠️Bitcoin successfully violated a wide horizontal daily demand area.
The broken structure turned into a supply zone.

The market is correcting now.
I spotted a bearish flag pattern on 4H time frame.
Its bearish breakout may initiate the next sell off.
Watch carefully the reaction of the price to its rising support.
Consider shorting after a 4H candle close below with initial target being 22100.
 

Attachments

  • bitcoin.jpg
    bitcoin.jpg
    66.3 KB · Views: 2
Gold (#XAUUSD): Time For Pullback

Gold is approaching a wide horizontal demand cluster on 4H.
Taking into consideration, that the market is trading in a minor bullish trend,
probabilities will be high to see a pullback from the underlined area.

I expect growth to 1855 / 1862
 

Attachments

  • gold.jpg
    gold.jpg
    92 KB · Views: 2
Crude Oil (#WTI): Bearish Outlook Explained

WTI Crude Oil reached a key daily structure resistance.
The price formed a tiny little double top on that on 1H time frame.
Its neckline has been just broken.

The market will most likely keep retracing.
Goals: 79.9 / 79.6
Best Scalping Indicators
 

Attachments

  • oil.jpg
    oil.jpg
    64.2 KB · Views: 2
Dow Jones Index (#US30): Key Levels to Watch This Week

Here is my latest structure analysis for US30 Index.

Support 1: 32470 - 32650 area
Support 2: 31700 - 31975 area

Resistance 1: 33475 - 33660 area
Resistance 2: 34300 - 34500 area
Resistance 3: 34820 - 34900 area

Vertical Resistance 1: major rising trend line .

Currently, the market is approaching a confluence zone based on Vertical & Horizontal Resistance 1.
Probabilities will be high to see a pullback from there.

Consider the underlined structures for pullback/breakout trading.
 

Attachments

  • us30.jpg
    us30.jpg
    115.5 KB · Views: 2
#AUDCAD: Time to Grow

AUDCAD dropped to a key daily structure support.
The price formed a double bottom pattern, testing that on 1H,
its neckline was broken then.

I expect a bullish move to 0.91 / 0.9117
 

Attachments

  • audcad.jpg
    audcad.jpg
    102 KB · Views: 2
Silver (#XAGUSD): Ahead of Powell's Speech
Silver looks very oversold.
The price reached a solid horizontal key level and formed an inverted head and shoulders pattern on 1H time frame.
We might see a pullback.
Goals: 20.37 / 20.55
 

Attachments

  • silver.jpg
    silver.jpg
    105.6 KB · Views: 2

Create an account or login to comment

You must be a member in order to leave a comment

Create account

Create an account on our community. It's easy!

Log in

Already have an account? Log in here.

Similar threads

Users Who Are Viewing This Thread (Total: 1, Members: 0, Guests: 1)

Top
AdBlock Detected

We get it, advertisements are annoying!

Sure, ad-blocking software does a great job at blocking ads, but it also blocks useful features of our website. For the best site experience please disable your AdBlocker.

I've Disabled AdBlock    No Thanks