What's new

My personal FX pairs and XAUUSD analysis

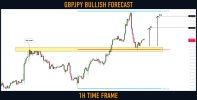
#GBPJPY: Classic Trend Following

GBPJPY remains very bullish from the beginning of the year.
After the last impulsive movement, the market retraced to a peculiar confluence zone.
I see a perfect match between 0.5 retracement of the last bullish leg and a horizontal structure support.

I will expect a pullback from that to 165.0 / 165.7
 

Attachments

  • gbpjpy.jpg
    gbpjpy.jpg
    93 KB · Views: 2
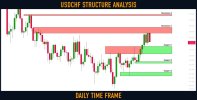
#USDCHF: Detailed Structure Analysis

Here is my latest structure analysis for ⚠️USDCHF.

Support 1: 0.928 - 0.933 area
Support 2: 0.922 - 0.923 area
Support 3: 0.9137 - 0.916 area

Resistance 1: 0.942 - 0.946 area
Resistance 2: 0.954 - 0.955 area

Consider these structure for pullback/breakout trading.
 

Attachments

  • usdchf.jpg
    usdchf.jpg
    111.5 KB · Views: 2
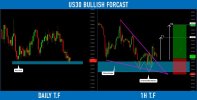
Dow Jones Index (#US30): Oversold Market & Pullback

Dow Jones Index reached a key level.
Testing that, the price formed an inverted head & shoulders pattern on an hourly time frame
and broke a resistance line of a falling wedge pattern then.

I expect a pullback now.
Goals: 32950 / 33110
 

Attachments

  • us30.jpg
    us30.jpg
    113.8 KB · Views: 2
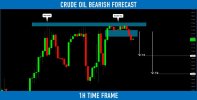
Crude Oil (#WTI): Bearish Outlook Explained

Crude Oil is coiling on a key horizontal resistance.
The price formed a double top pattern, testing that
and broke its neckline then.

We may see a retracement from the underlined blue zone.
Goals: 76.9 / 76.36
 

Attachments

  • oil.jpg
    oil.jpg
    92.7 KB · Views: 2
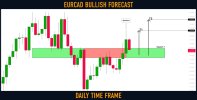
#EURCAD: Important Breakout

EURCAD broke and closed above a major horizontal supply cluster with a high momentum bullish candle yesterday.
1.441 - 1.446 is now turned into a demand zone.

I will expect a bullish wave from that area to 1.455 / 1.46 levels.
 

Attachments

  • eurcad.jpg
    eurcad.jpg
    59.8 KB · Views: 2
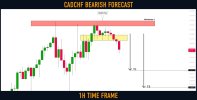
#CADCHF: Bearish Move From Key Level

It looks like CADCHF may drop.
The price reached a solid horizontal resistance and formed a tiny double top pattern on an hourly time frame. Now we see a strong bearish pressure.

I expect a bearish continuation to 0.6913 / 0.6905
 

Attachments

  • cadchf.jpg
    cadchf.jpg
    85.4 KB · Views: 2
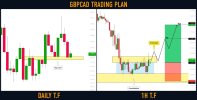
#GBPCAD: Your Trading Plan For Today

⚠️GBPCAD is coiling on a key level.
I see a horizontal trading range on 1H time frame.

1.6263 - 1.6274 is its neckline.
Wait for its bullish breakout (hourly candle close above).
It will be your confirmation to buy.

Open long aggressively or on a retest then.
Goals will be 1.6307 / 1.633

If the price sets a new lower low, the setup will become invalid.
 

Attachments

  • gbpcad.jpg
    gbpcad.jpg
    105.2 KB · Views: 2
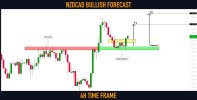
#NZDCAD: Bullish Outlook Explained

NZDCAD is taking off from a key horizontal support.
The price formed a double bottom on that and broke its neckline then.

I expect a bullish continuation to 0.851 / 0.854
 

Attachments

  • nzdcad.jpg
    nzdcad.jpg
    89.6 KB · Views: 2
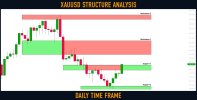
Gold (#XAUUSD): Key Levels to Watch This Week

Here is my latest structure analysis for ⚠️Gold.

Support 1: 1843 - 1853 area
Support 2: 1804 - 1811 area

Resistance 1: 1875 - 1904 area
Resistance 2: 1950 - 1959 area

Consider these structures for pullback/breakout trading next week.
 

Attachments

  • gold.jpg
    gold.jpg
    60.4 KB · Views: 2
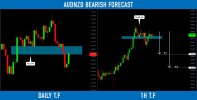
#AUDNZD: Bearish Outlook Explained

AUDNZD is testing a wide daily horizontal supply area.
The price formed a double top pattern, approaching that on an hourly time frame
and broke its neckline with a high momentum bearish candle.

I expect a retracement to 1.0848 / 1.0828
 

Attachments

  • audnzd.jpg
    audnzd.jpg
    102.5 KB · Views: 2
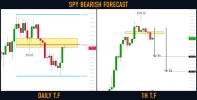
S&P500 Index (#SPY): Time to Sell

S&P500 Index is testing a wide daily horizontal resistance cluster.
Probabilities will be high to see a bearish reaction from that.

I believe that the market may drop today to 4032 / 4021 levels.
 

Attachments

  • spy.jpg
    spy.jpg
    98.3 KB · Views: 2
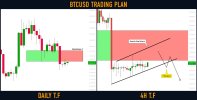
BITCOIN (#BTCUSD): Detailed Technical Outlook ₿

⚠️Bitcoin successfully violated a wide horizontal daily demand area.
The broken structure turned into a supply zone.

The market is correcting now.
I spotted a bearish flag pattern on 4H time frame.
Its bearish breakout may initiate the next sell off.
Watch carefully the reaction of the price to its rising support.
Consider shorting after a 4H candle close below with initial target being 22100.
 

Attachments

  • bitcoin.jpg
    bitcoin.jpg
    66.3 KB · Views: 2
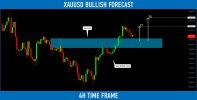
Gold (#XAUUSD): Time For Pullback

Gold is approaching a wide horizontal demand cluster on 4H.
Taking into consideration, that the market is trading in a minor bullish trend,
probabilities will be high to see a pullback from the underlined area.

I expect growth to 1855 / 1862
 

Attachments

  • gold.jpg
    gold.jpg
    92 KB · Views: 2
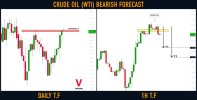
Crude Oil (#WTI): Bearish Outlook Explained

WTI Crude Oil reached a key daily structure resistance.
The price formed a tiny little double top on that on 1H time frame.
Its neckline has been just broken.

The market will most likely keep retracing.
Goals: 79.9 / 79.6
Best Scalping Indicators
 

Attachments

  • oil.jpg
    oil.jpg
    64.2 KB · Views: 2
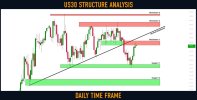
Dow Jones Index (#US30): Key Levels to Watch This Week

Here is my latest structure analysis for US30 Index.

Support 1: 32470 - 32650 area
Support 2: 31700 - 31975 area

Resistance 1: 33475 - 33660 area
Resistance 2: 34300 - 34500 area
Resistance 3: 34820 - 34900 area

Vertical Resistance 1: major rising trend line .

Currently, the market is approaching a confluence zone based on Vertical & Horizontal Resistance 1.
Probabilities will be high to see a pullback from there.

Consider the underlined structures for pullback/breakout trading.
 

Attachments

  • us30.jpg
    us30.jpg
    115.5 KB · Views: 2
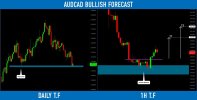
#AUDCAD: Time to Grow

AUDCAD dropped to a key daily structure support.
The price formed a double bottom pattern, testing that on 1H,
its neckline was broken then.

I expect a bullish move to 0.91 / 0.9117
 

Attachments

  • audcad.jpg
    audcad.jpg
    102 KB · Views: 2
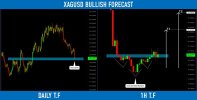
Silver (#XAGUSD): Ahead of Powell's Speech
Silver looks very oversold.
The price reached a solid horizontal key level and formed an inverted head and shoulders pattern on 1H time frame.
We might see a pullback.
Goals: 20.37 / 20.55
 

Attachments

  • silver.jpg
    silver.jpg
    105.6 KB · Views: 2

Create an account or login to comment

You must be a member in order to leave a comment

Create account

Create an account on our community. It's easy!

Log in

Already have an account? Log in here.

Members Online

No members online now.

Similar threads

Users Who Are Viewing This Thread (Total: 1, Members: 0, Guests: 1)

Top
AdBlock Detected

We get it, advertisements are annoying!

Sure, ad-blocking software does a great job at blocking ads, but it also blocks useful features of our website. For the best site experience please disable your AdBlocker.

I've Disabled AdBlock    No Thanks