What's new

capitalstreetfx06

New Member

Daily Index Analysis – Tech rules Nasdaq, S&P records, FTSE challenges, DAX shines.​

Introduction:

In the global indices market, Asian markets show gains, tracking a Wall Street rally. European stocks rise, led by chipmakers, and positive earnings contribute to the upbeat sentiment. Meanwhile, Wall Street ends positively, supported by strong economic data, but rising Treasury yields may affect expectations of a gradual economic slowdown. Market movements hinge on data and central bank decisions, shaping the landscape for investors worldwide.

Market In Focus For Today – Nasdaq 100

The Nasdaq 100 achieves a new record high in a rebound fuelled by the technology sector.

TECHNICAL OVERVIEW:


Moving Averages:

Exponential:

  • MA 5: 17096.98 | Positive Crossover | Bullish
  • MA 20: 16961.84 | Positive Crossover | Bullish
  • MA 50: 16840.81 | Positive Crossover | Bullish

Simple:

  • MA 5: 17066.07 | Positive Crossover | Bullish
  • MA 20: 16961.22| Positive Crossover | Bullish
  • MA 50: 16840.34 | Positive Crossover | Bullish
RSI (Relative Strength Index): 69.35| Buy Zone| Bullish

Stochastic Oscillator: 100| Buy Zone | Positive

Resistance And Support Levels:

  • R1: 17224.28 | R2:17587.17
  • S1: 16989.46| S2: 16434.45

Overall Sentiment: Bullish | Market Direction: Buy​

Trade Suggestion: Limit Buy : 17021.48 | Take Profit: 17395.05| Stop Loss: 16765.33.

S&P 500:

READ THE FULL REPORT - CAPITAL STREET FX​


Daily Index Analysis – DOW soars, S&P 500 breaks records, FTSE defies storm.​

Introduction:

After Wall Street’s record-setting rally, Asian markets displayed varied performances on Monday. The Shanghai composite declined by 2.68%, while Japan’s Nikkei 225 rose by 1.62%. In Europe, shares mirrored the positive trend, with DAX futures up 0.48%, CAC 40 futures rising 0.49%, and UK 100 futures gaining 0.15%. The S&P 500 in the U.S. reached a two-year closing high on Friday, propelled by optimism in artificial intelligence and a surge in chipmakers and major tech stocks. Attention now shifts to the European Central Bank (ECB).

Market In Focus For Today – DOW JONES

Bullish signals are evident in the Dow Jones Industrial Average (DOW) as it experiences a current surge, surpassing the $37,791.43 level. This breakout suggests a departure from a triple top pattern.

TECHNICAL OVERVIEW:


Moving Averages:

Exponential:

  • MA 5: 37991.98 | Positive Crossover | Bullish
  • MA 20: 37702.84 | Positive Crossover | Bullish
  • MA 50: 37771.71 | Positive Crossover | Bullish

Simple:

  • MA 5: 38023.05 | Positive Crossover | Bullish
  • MA 20: 37702.22| Positive Crossover | Bullish
  • MA 50: 37771.34 | Positive Crossover | Bullish
RSI (Relative Strength Index): 64.98| Buy Zone| Bullish

Stochastic Oscillator: 100| Buy Zone | Positive

Resistance And Support Levels:

  • R1: 38154.50 | R2: 38784.03
  • S1: 37362.51| S2: 36672.06

Overall Sentiment: Bullish | Market Direction: Buy​

Trade Suggestion: Limit Buy : 37585.89 | Take Profit: 38296.65| Stop Loss: 37139.13.

S&P 500:

READ THE FULL REPORT - CAPITAL STREET FX​

 
# Daily Index Analysis – Netflix, S&P 500 Records, DAX Surge.
## **Introduction:**

In the Asian indices market, most shares see gains, particularly in China following recent policy moves. However, European shares decline at the open, awaiting updates from the ECB on rates. Meanwhile, U.S. equities advance, propelled by positive earnings and economic data, leading to a rise in yields. Global markets reflect optimism, with MSCI’s global equity index hitting a near two-year high, fuelled by encouraging developments in Europe, the U.S., and expectations of Chinese stimulus support.

## **Market In Focus For Today – DOW JONES**

The Dow Jones Industrial Average briefly rallied 150 points Wednesday, as Wall Street reacted to Netflix’s (NFLX) earnings report.

## **TECHNICAL OVERVIEW:**

![|1024x345](https://www.capitalstreetfx.com/en/wp-content/uploads/2024/01/24-01-25_03-27-51_Dow-Jones-Index-1024x345.png)

### **Moving Average** **s:**

### **Exponential:**

* **MA 5:** 38089.54 | Negative Crossover | Bearish
* **MA 20** **:** 37908.35 | Positive Crossover | Bullish
* **MA 50:** 37809.36 | Positive Crossover | Bullish


* **MA 5:** 38103.05 | Negative Crossover | Bearish
* **MA 20** **:** 37908.37| Positive Crossover | Bullish
* **MA 50:** 37809.31 | Positive Crossover | Bullish

**RSI (Relative Strength Index)** **:** 57.43**|** Buy Zone| Bullish

**Stochastic Oscillator:** 13.31| Sell Zone **|** Negative

### **Resistance And Support Levels:**

* **R1:** 38299.50 **| R2:** 38795.01
* **S1:** 37969.16| **S2:** 37308.48

### **Overall Sentiment:** Bullish **| Market Direction:** Buy

**Trade Suggestion:** Limit Buy: 37728.91 | Take Profit: 38299.50| Stop Loss: 37308.48.
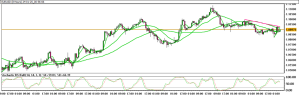
## **S&P 500:**

The S&P 500 achieves its third consecutive record-high closing.

## **TECHNICAL OVERVIEW:**

![|1024x343](https://www.capitalstreetfx.com/en/wp-content/uploads/2024/01/24-01-25_04-00-30_SP-500-Index-1024x343.png)

### **Moving Average** **s:**

### **Exponential:**

* **MA 5:** 4901.15 | Negative Crossover | Bearish
* **MA 20** **:** 4856.22 | Positive Crossover | Bullish
* **MA 50:** 4811.77 | Positive Crossover | Bullish

### **Simple:**

* **MA 5:** 4905.67 | Negative Crossover | Bearish
* **MA 20** **:** 4856.19| Positive Crossover | Bullish
* **MA 50:** 4811.76| Positive Crossover | Bullish

**RSI (Relative Strength Index)** **:** 68.09**|** Bullish Zone| Positive

Stochastic Oscillator**:** 47.09|Buy Zone **|** Negative

### **Resistance And Support Levels:**

* **R1:** 4932.77 **| R2:** 5013.85
* **S1:** 4843.31| **S2:** 4711.91

### **Overall Sentiment:** Bullish **| Market Direction:** Buy

**Trade Suggestion:** Limit Buy: 4823.74 | Take Profit: 4932.77| Stop Loss: 4756.64.

## **DAX 40:**
### READ THE FULL REPORT - CAPITAL STREET FX
 

Attachments

  • 27ea785ad1d323554cccffbedb657a1afa09c029.png
    27ea785ad1d323554cccffbedb657a1afa09c029.png
    75.6 KB · Views: 0

Weekly Index Analysis – Nasdaq’s ride, S&P records, trade insights.​

Introduction:

Asian stocks are poised for a weekly gain, with attention focused on the upcoming US inflation test. The Shanghai composite has risen by 0.14%. Across the region, the Singapore MSCI is up 0.76% at 279.55. European equities have reached a two-year peak, driven by positive economic indicators and strong earnings reports. On Wall Street, there is an uptrend fueled by robust GDP data. The strong start to the year for the US stock market faces a significant challenge next week, with a busy schedule featuring major tech earnings, the Federal Reserve’s monetary policy meeting, and the eagerly awaited employment report.

Market In Focus For The Next Week – Nasdaq 100

Nasdaq 100 futures experienced a decline on Friday morning following Intel’s issuance of an outlook that failed to meet Wall Street’s expectations.

TECHNICAL OVERVIEW:


Moving Average s:

Exponential:

  • MA 5: 17560.54 | Negative Crossover | Bearish
  • MA 20 : 17462.35 | Positive Crossover | Bullish
  • MA 50: 17066.36 | Positive Crossover | Bullish

Simple:

  • MA 5: 17587.05 | Negative Crossover | Bearish
  • MA 20 : 17462.37| Positive Crossover | Bullish
  • MA 50: 17066.31 | Positive Crossover | Bullish
RSI (Relative Strength Index) : 60.58**|** Buy Zone| Bullish

Stochastic Oscillator: 2.14| Sell Zone **|**Negative

Resistance And Support Levels:

  • R1: 17791.70 | R2: 18176.39
  • S1: 17443.08| S2: 17058.39

Overall Sentiment: Bullish | Market Direction: Buy​

Trade Suggestion: Limit Buy: 17226.69 | Take Profit: 17719.57| Stop Loss: 16902.11.

S&P 500:

READ THE FULL REPORT - CAPITAL STREET FX​


Daily Index Analysis – Global markets tumble, U.S. inflation soars.​

Introduction:

“In the global indices market, the aftermath of soaring U.S. inflation data is felt across most Asian markets, with declines witnessed in key indices. Meanwhile, the Shanghai composite bucks the trend with a 1.28% gain. In Europe, stock markets witness an upswing as the UK’s inflation rate retreats. Conversely, U.S. stocks face a decline on Tuesday as worse-than-expected inflation data dispels hopes for a May interest rate cut, shaping a complex landscape in international financial markets.”

Market In Focus For Today – Dow Jones

Dow plunges 500 points, marking its most significant decline since March 2023, following a robust inflation report.

TECHNICAL OVERVIEW:


Moving Average s:

Exponential:

  • MA 5: 38555.70 | Negative Crossover | Bearish
  • MA 20 : 38650.67 | Negative Crossover | Bearish
  • MA 50: 38480.25 | Negative Crossover | Bearish

Simple:

  • MA 5: 38268.85 | Negative Crossover | Bearish
  • MA 20 : 38650.67| Negative Crossover | Bearish
  • MA 50: 38480.55 | Negative Crossover | Bearish
RSI (Relative Strength Index) : 42.8**|** Neutral Zone| Neutral

Stochastic Oscillator: 5.23| Sell Zone | Negative

Resistance And Support Levels:

  • R1: 38859.88 | R2: 39412.06
  • S1: 38231.22| S2: 37387.75

Overall Sentiment: Bearish | Market Direction: Sell​

Trade Suggestion: Limit Sell: 38445.91 | Take Profit: 37817.15| Stop Loss: 38859.98.

S&P 500:

U.S. stocks decline as inflation data dashes hopes for a rate cut. The S&P 500 registers a drop of 66.94 points, or 1.33%.

TECHNICAL OVERVIEW:


Moving Average s:

Exponential:

  • MA 5: 5000.22 | Negative Crossover | Bearish
  • MA 20 : 5007.20 | Negative Crossover | Bearish
  • MA 50: 4959.99 | Positive Crossover | Bullish

Simple:

  • MA 5: 5014.37 | Negative Crossover | Bearish
  • MA 20 : 5007.20| Negative Crossover | Bearish
  • MA 50: 4959.99| Positive Crossover | Bullish
RSI (Relative Strength Index) : 49.04**|** Bullish Zone| Positive

Stochastic Oscillator**:** 6.39| Sell Zone | Negative

Resistance And Support Levels:

  • R1: 5064.20 | R2: 5160.51
  • S1: 4955.18| S2: 4862.51

Overall Sentiment: Bullish | Market Direction: Buy​

Trade Suggestion: Limit Buy: 4995.15 | Take Profit: 5064.20| Stop Loss: 4955.18.

FTSE 100:

READ THE FULL REPORT - CAPITAL STREET FX​


Daily Index Analysis – Global indices surge, tech leads rebound.​

Introduction:

In the global indices landscape, Asian stocks show gains as the US dollar softens amidst considerations of the US interest rate outlook. Notably, the Shanghai Composite, Singapore MSCI, and Nikkei 225 all register positive moves. Meanwhile, European equities rise, despite the UK entering a technical recession. In the US, Wall Street ends on a positive note, primarily boosted by impressive performances from Uber, Lyft, and Nvidia, with the latter surpassing Alphabet in market value.

Market In Focus For Today – Nasdaq 100

The NASDAQ 100 shows signs of recovery in the early hours, as efforts are made to bounce back from the CPI shock experienced in the Tuesday session.

TECHNICAL OVERVIEW:


Moving Average s:

Exponential:

  • MA 5: 17844.62 | Positive Crossover | Bullish
  • MA 20 : 17868.24 | Positive Crossover | Bullish
  • MA 50: 17694.58 | Positive Crossover | Bullish

Simple:

  • MA 5: 17836.52 | Positive Crossover | Bullish
  • MA 20 : 17868.37| Positive Crossover | Bullish
  • MA 50: 17694.55 | Positive Crossover | Bullish
RSI (Relative Strength Index) : 57.22**|** Buy Zone| Buy

Stochastic Oscillator: 46.05| Buy Zone | Positive

Resistance And Support Levels:

  • R1: 18038.95 | R2: 18408.77
  • S1: 17659.89| S2: 17243.85

Overall Sentiment: Bullish | Market Direction: Buy​

Trade Suggestion: Limit Buy: 17706.12 | Take Profit: 18112.92| Stop Loss: 17447.25.

S&P 500:

READ THE FULL REPORT - CAPITAL STREET FX​


Daily Index Analysis – S&P 500 breaks records, cautious markets.​

Introduction:

In the global indices market, Asian stocks show little movement amid reduced trading activity due to holidays. Shanghai composite gains 1.28%, Singapore MSCI rises 0.84%, while Hong Kong’s Hang Seng Index dips 0.83%. European stocks edge higher cautiously, with Germany’s DAX and France’s CAC 40 futures up. Meanwhile, U.S. stock futures remain stable after a record-setting week for the S&P 500.

Market In Focus For Today – Dow Jones

Early on Monday, U.S. stock futures remained close to the neutral zone. Dow Jones Industrial Average futures experienced a slight decline of 30 points or 0.1%

TECHNICAL OVERVIEW:


Moving Average s:

Exponential:

  • MA 5: 38730.75 | Negative Crossover | Bearish
  • MA 20 : 38674.15 | Positive Crossover | Bullish
  • MA 50: 38744.51 | Negative Crossover | Bearish

Simple:

  • MA 5: 38763.03 | Positive Crossover | Bullish
  • MA 20 : 38674.62| Positive Crossover | Bullish
  • MA 50: 38745.00 | Positive Crossover | Bullish
RSI (Relative Strength Index) : 56.05**|** Buy Zone| Bullish

Stochastic Oscillator: 32.81| Sell Zone | Negative

Resistance And Support Levels:

  • R1: 38881.95 | R2: 39302.16
  • S1: 38409.22| S2: 37915.47

Overall Sentiment: Bullish | Market Direction: Buy​

Trade Suggestion: Limit Buy: 38461.74 | Take Profit: 38881.95| Stop Loss: 38220.12.

S&P 500:

READ THE FULL REPORT - CAPITAL STREET FX​


Create an account or login to comment

You must be a member in order to leave a comment

Create account

Create an account on our community. It's easy!

Log in

Already have an account? Log in here.

Similar threads

Users Who Are Viewing This Thread (Total: 1, Members: 0, Guests: 1)

Top
AdBlock Detected

We get it, advertisements are annoying!

Sure, ad-blocking software does a great job at blocking ads, but it also blocks useful features of our website. For the best site experience please disable your AdBlocker.

I've Disabled AdBlock    No Thanks