What's new

Forex News Daily Analysis By FXGlory

4.50 star(s) 2 Votes
Gold analysis for 08.01.2023


GOLDH4.jpg

Time Zone: GMT +2
Time Frame: 4 Hours (H4)


Fundamental Analysis:


Gold prices are influenced by a variety of global economic factors, including interest rate trends, geopolitical stability, and inflationary pressures. As gold is often seen as a safe-haven asset, its value tends to increase during times of economic uncertainty or when inflation is high, as investors look for stable stores of value. Central bank policies, particularly those of the Federal Reserve, can significantly impact gold prices as they affect the US Dollar's strength. Current geopolitical tensions or economic policies can also sway investor sentiment and demand for gold.
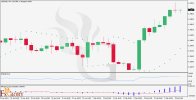

Price Action:

The H4 chart for gold shows a period of consolidation following a downtrend, with the price action now testing the Ichimoku cloud from below. The recent price movement indicates hesitation as the market is deciding whether to continue the downtrend or reverse into a bullish phase. The candles within the Ichimoku cloud suggest uncertainty, as the cloud typically represents a zone of support or resistance.


Key Technical Indicators:

Ichimoku Kinko Hyo:
The price is currently interacting with the Ichimoku cloud, indicating a potential trend change or increased volatility.

RSI (Relative Strength Index): With an RSI reading of around 45, the market is neither overbought nor oversold, reflecting a neutral momentum.

MACD (Moving Average Convergence Divergence): The MACD histogram is below the baseline, indicating bearish momentum, although the bars appear to be shortening, suggesting a possible slowdown in downward momentum.

Parabolic SAR: The dots being below the price candles signal a potential bullish reversal, as the indicator typically suggests a stop and reverse point for the trend.


Support and Resistance:

Resistance:
The immediate resistance level can be marked by the latest local high before the price entered the Ichimoku cloud, approximately at $2070.

Support: The most prominent support level would be the recent low prior to the price's uptick into the Ichimoku cloud, which is around $2020.


Conclusion and Consideration:


The gold market on the H4 timeframe is at a critical juncture, with technical indicators showing mixed signals. The interaction with the Ichimoku cloud and the position of the Parabolic SAR suggest a potential bullish reversal, while the MACD indicates ongoing bearish momentum. Traders should be cautious and consider waiting for a clearer signal outside of the Ichimoku cloud before entering positions. It is advisable to monitor global economic indicators and central bank statements, as they can lead to sudden shifts in gold prices. Risk management strategies, including setting stop losses and profit targets, should be employed to protect against market volatility.


Disclaimer: This analysis is provided for informational purposes only and should not be construed as investment advice. It is important for traders to conduct their own research and analysis before making any investment decisions.


FXGlory
08.01.2023
 
EURAUD analysis for 09.01.2023


EURAUDH4.jpg
Time Zone: GMT +2
Time Frame: 4 Hours (H4)


Fundamental Analysis:


The EUR/AUD pair is significantly influenced by economic indicators, policy decisions, and geopolitical events from both the Eurozone and Australia. Key factors to consider include:

Interest Rate Decisions: The European Central Bank (ECB) and the Reserve Bank of Australia (RBA) interest rate policies greatly affect the pair. A divergence in monetary policy could lead to volatility, with the currency of the region showing a more hawkish stance typically strengthening.

Economic Releases: High-impact data such as GDP growth rates, unemployment figures, and inflation reports from both economies can cause fluctuations in the pair. For instance, stronger than expected economic performance in the Eurozone relative to Australia could lead to an appreciation of the EUR against the AUD.

Commodity Prices: As Australia is a major exporter of commodities, the strength of the AUD is often correlated with commodity prices, particularly iron ore and coal. An increase in commodity prices could strengthen the AUD against the EUR.

Global Risk Sentiment: The EUR/AUD is sensitive to changes in global risk sentiment. During times of economic uncertainty or market stress, the EUR may act as a safe-haven currency compared to the commodity-dependent AUD.

Geopolitical Issues: Both regions are susceptible to geopolitical tensions that can impact their respective currencies. Stability in the Eurozone and any significant events in the Asia-Pacific region could sway the EUR/AUD price.


Price Action:

The current H4 chart shows that the candles are above the Ichimoku clouds, with the recent cloud behind the price being red. Despite the bearish past suggested by the red cloud, the price staying above it may indicate a bullish outlook.
The green MACD bars further support the bullish scenario, although traders should be cautious and look for confirmation as the price action remains close to the Ichimoku cloud, a region that can often signal significant resistance or support.


Key Technical Indicators:

Ichimoku Kinko Hyo:
The last cloud is red, indicating a bearish sentiment in the recent past. However, the current price action is above the cloud, and both the conversion line (Tenkan-sen) and the baseline (Kijun-sen) are above the cloud as well, which could indicate a potential bullish trend or at least a pause in the bearish momentum.

RSI (Relative Strength Index): Sitting at 52.36, the RSI suggests a neutral market without signs of being overbought or oversold.

MACD (Moving Average Convergence Divergence): The MACD line is above the histogram bars which are green, signaling a bullish momentum in the near term. This suggests that the short-term price movement is stronger than the long-term trend, and the market may be in an uptrend.


Support and Resistance:

Resistance:
On the resistance front, 1.63430 stands out as the key barrier for any upward movements. This level represents a ceiling where sell-offs have occurred, suggesting a concentration of selling interest. Should the price approach this level, traders might expect some resistance, and it could serve as a strategic point for setting profit targets on existing long positions or for initiating short positions.

Support: The primary support level to watch on the H4 chart for EUR/AUD is currently at 1.61830. This level has previously acted as a floor for the price, where demand increased and the currency pair found buyers stepping in to drive the price upward. A test of this support level could again prompt a bullish reaction, making it a significant marker for traders considering long positions or looking for stop-loss placements.


Conclusion and Consideration:

Investors and traders considering the EUR/AUD pair should closely monitor the economic calendar for upcoming announcements and reports from both regions. Additionally, staying informed on global economic conditions and risk sentiment is vital for those trading this cross-pair.


Disclaimer: This analysis is provided for informational purposes only and should not be construed as investment advice. It is important for traders to conduct their own research and analysis before making any investment decisions.


FXGlory
09.01.2023
 
EURUSD analysis for 11.01.2024

URUSDH4.jpg

Time Zone: GMT +2
Time Frame: 4 Hours (H4)


Fundamental Analysis:

The EUR/USD pair is significantly influenced by economic indicators, policy decisions, and geopolitical events from both the Eurozone and the United States. Key factors to consider include:
Interest Rate Decisions:
The European Central Bank (ECB) and the Federal Reserve (Fed) interest rate policies greatly affect the pair. A divergence in monetary policy could lead to volatility, with the currency of the region showing a more hawkish stance typically strengthening.
Economic Releases:
High-impact data such as GDP growth rates, unemployment figures, and inflation reports from both economies can cause fluctuations in the pair. For instance, stronger than expected economic performance in the Eurozone relative to the United States could lead to an appreciation of the EUR against the USD.
Dollar Index (DXY):
As a measure of the value of the United States dollar relative to a basket of foreign currencies, the DXY can impact the EUR/USD pair. A stronger DXY often correlates with a weaker EUR/USD and vice versa. Global Risk Sentiment: The EUR/USD is sensitive to changes in global risk sentiment. During times of economic uncertainty or market stress, the USD may act as a safe-haven currency compared to the EUR.
Geopolitical Issues:
Both regions are susceptible to geopolitical tensions that can impact their respective currencies. Stability in the Eurozone and any significant events affecting the United States could sway the EUR/USD price.


Price Action:

The current H4 chart shows that the candles are below the Ichimoku cloud, suggesting a bearish sentiment. However, the presence of Parabolic SAR dots below the candles indicates a potential bullish pressure or a reversal in the downtrend.
The RSI is just below the mid-point, indicating a neutral to slightly bearish market without signs of being overbought or oversold. Traders should seek additional confirmation as the price action remains close to the Ichimoku cloud's lower boundary, which can often signal significant resistance or support.


Key Technical Indicators:

Ichimoku Kinko Hyo: The price being below the cloud indicates a bearish trend, but the bullish signal from the Parabolic SAR suggests caution for bears. The conversion line (Tenkan-sen) and the baseline (Kijun-sen) are also below the cloud, which typically indicates bearish momentum.

RSI (Relative Strength Index): At approximately 49.11, the RSI is neutral, suggesting a balance between buying and selling pressures.

Parabolic SAR: The placement of the dots below the candles indicates a potential uptrend or a halt in the downtrend, signaling that buyers may be gaining strength.


Support and Resistance:
Resistance:
A key resistance level is at the price point where the Parabolic SAR dots align with the price action, which could be around 1.11230. This level represents a potential turnaround where sell-offs have occurred previously, suggesting a concentration of selling interest.

Support: The primary support level on the H4 chart for EUR/USD is at the lower boundary of the recent price consolidation area, which appears to be around 1.08980. This level has previously acted as a floor for the price, where demand increased and the currency pair found buyers stepping in.


Conclusion and Consideration:

Investors and traders considering the EUR/USD pair should closely monitor the economic calendar for upcoming announcements and reports from both the Eurozone and the United States. Additionally, staying informed on global economic conditions and risk sentiment is vital for those trading this major currency pair.


Disclaimer:
This analysis is provided for informational purposes only and should not be construed as investment advice. It is important for traders to conduct their own research and analysis before making any investment decisions.


FXGlory
11.01.2024

 
SILVER analysis for 15.01.2023


SILVERH4.jpg

Time Zone: GMT +2
Time Frame: 4 Hours (H4)


Fundamental Analysis:

Silver, represented as XAGUSD in forex markets, is influenced by a multitude of factors, including industrial demand, investment demand, and macroeconomic trends. Fundamentally, silver's dual status as both an industrial metal and a precious metal means its price is affected by both industrial production levels and investor sentiment. Economic data releases, such as manufacturing indices and inflation rates, alongside geopolitical events, can sway silver prices significantly. Additionally, as silver is priced in U.S. dollars, fluctuations in the strength of the dollar have a reciprocal effect on silver's value.


Price Action:
The H4 timeframe for XAGUSD shows that the price has recently rebounded after a downtrend, suggesting a potential shift in momentum. The recent candles have closed higher than previous ones, indicating a short-term bullish sentiment among traders. This recovery in price may attract more buyers if it sustains, leading to a further increase in silver prices.


Technical Indicators:
RSI (Relative Strength Index):
The RSI is hovering around 55, suggesting that the market is neither overbought nor oversold, and there is room for price movement in either direction without immediate pressure from momentum traders.

MACD (Moving Average Convergence Divergence): The MACD line is below the signal line but appears to be converging, indicating that the bearish momentum may be waning. If the MACD crosses above the signal line, it could be a bullish signal.

Ichimoku Cloud: The price is currently below the Ichimoku cloud, which typically suggests a bearish sentiment. However, the recent price action towards the cloud may indicate a potential trend reversal if the price breaks through the cloud.

Parabolic SAR: The last four dots of the Parabolic SAR are below the candlesticks, signaling a potential bullish trend reversal or strengthening of the current uptrend.


Support and Resistance Levels:
Support:
The recent low around the $22.58 mark could serve as a short-term support level.

Resistance: A previous area of consolidation around the $23.40 level may act as a resistance in the near term.


Conclusion and Consideration:
The technical indicators on the H4 chart for XAGUSD suggest a possible shift in momentum, with several signs pointing towards a budding bullish sentiment. Traders should watch for a potential bullish breakout if the price continues to rise and breaches the Ichimoku cloud. Caution is advised as the market has not yet fully confirmed a trend reversal; thus, keeping an eye on both fundamental factors affecting silver and the key technical levels identified is essential for risk management. Setting stop losses below the support level and considering taking profits near resistance can help mitigate risks associated with potential volatility.


Disclaimer: The above analysis is for educational purposes and should not be taken as investment advice. Traders should conduct their own research and risk assessment before making any trading decisions.


FXGlory
15.01.2024
 
EURCHF analysis for 18.01.2024


EURCHFH4.jpg


Time Zone: GMT +2
Time Frame: 4 Hours (H4)


Fundamental Analysis:

The EURCHF currency pair reflects the exchange rate between the Euro and the Swiss Franc. Fundamental factors that may affect this pair include the monetary policies of the European Central Bank (ECB) and the Swiss National Bank (SNB), differential inflation rates, and the economic health of the Eurozone and Switzerland. Given the Eurozone's expansive market size and the Swiss economy's reliance on banking and financial services, changes in fiscal policies or economic indicators such as GDP growth, unemployment rates, and consumer confidence can significantly impact this pair. Additionally, geopolitical events in Europe, as well as global risk sentiment, can lead to fluctuations in the EURCHF exchange rate.


Price Action:
The price action on the EURCHF H4 chart shows a clear uptrend, with the price moving above the key moving averages, indicating bullish momentum. The pair has been making higher highs and higher lows, which is characteristic of a strong uptrend. The recent candles are green and sizable, which suggests a continuation of buying interest in the market.


Key Technical Indicators:
Ichimoku:
The price is above the Ichimoku cloud, and the cloud is bullish (green), indicating that the overall trend is upwards. The future cloud also appears to be bullish, suggesting that the trend may continue.

Parabolic SAR: The dots of the Parabolic SAR are below the candles, which confirms the bullish trend, indicating that the market sentiment is favoring the upside.

RSI: The RSI is above 70, which often indicates overbought conditions; however, in a strong trend, the RSI can remain overbought for extended periods.

MACD: The MACD line is above the signal line and above zero, which reinforces the bullish momentum. There is no immediate sign of a bearish crossover, which could suggest that the bullish trend may sustain in the near term.


Support and Resistance:
Support: The immediate support is observed at the recent swing low around the 0.93200 level.
Resistance: The next resistance level is likely near the recent highs around the 0.94350 level.


Conclusion and Consideration:
The EURCHF pair on the H4 chart exhibits a strong uptrend, confirmed by price action and the key technical indicators. The Ichimoku cloud and Parabolic SAR support the bullish sentiment, while the overbought RSI suggests a cautious approach as the market may be due for a correction or consolidation in the near future. Traders should watch for potential retracements to the support level as entry points and consider resistance levels for taking profits. It's also important to stay updated with the fundamental developments from the Eurozone and Switzerland, as they can abruptly affect the pair's direction. As with any trading strategy, risk management is crucial, including the use of stop losses to protect against unexpected market movements.


Disclaimer: This analysis is for educational purposes only and does not constitute investment advice. Trading involves risks, and it's essential to conduct your own research or consult with a financial advisor before making any trading decisions.


FXGlory
18.01.2024


BTCUSD analysis for 19.01.2024


BTCUSDH4.jpg

Time Zone: GMT +2
Time Frame: 4 Hours (H4)


Fundamental Analysis:

The BTCUSD pair represents the exchange rate between Bitcoin (BTC) and the US Dollar (USD). Fundamental factors influencing this pair include regulatory announcements affecting the cryptocurrency market, technological advancements within the Bitcoin network, and macroeconomic indicators that impact the USD. For instance, Bitcoin's perceived role as a digital store of value can be affected by inflation rates and monetary policies set by the Federal Reserve. Investor sentiment can also shift due to geopolitical events or news regarding Bitcoin's adoption by institutions and retail investors. Understanding the interplay of these elements is crucial for grasping the underlying movements in BTCUSD.


Price Action:
The H4 chart for BTCUSD shows a bearish trend, with the price action demonstrating a series of lower highs and lower lows. The recent candles have closed below a significant moving average, indicating continued selling pressure. The price has moved swiftly downwards, suggesting a strong bearish sentiment in the market during this period.


Key Technical Indicators:

Parabolic SAR:
The dots of the Parabolic SAR are positioned above the price bars, indicating that the trend is bearish and suggesting that the downward momentum could continue.

Moving Averages: The short-term MA (9 periods) has crossed below the long-term MA (17 periods), which is a bearish signal often interpreted as a confirmation of the downtrend.

MACD (Moving Average Convergence Divergence): The MACD histogram is below the signal line and has extended further into negative territory, reinforcing the bearish momentum.

RSI (Relative Strength Index): The RSI is below the 40 level, which typically indicates bearish momentum and may point to an oversold condition.


Support and Resistance:
Resistance:
The previous high around $44,800 acts as the closest resistance level where price action has faced selling pressure.

Support: The immediate support level appears to be around $40,900, aligning with the latest significant low on the chart where buyers may potentially step in.


Conclusion and Consideration:
The H4 timeframe for BTCUSD indicates a bearish outlook, confirmed by both the price action and key technical indicators. The market is showing strong bearish momentum as evidenced by the positioning of the Parabolic SAR, the bearish crossover of the moving averages, the negative MACD, and the low RSI. Traders should approach with caution, as the oversold RSI may suggest a potential for a rebound or pullback. It is advisable to monitor key support levels for bounce-back opportunities and resistance levels for potential sell entries. As always, keeping abreast of fundamental news is crucial as it can significantly impact market sentiment and price action.


Disclaimer: This analysis is intended for educational purposes only and should not be taken as investment advice. Trading cryptocurrencies involves significant risk and can result in the loss of your invested capital. Always conduct your own research and consult with a financial advisor.


FXGlory
19.01.2024
 
EURAUD analysis for 25.01.2024


FXEURAUDH425January.jpg


Time Zone: GMT +2
Time Frame: 4 Hours (H4)


Fundamental Analysis:

In the forex market, the EUR/AUD pair is impacted by economic indicators, monetary policies, and geopolitical events from both the Eurozone and Australia. Important economic data such as GDP growth, employment figures, and inflation rates are crucial as they influence the strength of each currency. Moreover, policy decisions from the European Central Bank and the Reserve Bank of Australia regarding interest rates can lead to fluctuations. Additionally, the economic health of the Eurozone and Australia's significant export markets, and the commodity prices can affect the EUR/AUD exchange rate.


Price Action:
The EUR/AUD 4H chart shows signs of a consolidating market with a slight bearish bias. The price action features a mix of bullish and bearish candlesticks with no clear direction, indicating a tug-of-war between buyers and sellers.


Key Technical Indicators:
Bollinger Bands:
The price is hovering around the middle band, with the recent trend showing it testing the lower band, hinting at potential bearish pressure. The bands are moderately spaced, suggesting a steady level of market volatility.

Parabolic SAR: The dots of the Parabolic SAR are above the candlesticks, which typically signals a bearish trend. However, as the price is consolidating, this may suggest a lack of strong bearish momentum.

Bears Power: The Bears Power indicator is oscillating below zero, which supports the bearish sentiment. The indicator has not shown any significant upward divergence, maintaining the bearish outlook.


Support and Resistance:
Support:
The immediate support level is around the recent lows at approximately 1.6470, where the price has bounced slightly in the past.

Resistance: The nearest resistance level is around the 1.6530 mark, which aligns with the upper Bollinger band and recent price peaks.


Conclusion and Consideration:
The technical analysis of the EUR/AUD 4H chart points to a bearish inclination in a consolidating market, with the Bollinger Bands, Parabolic SAR, and Bears Power indicating a potential for downward movement. Traders should watch for breaks below the current support for confirmation of a stronger bearish trend. Upcoming economic releases and central bank announcements from the Eurozone and Australia should be monitored, as they may significantly impact the pair. Employing sound risk management strategies is recommended, with particular attention to the established support and resistance levels.


Disclaimer: This analysis is for informational purposes only and should not be construed as investment advice. Always conduct your due diligence before trading.


FXGlory
25.01.2024
 
AUDCAD analysis for 26.01.2024


AUDCADH4.jpg

Time Zone: GMT +2
Time Frame: 4 Hours (H4)


Fundamental Analysis:

The AUDCAD pair reflects the exchange rate between the Australian Dollar (AUD) and the Canadian Dollar (CAD). Fundamental factors that could influence this currency pair include commodity price fluctuations, as both economies are significant exporters of natural resources. Changes in the global demand for commodities such as iron ore and crude oil, policy decisions by the Reserve Bank of Australia and the Bank of Canada, and variations in the countries' trade balances are pivotal. Additionally, the economic health of China, a major trading partner for Australia, can significantly affect the AUD, while CAD is influenced by the US economy and oil prices.


Price Action:
The H4 chart of AUDCAD shows a period of consolidation following a downtrend, with the price recently making a push towards the upper Bollinger band. The price action is characterized by smaller candlesticks, indicating a period of indecision or a balance between buyers and sellers. The recent price movement towards the higher end of the range may suggest a temporary bullish sentiment.


Key Technical Indicators:
RSI (Relative Strength Index):
The RSI is hovering just below the 50 level, indicating a neutral momentum that neither favors the bulls nor the bears.

MACD (Moving Average Convergence Divergence): The MACD line is slightly above the signal line, suggesting a weak bullish momentum.

Bollinger Bands: The price is approaching the upper Bollinger band, which may act as a resistance level.

Parabolic SAR: The last spots of the Parabolic SAR are above the candlesticks, indicating a potential downtrend.


Support and Resistance:
Support:
The recent low at approximately 0.88700 serves as the nearest support level.

Resistance: The upper Bollinger band near the 0.89200 price level is acting as the immediate resistance.


Conclusion and Consideration:
The AUDCAD on the H4 timeframe is exhibiting signs of a potential bullish reversal, but the indicators suggest a weak momentum. While the MACD indicates slight bullishness, the RSI shows a neutral market, and the Parabolic SAR suggests a downtrend. Traders should be cautious and look for a stronger confirmation of trend direction. Monitoring upcoming economic reports from both Australia and Canada, as well as commodity price changes, could provide further insights. It’s advisable to use tight stop losses and take profit orders due to the current market indecision.


Disclaimer: This analysis is for educational purposes only and does not constitute investment advice. Traders should conduct their own research and manage risk according to their trading strategy.


FxGlory
26.01.2024
 
LTCUSD analysis for 29.01.2024


LTCUSDH4.jpg


Time Zone: GMT +2
Time Frame: 4 Hours (H4)


Fundamental Analysis:

The LTCUSD pair represents the value exchange between Litecoin (LTC) and the US Dollar (USD). Fundamental factors that impact this pair include adoption rates, technological advancements within the Litecoin network, regulatory news affecting cryptocurrencies, and macroeconomic trends influencing the USD. Litecoin's developments, such as enhancements to its transaction speed and privacy, alongside the US monetary policy shifts and inflation data, are critical in assessing its market position. The sentiment in global financial markets and the dynamic nature of the crypto ecosystem are also vital considerations for traders following this pair.


Price Action:
The H4 chart for LTCUSD shows a recent recovery after a downtrend, with the price moving upwards. The market has been making higher lows, which indicates a shift in momentum to the upside. The latest candles show increased buying interest, suggesting a potential change in the market trend.


Key Technical Indicators:
Bollinger Bands:
The price has moved from the lower to the upper band, indicating increasing volatility and a possible uptrend as the price approaches the upper band.

MACD (Moving Average Convergence Divergence): The MACD line is below the signal line but appears to be converging, suggesting that downward momentum may be slowing down and a bullish crossover could be imminent.

RSI (Relative Strength Index): The RSI is above 60, indicating strong buying momentum and moving towards overbought territory, which may warn of a potential pullback if it crosses above 70.

Parabolic SAR: The current position of the Parabolic SAR dots below the candlesticks indicates a bullish trend. The indicator provides a confirmation of the trend, suggesting it is a robust signal for a continuing uptrend.


Support and Resistance:
Support:
The nearest significant support level is around the $63.27 mark, where the price has previously shown a bounce back.

Resistance: The current resistance can be identified near the upper Bollinger band, around the $67.31 price level, which the market may test if the uptrend continues.


Conclusion and Consideration:
The LTCUSD pair on the H4 chart exhibits signs of a potential trend reversal from bearish to bullish, as indicated by recent price action and the positioning of the key technical indicators. Traders should monitor the MACD for a bullish crossover and watch the RSI for any signs of overbought conditions that could precede a pullback. It's important to keep abreast of fundamental developments within the Litecoin ecosystem and broader economic indicators that could influence USD strength. Caution should be exercised near support and resistance levels, with appropriate risk management strategies, including stop losses and take profits, to safeguard against market volatility.


Disclaimer: This analysis is provided for informational purposes only and should not be construed as investment advice. Trading cryptocurrencies involves significant risk and can result in the loss of your invested capital. Always conduct your own research and consult with a financial advisor before making investment decisions.


FxGlory
29.01.2024
 
EURUSD analysis for 30.01.2024


EURUSDH4.jpg

Time Zone: GMT +2
Time Frame: 4 Hours (H4)


Fundamental Analysis:

The EURUSD pair, representing the exchange rate between the Euro and the US Dollar, is significantly affected by both European and American economic indicators. For the Euro, key factors include the European Central Bank's monetary policy decisions, economic growth data, and political stability within the European Union. On the US side, Federal Reserve policy, inflation rates, and economic performance indicators like employment data are critical. Current geopolitical tensions and trade relations can also sway the pair, with market sentiment reacting to any significant news related to these areas.


Price Action:
The H4 timeframe for EURUSD shows a bearish trend with the formation of lower highs and lower lows, indicating that the sellers have been in control during this period. The price action has been swinging below a downward sloping trendline, suggesting a continuation of the bearish sentiment. Despite some bullish pullbacks, the general trajectory has been towards the downside.


Key Technical Indicators:
Parabolic SAR:
The dotted indicators of the Parabolic SAR are positioned above the price bars, which traditionally signals a bearish trend and suggests that the downtrend might continue.

MACD (Moving Average Convergence Divergence): The MACD line is below the signal line and has remained in negative territory, further confirming the bearish momentum within this period.

RSI (Relative Strength Index): The RSI is hovering around the 41.33 level, which indicates neither overbought nor oversold conditions, but it leans towards a bearish bias in the market sentiment.


Support and Resistance:
Support
: The nearest significant support level is observed around the 1.0800 area, which if broken, could lead to further bearish momentum.

Resistance: The most immediate resistance level is around the 1.0925 to 1.0950 range, acting as a barrier for any bullish price reversals.


Conclusion and Consideration:
The EURUSD pair on the H4 timeframe is currently showing bearish tendencies, as evidenced by the price action and confirmed by the technical indicators. While the MACD and Parabolic SAR support the continuation of this trend, the RSI suggests a more neutral market sentiment, albeit with a bearish inclination. Traders should watch for potential breaks below support or rejections at resistance for further confirmation of the trend. Caution is advised, as shifts in fundamental factors or a reversal in market sentiment could prompt a change in the current trend. It is prudent to use stop losses to mitigate risk, especially around key support and resistance levels.


Disclaimer: This analysis is for informational purposes only and should not be construed as investment advice. Trading involves risk, and it is crucial for traders to conduct their own research and risk management.


FxGlory
01.30.2024

 
NZDCAD analysis for 01.02.2024


NZDCADH4.jpg


Time Zone: GMT +2
Time Frame: 4 Hours (H4)


Fundamental Analysis:

The NZDCAD pair reflects the exchange rate between the New Zealand Dollar (NZD) and the Canadian Dollar (CAD). Fundamental factors impacting this currency pair include differences in economic indicators from New Zealand and Canada, such as trade balances, GDP growth rates, and commodity prices, especially dairy for NZD and oil for CAD. Central bank decisions and policy statements from the Reserve Bank of New Zealand (RBNZ) and the Bank of Canada (BoC) also significantly influence the pair. Given that both economies are commodity-driven, shifts in global commodity demand and market sentiment can result in heightened volatility for this pair.


Price Action:

The H4 chart shows that NZDCAD has been experiencing a consolidation phase with a slight upward bias. The price has been oscillating between the Bollinger Bands without a clear directional trend. Recent candles indicate a pickup in bullish momentum, but resistance levels loom overhead.


Key Technical Indicators:
Bollinger Bands:
The price is currently near the upper Bollinger Band, indicating potential resistance or a short-term overbought condition.

MACD (Moving Average Convergence Divergence): The MACD histogram is showing slight bullish momentum as the bars increase in height, but the MACD line is close to the signal line, suggesting the momentum could be weak.

RSI (Relative Strength Index): With an RSI around 56, the market is neither in overbought nor oversold territory, indicating room for the price to move in either direction without immediate momentum exhaustion.


Support and Resistance:
Resistance: The immediate resistance can be found at the upper Bollinger Band, around the 0.83250 level.

Support: The midline of the Bollinger Bands acts as a dynamic support, roughly around the 0.82200 level, with more substantial support at the lower Bollinger Band.


Conclusion and Consideration:

The NZDCAD pair on the H4 timeframe shows signs of a tentative bullish recovery within a broader consolidation pattern. Key technical indicators suggest mild bullish momentum, with the RSI and MACD supporting this view. However, the proximity to the upper Bollinger Band may limit the upside potential. Traders should watch for any fundamental changes from economic reports or central bank statements that may affect the currency pair. It's advisable to consider risk management strategies, setting stop-loss orders below key support levels, and taking profit orders at or before resistance levels.


Disclaimer: This analysis is provided for informational purposes only and should not be construed as investment advice. It is important for traders to conduct their own analysis and risk assessment before making any trading decisions.


FxGlory
01.02.2024


EURUSD analysis for 05.02.2024


EURUSDH4.jpg

Time Zone: GMT +2
Time Frame: 4 Hours (H4)


Fundamental Analysis:

The EURUSD pair represents the value of the Euro against the US Dollar. Economic indicators from the Eurozone, such as GDP growth rates, inflation, and ECB policy decisions, are pivotal in influencing the Euro. Concurrently, US economic data, Federal Reserve decisions, and geopolitical events can significantly impact the USD. Recently, factors such as the European energy crisis and the US's economic recovery trajectory post-pandemic have played crucial roles in the pair's movement. Traders should closely monitor these developments as they provide context for the price action observed on the charts.


Price Action:
The price action on the EURUSD H4 chart shows a notable deviation from the Bollinger Bands, indicating a potential overextension in the price movement. The market has recently made a sharp move downward, forming a large bearish candle after a period of consolidation within the upper half of the Bollinger Bands.


Key Technical Indicators:
Bollinger Bands:
The price has broken below the lower Bollinger Band, suggesting a strong bearish move that could potentially lead to a reversal or pause in the trend as the market could be considered oversold.

RSI (Relative Strength Index): The RSI is hovering around 37, indicating bearish momentum but not yet in the oversold region, which could suggest there is room for further downward movement.

MACD (Moving Average Convergence Divergence): The MACD histogram is below the baseline and widening, signaling increasing bearish momentum, while the MACD line is diverging further from the signal line.


Support and Resistance:
Resistance
: Prior price peaks on the chart, especially the recent high where the price touched the upper Bollinger Band, act as resistance levels.

Support: The next significant support level is likely where the price has previously consolidated or shown a bounce, which can be aligned with historical lows or Fibonacci retracement levels.


Conclusion and Consideration:
The EURUSD pair on the H4 timeframe has shown a sharp bearish movement, breaking through the lower Bollinger Band. The RSI and MACD indicators support the bearish momentum. Traders should be cautious of potential retracements due to the pair being in a typically oversold condition as per the Bollinger Bands. Upcoming economic reports and policy decisions from the US and Europe will be critical in determining whether the current bearish momentum will sustain or reverse. Risk management strategies should be employed, considering the support and resistance levels identified.


Disclaimer: This analysis is provided for informational purposes only and should not be construed as investment advice. Traders should conduct their own research and consider their risk tolerance before entering any trades.


FxGlory
05.02.2024
 
USDSGD analysis for 06.02.2024


USDSGDH4.jpg

Time Zone: GMT +2
Time Frame: 4 Hours (H4)


Fundamental Analysis:

The USDSGD pair reflects the exchange rate between the US Dollar and the Singapore Dollar. Key economic factors affecting the USD include Federal Reserve policy, inflation rates, and GDP growth, while the SGD is influenced by the Monetary Authority of Singapore's policy decisions, Singapore's trade balance, and economic health. The pair's dynamics can also be swayed by broader market sentiments and geopolitical events. Tracking such fundamental factors is essential as they provide insights into potential currency strength or weakness.


Price Action:
The USDSGD chart indicates a recent uptrend, with the price forming a series of higher highs and higher lows. The pair has made a significant bullish surge, as evidenced by the long green candlesticks, moving away from a period of consolidation.


Key Technical Indicators:
Parabolic SAR:
The dots are placed below the price candles, indicating a bullish trend and suggesting that the uptrend might continue.

RSI (Relative Strength Index): The RSI is at 69.62, which is just below the overbought threshold of 70, pointing to strong bullish momentum but also the potential for a pullback if the market deems it overextended.

MACD (Moving Average Convergence Divergence): The MACD histogram shows positive values, and the MACD line is above the signal line, both suggesting bullish momentum. However, as the histogram bars appear to be shortening, this could indicate a potential slowdown in the bullish momentum.


Support and Resistance:
Resistance
: The immediate resistance may be at the recent high formed by the latest green candlestick.

Support: Should a retracement occur, the next level of support could be the previous consolidation zone's upper boundary.


Conclusion and Consideration:
The USDSGD pair is exhibiting bullish behavior with potential for continuation as indicated by the Parabolic SAR. The RSI suggests the momentum is strong, although nearing overbought conditions. The MACD confirms the bullish trend but signals caution if the histogram bars continue to decrease in height. Traders should watch for potential retracements and consider the impact of upcoming economic data releases on both the USD and SGD. Risk management is crucial, and traders should set stop losses and take profits according to the identified support and resistance levels.


Disclaimer: This analysis is provided for informational purposes only and should not be construed as investment advice. Traders should conduct their own research and consider their risk tolerance before entering any trades.


FxGlory
06.02.2024
 

Attachments

  • USDSGDH4.jpg
    USDSGDH4.jpg
    176.3 KB · Views: 0
BTCUSD analysis for 08.02.2024


fx-BTCUSDH4.jpg

Time Zone: GMT +2
Time Frame: 4 Hours (H4)


Fundamental Analysis:

The BTCUSD pair represents the exchange rate between Bitcoin (BTC) and the US Dollar (USD). Factors affecting this pair include technological advancements in the Bitcoin network, regulatory news impacting the cryptocurrency space, and overall economic conditions that influence the strength of the US Dollar. The market sentiment can be swayed by Bitcoin's network developments, particularly scaling solutions and security updates, as well as by US monetary policy decisions and economic indicators such as inflation rates and job data. In light of the dynamic nature of the cryptocurrency markets and the global economic environment, these fundamental aspects are crucial for traders to monitor.


Price Action:
On the H4 timeframe, BTCUSD is displaying a bullish trend with the latest candles forming a series of higher highs. The uptick in price suggests a robust buying interest, and despite some periods of consolidation, the trend has remained upward, indicating continued bullish sentiment.


Key Technical Indicators:
RSI:
The Relative Strength Index is above 70, indicating strong buying pressure, though it also suggests the market is approaching overbought conditions.

MACD: The MACD indicator shows the histogram in positive territory and the MACD line above the signal line, reinforcing the current bullish trend.

Parabolic SAR: The placement of the Parabolic SAR dots below the price candles indicates that the upward trend is still intact.

Bollinger Bands: The price is currently trading near the upper band, showing a strong uptrend, but also signaling that the market might be in a potentially overextended state.


Support and Resistance:
Support
: The nearest support level is around the 38.2% Fibonacci retracement level, which aligns with the lower Bollinger Band.
Resistance: The next significant resistance is near the recent high at the 23.6% Fibonacci retracement level.


Conclusion and Consideration:
The BTCUSD on the H4 chart shows a strong bullish trend, as evidenced by the price action and reinforced by the RSI and MACD indicators. However, the proximity to the overbought territory in the RSI and the upper Bollinger Band suggests that traders should be cautious of potential retracements. Keeping an eye on fundamental news and being prepared for shifts in economic conditions are essential for traders. Risk management strategies, including setting stop losses and take-profit levels around key support and resistance areas, are advised to safeguard against market volatility.


Disclaimer: This analysis is for informational purposes only and should not be construed as investment advice. It is important for traders to conduct their own research and consider their risk tolerance before making trading decisions.


FxGlory
08.02.2024
 
SILVER analysis for 09.02.2024


SILVERH4.jpg

Time Zone: GMT +2

Time Frame: 4 Hours (H4)


Fundamental Analysis:

Silver is traded against the US Dollar in the SILVER/USD pair. Fundamental factors affecting silver include industrial demand, mine production levels, and macroeconomic indicators that influence the US Dollar such as interest rates and inflation data. Investor sentiment can also be swayed by geopolitical events and trends in other commodity markets, particularly precious metals. Given that silver has applications in various industrial sectors, technological innovations and market demand in these areas can significantly impact its price.


Price Action:

The H4 timeframe for SILVER/USD shows a recent uptrend with the price moving above key moving averages. The market has been recovering from a dip, making higher highs and higher lows, indicating a reversal from the previous downtrend. The price is currently testing a significant resistance level.


Key Technical Indicators:
Parabolic SAR:
The last dot of the Parabolic SAR has flipped below the price candles, signaling a potential trend reversal to the upside.

RSI (Relative Strength Index): The RSI is hovering around 58, which is moderately bullish and suggests that there may still be room for upward price movement before reaching overbought conditions.

MACD (Moving Average Convergence Divergence): The MACD histogram is positive, with the MACD line above the signal line, indicating bullish momentum.

Bollinger Bands: The price is oscillating towards the upper Bollinger Band, which often acts as a dynamic resistance level.


Support and Resistance:
Support:
The 38.2% Fibonacci retracement level serves as the nearest support, followed by the lower Bollinger Band.

Resistance: The 50% Fibonacci level is the immediate resistance, with further potential resistance near the 61.8% retracement and the upper Bollinger Band.


Conclusion and Consideration:
The SILVER/USD pair on the H4 chart exhibits signs of a bullish reversal, supported by the positive crossover in the MACD and the Parabolic SAR signal. The RSI indicates that buyers are in control but not yet overextended. Traders should watch for a breakout above the 50% Fibonacci level for confirmation of continued bullish momentum. It's important to monitor fundamental factors such as economic data releases and industrial demand for silver, which could affect the trend. As the market approaches key resistance levels, setting appropriate risk management measures like stop losses is advisable, especially in the volatile commodities market.


Disclaimer: The provided analysis is for informational purposes only and does not constitute investment advice. Traders should conduct their own research and analysis before making any trading decisions.


FxGlory
09.02.2024
 
XRPUSD analysis for 12.02.2024


XRPUSDH4.jpg


Time Zone: GMT +2
Time Frame: 4 Hours (H4)


Fundamental Analysis:

The XRP/USD pair represents the value of Ripple in terms of the US Dollar. Key fundamental factors influencing Ripple may include regulatory news concerning cryptocurrency, overall market sentiment in the crypto space, and technological developments within the Ripple network. Additionally, macroeconomic factors affecting the US Dollar, such as Federal Reserve policy, inflation rates, and economic indicators, can also impact the pair. Investors' appetite for risk in the broader financial markets often correlates with the performance of digital assets like Ripple.


Price Action:

The H4 chart for XRP/USD demonstrates a bullish trend with price action forming a sequence of higher highs and higher lows. The market has sustained an uptrend after a period of consolidation, signaling a robust bullish sentiment. Currently, the price is persistently trading above the short-term moving averages, indicating maintained upward momentum.


Key Technical Indicators:
MACD:
The Moving Average Convergence Divergence is displaying a bullish crossover with the MACD line above the signal line, suggesting continued bullish momentum.

RSI: The Relative Strength Index is above 70, indicating that the market may be approaching overbought territory, which could lead to a potential pullback or consolidation.

Parabolic SAR: The dots of the Parabolic SAR are below the price candles, signifying a bullish trend.


Support and Resistance:
Support:
The nearest support level can be identified by the 50% Fibonacci retracement level, aligning with previous price consolidations.

Resistance: Immediate resistance is seen at the recent high, which is close to the 0% Fibonacci retracement level. A break above this could lead to testing new resistance levels.


Conclusion and Consideration:

The XRP/USD pair on the H4 timeframe presents a bullish outlook, backed by technical indicators such as the positive MACD and the bullish Parabolic SAR signal. While the RSI suggests caution for potential overbought conditions, the prevailing trend remains upward. Traders should consider the impact of upcoming economic announcements and regulatory developments in the crypto industry. Watching for a sustained break above current resistance or a retracement to support levels for entry points could be prudent, always with a mindful approach to risk management.


Disclaimer: This analysis is for informational purposes only and is not investment advice. Investors should conduct their own due diligence before engaging in trading activities.


FxGlory
12.02.2024
 
EURUSD Technical Analysis for 13.02.2024


EURUSDH4.jpg


Time Zone: GMT +2
Time Frame: 4 Hours (H4)


Fundamental Analysis:

The EUR/USD pair, indicative of the Euro against the US Dollar's value, is sensitive to a range of economic stimuli. Key influences include policy shifts by the European Central Bank and the Federal Reserve, alongside pivotal economic data from both economies such as GDP growth, inflation, and job market dynamics. This currency pair is a global economic health gauge.


Price Action:
EUR/USD's H4 chart reveals a consolidation pattern, with the latest price action pressing against the upper Bollinger Band. This behavior signals a potential breakout or a retraction into the established range.


Key Technical Indicators:
MACD:
The MACD remains subdued around the signal line, indicating a lack of decisive momentum in the market.

RSI: The Relative Strength Index hovers around the 50 mark, suggesting a balanced dynamic without clear overextension in either direction.

Parabolic SAR: The last four Parabolic SAR indicators have appeared above the price candles, suggesting a potential downtrend or a pause in bullish activity.

Bollinger Bands: The EUR/USD is trading within the Bollinger Bands, signifying a state of equilibrium with no significant breakouts observed.


Support and Resistance:
Support:
The primary support level is identified at the lower Bollinger Band, reinforced by historical lows.

Resistance: Resistance is currently at the upper Bollinger Band, and a convincing break above this could signal a shift to bullish momentum.


Conclusion and Trading Considerations:
The EUR/USD analysis on the H4 chart suggests a tentative market with a slight bearish hint given by the Parabolic SAR positioning. However, with MACD showing no clear trend and RSI indicating a neutral stance, the market lacks conviction. Traders should monitor forthcoming economic data releases, which could incite volatility and provide clearer direction. A prudent approach is recommended, with close attention to the Bollinger Bands for potential breakout or pullback indications.


Disclaimer: This analysis is for educational purposes only, not constituting investment advice. Traders should undertake their own research and practice caution when engaging in the market.


FxGlory
13.02.2024
 
USDSEK analysis for 16.02.2024


FXGlory - USDSEK - 02.16.2024 - Technical Analysis.jpg


Time Zone: GMT +2
Time Frame: 4 Hours (H4)


Fundamental Analysis:

The USD/SEK currency pair is subject to a range of economic indicators from both the United States and Sweden, including interest rate decisions, GDP reports, and employment data. The strength of the US Dollar is closely tied to Federal Reserve policies and global risk sentiment. Conversely, the Swedish Krona is influenced by the Riksbank's monetary policy, as well as Sweden's trade balance and political stability. Global economic trends and commodity prices, given Sweden's export-oriented economy, also impact the exchange rate.


Price Action:


The H4 chart indicates a period of consolidation with a recent bearish move, suggesting an increase in selling pressure for USD/SEK. The price has breached below a previous consolidation area, indicating potential continuation of the downtrend. The last session closed with a bearish candle, reinforcing the current negative sentiment in the market.


Key Technical Indicators:
Parabolic SAR:
The indicator's dots are positioned above the price candles, indicating a bearish trend. The persistence of this pattern could further confirm the downtrend.

Bollinger Bands: The price is oscillating towards the lower Bollinger Band, suggesting that the market is bearish. The band's width indicates moderate market volatility.

MACD: The MACD histogram is below the baseline, and the signal line is above the MACD line, both signifying bearish momentums.

RSI: The RSI is hovering around 40, which suggests that while the market is bearish, it is not in oversold territory yet.


Support and Resistance:
Support:
The nearest support level can be identified at the lower end of the recent price consolidation area, followed by the lower Bollinger Band.

Resistance: Resistance can be seen at the level where the price broke down from the consolidation, with additional resistance near the middle Bollinger Band.


Conclusion and Consideration:
The technical indicators for USD/SEK on the H4 chart suggest a bearish outlook, with both Parabolic SAR and MACD indicating downward momentum. The recent price action supports the likelihood of further declines. However, the market is not oversold according to the RSI, which might imply that there is room for further downward movement before a potential reversal. Traders should monitor key economic releases from the US and Sweden, as these could significantly impact the pair's movement. Caution should be taken due to the market volatility, and employing a risk management strategy is advised.


Disclaimer: This analysis is for informational purposes only and should not be construed as investment advice. Market conditions can change rapidly, and traders are advised to conduct their own research before making any financial decisions.


FxGlory
16.02.2024
 
XRPUSD analysis for 19.02.2024


FXGlory-daily-Technical-Analysis---XRPUSD-H4.jpg

Time Zone: GMT +2
Time Frame: 4 Hours (H4)


Fundamental Analysis:

XRP, paired against the US Dollar as XRPUSD, is influenced by both cryptocurrency market sentiment and macroeconomic factors affecting the USD. Regulatory news specifically targeting Ripple, the company associated with XRP, can cause price fluctuations, as can broader market trends in blockchain and financial technology sectors. Additionally, changes in investor risk appetite, as well as developments in monetary policy from the US Federal Reserve, can affect this pair's movement.


Price Action:

The XRPUSD H4 chart indicates a bullish trend, with the price having recently risen above several key resistance levels. The price has been making a series of higher highs and higher lows, suggesting a strong upward momentum. However, the current price is retracing, possibly retesting previous resistance levels now turned support.


Key Technical Indicators:
Bollinger Bands: The price has pulled back to the middle Bollinger Band, which could act as support, suggesting a consolidation phase after the recent uptick.

RSI (Relative Strength Index): The RSI is above 60, indicating a strong bullish momentum, yet not in the overbought territory which offers room for potential further upward movement.

MACD (Moving Average Convergence Divergence): The MACD line remains above the signal line and above zero, confirming the bullish sentiment, although the histogram suggests a slowing momentum as bars decrease in height.


Support and Resistance Levels:
Support
: The 50% Fibonacci retracement level is acting as immediate support, with additional support potentially at the 38.2% level if a deeper pullback occurs.

Resistance: The next resistance is near the 61.8% Fibonacci retracement level, with further pressure likely at the recent high just under the 0.58 mark.


Conclusion and Consideration:
The bullish trend in XRPUSD on the H4 chart is supported by the positive alignment of MACD and the above-midpoint RSI reading. The approach towards the 61.8% Fibonacci level could be critical; if it breaks, it may indicate continued bullish momentum. Traders should consider global crypto market sentiment and regulatory news affecting Ripple, as well as USD fluctuations. Risk management strategies should be in place to prepare for volatility inherent in the cryptocurrency markets.


Disclaimer: This analysis is for informational purposes only and should not be taken as investment advice. Decisions should be based on individual research and risk tolerance.


FxGlory
19.02.2024
 
EURNZD analysis for 20.02.2024


EURNZD H4 Chart Technical Analysis on 02-20-2024 .jpg


Time Zone: GMT +2
Time Frame: 4 Hours (H4)


Fundamental Analysis:

The EURNZD currency pair reflects the economic dynamics between the Eurozone and New Zealand, encompassing factors like the European Central Bank's (ECB) monetary policies, Eurozone economic health, and New Zealand's export data, among others. The Euro is influenced by fiscal developments within the EU and broader geopolitical issues affecting the region. The New Zealand Dollar often reacts to changes in commodity prices, especially dairy products, and the Reserve Bank of New Zealand's (RBNZ) interest rate decisions.


Price Action:
The H4 chart shows a downtrend with the price movement currently in a bearish phase for EURNZD. The latest candles are bearish, suggesting increased selling pressure. The price has recently crossed below the middle Bollinger Band, indicating a potential continuation of the downward trend.


Key Technical Indicators:
Bollinger Bands
: The price is breaking towards the lower Bollinger Band, which typically indicates bearish sentiment. The width of the bands suggests increasing volatility.

MACD: The MACD histogram is below the zero line, and the signal line is above the MACD line, further confirming bearish momentum.

RSI: The RSI is below 50, indicating bearish momentum. However, it is not yet in the oversold region, suggesting there may still be room for downward movement.


Support and Resistance:
Support: The nearest support level is likely around the lower Bollinger Band, with a further support level possibly forming at the recent low.

Resistance: Immediate resistance is around the middle Bollinger Band, followed by the upper band which may coincide with previous price peaks.


Conclusion and Consideration:
The EURNZD pair shows a bearish trend on the H4 chart, with the Bollinger Bands, MACD, and RSI all signaling a continuation of the current downward momentum. Traders should watch for any economic updates from the Eurozone and New Zealand that could affect the pair's movement. Due to the observed volatility, a cautious approach with solid risk management would be prudent.


Disclaimer: This analysis is for informational purposes only and should not be construed as investment advice. Market conditions can change rapidly, and traders are advised to conduct their own research before making any financial decisions.


FxGlory
20.02.2024


FXGLORY.gif
 
Last edited:

Create an account or login to comment

You must be a member in order to leave a comment

Create account

Create an account on our community. It's easy!

Log in

Already have an account? Log in here.

Similar threads

Users Who Are Viewing This Thread (Total: 1, Members: 0, Guests: 1)

Top
AdBlock Detected

We get it, advertisements are annoying!

Sure, ad-blocking software does a great job at blocking ads, but it also blocks useful features of our website. For the best site experience please disable your AdBlocker.

I've Disabled AdBlock    No Thanks