What's new

My personal FX pairs and XAUUSD analysis

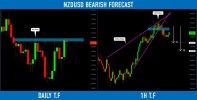
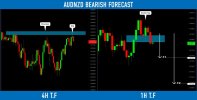
#NZDUSD: Classic Top-Down Setup

NZDUSD is approaching a solid horizontal daily resistance.
We see a strong bearish reaction from that:
the price formed a rising wedge pattern and a head and shoulders pattern,
the support of the wedge and the neckline of h&s were successfully broken.

I believe that the pair may drop.
Goals: 0.6237 / 0.622
 

Attachments

  • nzdusd.jpg
    nzdusd.jpg
    110.3 KB · Views: 2
Dow Jones Index (#US30): Key Levels to Watch This Week

Here is my latest structure analysis and key levels to watch this week on ⚠️Dow Jones.

Support 1: 31420 - 31830 area
Support 2: 30690 - 30900 area
Support 3: 30070 - 30360 area

Resistance 1: 32250 - 32610 area
Resistance 2: 33430 - 33660 area

The market is currently stuck between Support 1 & Support 2.
The market participants are awaiting the interest rate decision on Wednesday.
It will most likely clarify the future direction of the market with a breakout.

Consider the underlined structures for pullback/breakout trading.
 

Attachments

  • us30.jpg
    us30.jpg
    117.8 KB · Views: 2
GBPCHF broke and closed above a major falling trend line on a daily.
The broken trend line turned into a key vertical support now.
Probabilities will be high, that a bullish movement will initiate from that.

Next goals for buyers: 1.1423 / 1.151
For Additional confirmation use: Leading Indicators
 

Attachments

  • gbpchf.jpg
    gbpchf.jpg
    101.8 KB · Views: 2
GOLD (#XAUUSD): Detailed Structure Analysis

Here is my detailed structure analysis for ⚠️Gold.

Resistance 1: 1998.0 - 2010.0 area
Resistance 2: 2050.0 - 2070.0 area

Support 1: 1949.0 - 1960.0 area
Support 2: 1875.0 - 1904.0 area
Support 3: 1854.0 - 1859.0 area
Support 4: 1804.0 - 1813.0 area

Consider these structures for pullback / breakout trading.
 

Attachments

  • gold.jpg
    gold.jpg
    128 KB · Views: 2
AUDNZD reached a solid horizontal structure resistance.
The price formed a doji candle on 4h and a double top pattern on 1H time frame.
The neckline of the double top has just been broken.

I expect a retracement to 1.0767 / 1.0744
For Additional confirmation use: Swing Trading Indicators
 

Attachments

  • audnzd.jpg
    audnzd.jpg
    105.5 KB · Views: 2
#GBPNZD: Classic Bullish Setup Explained

GBPNZD formed a huge ascending triangle formation on a daily time frame.
Its neckline was broken yesterday.

Probabilities are high that the price will grow now.
Goal - 1.998
 

Attachments

  • gbpnzd.jpg
    gbpnzd.jpg
    100.1 KB · Views: 2
#EURUSD: Important Breakout

Bulls push EURUSD heavily after yesterday's Interest Rate Decision and FOMC.
The price has successfully broken and closed above a solid horizontal supply cluster.

The next solid resistance that I see is 1.099 - 1.103 area.
Probabilities will be high that it is the next goal for buyers.

For those, who missed entries, I strictly recommend waiting for a pullback first.
I will post an update later on.
For Additional confirmation use: Xmaster Formula MT4 Indicator
 

Attachments

  • eurusd.jpg
    eurusd.jpg
    60.1 KB · Views: 2
#GBPCAD: Pullback From Key Level

GBPCAD reached a major horizontal resistance.
The price has nicely reacted to that, forming a bearish engulfing candle on 4H time frame.

I expect a retracement from the underlined structure.
Goals: 1.68 / 1.677
 

Attachments

  • gbpcad.jpg
    gbpcad.jpg
    95.5 KB · Views: 2
Nasdaq-100 Index (#US100) Waiting For Breakout

⚠️Nasdaq Index is stuck between 2 solid structures.
Depending on the reaction to the underlined areas, I see 2 potential scenarios.

1 - Bullish
If the price breaks and closes above 12700 - 12900 supply cluster on a daily,
I will expect a bullish movement at least to 13130

2 - Bearish
If the price drops and closes below 12300 - 12500 demand area on a daily,
I will expect a selloff to 11900

Wait for a breakout, it will show us the future direction of the market.
For Additional confirmation use: Breakout Indicator
 

Attachments

  • us30.jpg
    us30.jpg
    110.4 KB · Views: 3
#CHFJPY: Classic Bearish Setup

CHFJPY has nicely respected a confluence zone based on a horizontal 4H resistance and a 0.5 retracement of the last bearish impulse.

The price formed a double top pattern on that and broke its neckline.

Probabilities will be high that the pair will drop lower soon.
Goals: 141.172 / 140.363
 

Attachments

  • chfjpy.jpg
    chfjpy.jpg
    57.5 KB · Views: 2
Market Breakdown | WTI Oil, EURUSD, GBPNZD, EURAUD

Here are the updates & outlook for multiple instruments in my watchlist.

1️⃣ 
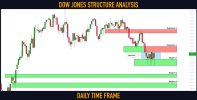
WTI Oil daily time frame️
The market is trading in a long term bearish trend .
After the last sharp bearish movement, the market is steadily recovering.

Ahead, I see a major horizontal supply area.
Probabilities are high, that the next bearish wave will initiate from there.

2️⃣ 
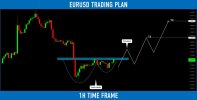
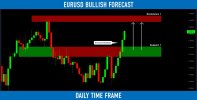
EURUSD daily time frame
After a breakout of a solid daily resistance, the market is preparing for its retest.
Watch carefully the underlined zone and look for buying opportunities from there.

3️⃣ EURAUD weekly time frame
The pair is currently approaching a weekly horizontal resistance cluster.
Taking into consideration, that the pair is quite overbought, probabilities will be high to see a pullback from that

4️⃣ 
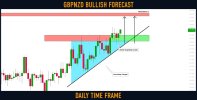
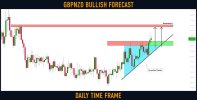
GBPNZD daily time frame
The pair is currently retesting a broken neckline of an ascending triangle. As we discussed earlier, the trend line of a triangle and its neckline compose a contracting buy zone now.
Chances will be high that the next bullish wave will initiate quite soon.
 

Attachments

  • market.jpg
    market.jpg
    116.1 KB · Views: 2
Gold (#XAUUSD): 2 Scenarios For This Week Explained

⚠️Gold closed this week, approaching a solid daily resistance.
Depending on the reaction of the price to that structure, I see 2 potential scenarios for next week.

Bullish Scenario
If the price breaks and closes above 2010 resistance on a daily,
a bullish continuation will be expected to 2060 level.

Bearish Scenario
The price may respect the underlined resistance.
1917 - 1940 is the closest strong support.
If the price drops and closes below that area,
a bearish continuation will be expected to 1891.

Wait for a breakout and then follow the market.
 

Attachments

  • gold.jpg
    gold.jpg
    59.1 KB · Views: 2
#USDJPY: Key Levels to Watch This Week

Here is my latest structure analysis for USDJPY.

Resistance 1: 132.46 - 133.25 area
Resistance 2: 135.0 - 135.8 area
Resistance 3: 137.36 - 137.9 area

Support 1: 129.64 - 130.7 area
Support 2: 128.09 - 128.7 area
Support 3: 127.2 - 127.8 area

Consider these structures for pullback/breakout trading.
 

Attachments

  • usdjpy.jpg
    usdjpy.jpg
    114.4 KB · Views: 2
#GBPNZD: Nice Bullish Clues

Update for GBPNZD.
It looks like the price has nicely respected a broken triangle.
The price formed a bullish engulfing candle on a daily.

Bullish bias on a pair remains.
Goal remains unchanged - 1.997
 

Attachments

  • gbpnzd.jpg
    gbpnzd.jpg
    102 KB · Views: 2
#EURUSD: Peculiar Pattern

I spotted a cup & handle pattern on ⚠️EURUSD on 1H time frame.
1.0777 - 1.0783 is its neckline.

If the price breaks and closes above that, I will expect a bullish movement.
Goals will be 1.0843 / 1.0894

If the price sets a new low, the pattern will become invalid.
 

Attachments

  • eurusd.jpg
    eurusd.jpg
    85.7 KB · Views: 2
Natural Gas (#NATGASUSD): How to Buy With Confirmation

Hey traders,

I spotted a classic harmonic ABCD pattern on
Natural Gas.
The completion point of the pattern matches perfectly with a horizontal key level.

Analyzing intraday time frames, I also spotted a falling wedge pattern on 12H.

To buy with a confirmation, wait for a bullish breakout of the resistance of the wedge.
Its violation may initiate a bullish movement.

The goals will be 2.43 / 2.58
 

Attachments

  • gas.jpg
    gas.jpg
    71.2 KB · Views: 2
#EURCAD: One More Bullish Move Ahead

EURCAD is taking off from a solid horizontal structure support.
The price formed a bullish engulfing candle on a 4H time frame,
engulfing the range of the last 4 candles.

Chances will be high to see a movement up.
Goals: 1.485 / 1.4914
 

Attachments

  • eurcad.jpg
    eurcad.jpg
    87.6 KB · Views: 2
Dollar Index (#DXY): Key Levels to Watch This Week

Here is my latest structure for Dollar Index.

Resistance 1: 103.11 - 103.63 area
Resistance 2: 104.74 - 105.1 area
Resistance 3: 105.667 - 105.88 area

Support 1: 100.82 - 100.88 area

Consider these structures for pullback/breakout trading.
 

Attachments

  • dxy.jpg
    dxy.jpg
    89.4 KB · Views: 2
#USDCAD: Important Breakout

USDCAD broke and closed below a solid horizontal demand cluster on a daily.
The broken structure turned into resistance now.

Probabilities will be high to see a bearish move from that.
Goals will be 1.356 / 1.346
 

Attachments

  • usdcad.jpg
    usdcad.jpg
    55.3 KB · Views: 2
#EURJPY: Detailed Structure Analysis

Here are my latest structure analysis for ⚠️EURJPY.

Support 1: 138.80 - 139.25 area
Support 2: 137.38 - 138.18 area

Resistance 1: 143.19 - 143.6 area
Resistance 2: 145.00 - 145.58 area
Resistance 3: 146.40 - 146.7 area

Consider these structures for pullback/breakout trading.
 

Attachments

  • eurjpy.jpg
    eurjpy.jpg
    117.6 KB · Views: 2

Create an account or login to comment

You must be a member in order to leave a comment

Create account

Create an account on our community. It's easy!

Log in

Already have an account? Log in here.

Similar threads

Users Who Are Viewing This Thread (Total: 1, Members: 0, Guests: 1)

Top
AdBlock Detected

We get it, advertisements are annoying!

Sure, ad-blocking software does a great job at blocking ads, but it also blocks useful features of our website. For the best site experience please disable your AdBlocker.

I've Disabled AdBlock    No Thanks