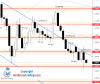
On Monday the price continued to move down and reached an area of supply close to $1.07825 and bounced up.
The move up was more retrace than a bounce because the price has reached all two levels I have mentioned, $1.07825 and $1.09860.
The reason is in the demand zone close to support $1.07825 which had lots of buyers waiting to enter into the market.
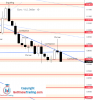
On the move up the price stopped on the confluence level of resistance where horizontal resistance $1.10755 and downtrend channel resistance line are crossing.
We can look on the chart and find levels with strong influence on the price and levels with weak influence.
Strong levels are $1.10755 on the upper side and $1.07825 on the lower side.
Weak levels are $1.09860 on the upper side and $1.08846 on the lower side.
The price is in the middle of the weak levels and since the market is in the bearish mode I am targeting lower levels this week.
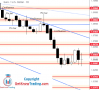
The reason is the weak EUR currency and relatively strong U.S. dollar. This is confirmed by the currency strength meter below.
View attachment 20007
Source:
Currency Strength Meter App
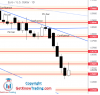
The final target is $1.07825 because it is the strongest support the price has in front of it.
View attachment 20008


")


 , Thanks your sharing