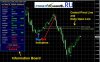
Indicator is active on a Chart The Information board gives you the Trend Analysis of M1 to H4 Time Frames :
Trend is UP or DOWN, WEAK or STRONG, BULLISH or BEARISH using MACD, RSI and Moving Average Strategies And the BUY/SELL (BLUE and RED spots) shows you when to buy and when to sell using Non-Repaint ADX Crossing Indicator system with Message/Sound and Email Alerts
This ADX Crossing Arrow (spots) indicator is a Cyclic indicator which follows: Buy-Sell-Buy Sell……Sequence
If don't work pls setting tools>options>expert advisors>enable DLL