_elabin
New Member
*** XAUUSD
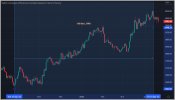
Prone to Fall (from the highest of a trend)
Pivot Date: 2023-04-14 (32 days ago)
Last Update: 2023-05-07
Live chart preview:
================================================
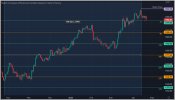
Support and Resistance Levels (Gann Degree)
Degree >>>> Support >>>> Resistance
45º >>>> 1979.04 >>>> 2122.21
90º >>>> 1909.32 >>>> 2195.68
135º >>>> 1840.86 >>>> 2270.39
180º >>>> 1773.64 >>>> 2346.36
225º >>>> 1707.68 >>>> 2423.57
270º >>>> 1642.97 >>>> 2502.03
315º >>>> 1579.50 >>>> 2581.75
360º >>>> 1517.29 >>>> 2662.71
================================================
Square of Price and Time (Gann Square)
Bottom Date: 27 Sep 2022
Top Date: 14 Apr 2023
Price Low: 1622.29 ⟶ 262°
Price High: 2047.49 ⟶ 186°
Price Range: 425.2 ⟶ 225°
Work Day: 140 ⟶ 97°
Calendar Day: 199 ⟶ 147°
Result :
• 140 working days is squared with the price (Tolerance: 1 degrees; Multiple of 270)


