What's new

Permission errors

  • Permission 'viewOthers' unknown for content type 'node' (src/XF/Entity/User.php:1278)
  • Permission 'viewOthers' unknown for content type 'node' (src/XF/Entity/User.php:1278)
  • Permission 'viewOthers' unknown for content type 'node' (src/XF/Entity/User.php:1278)
  • Permission 'viewOthers' unknown for content type 'node' (src/XF/Entity/User.php:1278)
  • Permission 'viewOthers' unknown for content type 'node' (src/XF/Entity/User.php:1278)
  • Permission 'viewOthers' unknown for content type 'node' (src/XF/Entity/User.php:1278)
Top Forex Forum | Get Forex Trading Strategies & Feeds | Forex Forum

This is a sample guest message. Register a free account today to become a member! Once signed in, you'll be able to participate on this site by adding your own topics and posts, as well as connect with other members through your own private inbox!

Daily Market Analysis and Overview by Unitedpips

5.00 star(s) 2 Votes
USD/CAD Daily Analysis: Key Levels and Bearish Outlook

USDCAD-Daily-Analysis-Key-Levels-and-Bearish-Outlook-.webp


Introduction to USD/CAD
The USD CAD currency pair, also known as the "Loonie," represents the exchange rate between the United States Dollar (USD) and the Canadian Dollar (CAD). The pair is widely traded globally due to significant economic connections between the United States and Canada, particularly in energy trade. Traders and investors frequently monitor USD/CAD as it reflects the economic health and market dynamics of both countries.


USD-CAD Market Overview
USDCAD is currently experiencing volatility, influenced by recent economic reports and central bank activities from both nations. The latest API and EIA crude oil inventories data significantly impact the Canadian dollar due to Canada's extensive energy sector, often leading to sharp price movements in the pair. On the USD side, market sentiment remains cautious ahead of upcoming FOMC statements and interest rate decisions, which will likely shape future monetary policy expectations. Additionally, statements from the US President and economic data such as civilian labor costs and the monthly Treasury Statement contribute to the dollar's near-term fluctuations. Given the recent bearish momentum, traders should closely monitor economic releases from both the US and Canada over the next few days for directional clues.

USDCAD-Daily-Analysis-Key-Levels-and-Bearish-Outlook-12.10.2025-.webp


USD CAD Technical Analysis
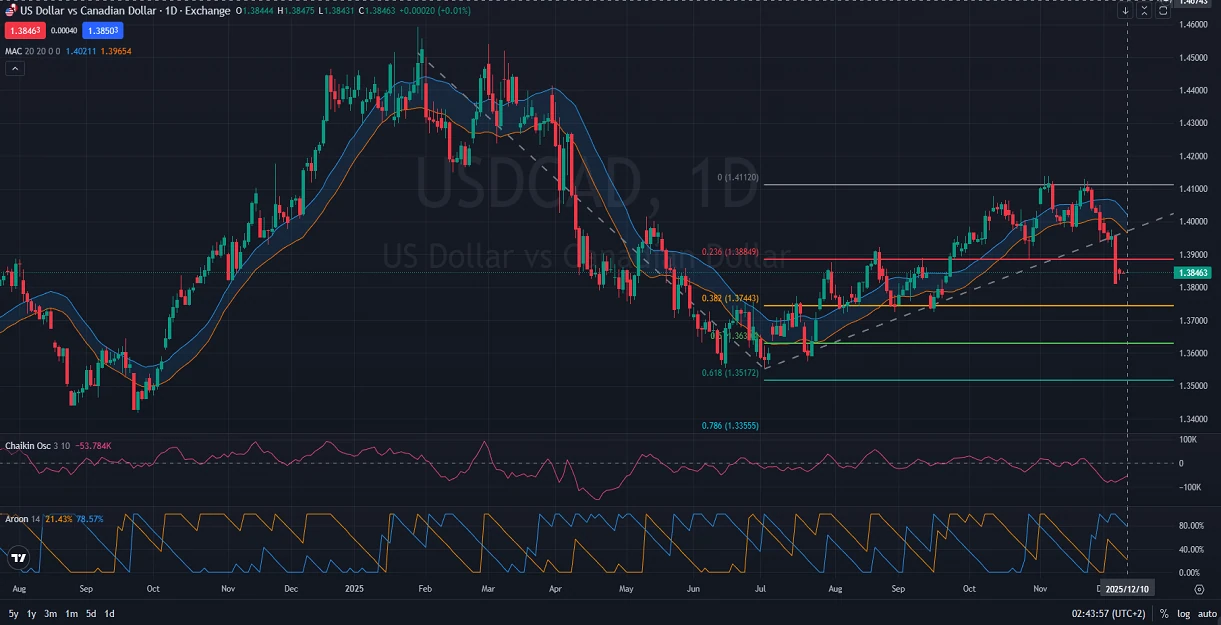
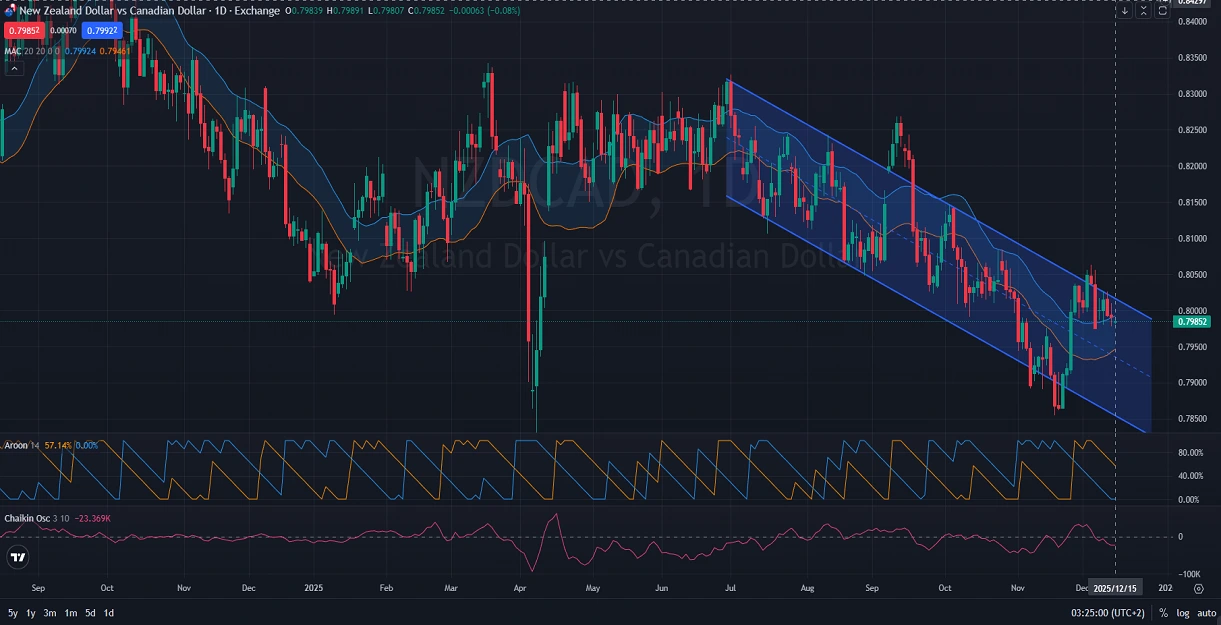
On the daily chart, USD/CAD has recently reversed from a steep bullish trend into a pronounced bearish move, forming a notable lower high. This pattern could signal the beginning of a sustained bearish trend or potential range-bound market conditions. The price action suggests increased likelihood of further bearish continuation toward the key Fibonacci retracement level at 0.382 (1.37443). Currently, the Moving Average Channel, with levels at 1.40211 and 1.39654, indicates ongoing bearish pressure. Additionally, the Chaikin Oscillator, showing a negative reading of -53.784K, supports bearish momentum, while the Aroon indicator (21.43% bullish, 78.57% bearish) strongly emphasizes the bearish sentiment dominating USD/CAD.


Final Words about USD vs CAD
Given the current technical and fundamental landscape, the USD/CAD pair seems poised for further bearish movement in the short term. Traders should closely watch upcoming US and Canadian economic announcements, especially oil inventories and monetary policy statements, which could catalyze significant volatility. Monitoring technical indicators like the Fibonacci levels, Chaikin Oscillator, and Aroon Indicator will help identify potential price reversals or continuation signals. As always, risk management and a strategic trading plan remain critical when navigating volatile forex markets such as USD/CAD.


Disclaimer: This USDCAD analysis, provided by Unitedpips, is for informational purposes only and does not constitute trading advice. Always conduct your own Forex analysis before making any trading decisions.


12.10.2025
 
NZD/CAD Forecast: Economic Releases Could Deepen Bearish Momentum

NZDCAD-Price-Action-Analysis-12.15.2025.featured-image.webp


Introduction to NZDCAD

The NZD/CAD currency pair, commonly referred to as the "Kiwi-Loonie," represents the exchange rate between the New Zealand dollar (Kiwi) and the Canadian dollar (Loonie). Traders and investors frequently follow NZD/CAD to assess economic health comparisons between New Zealand and Canada, two commodity-driven economies. The pair often moves with global commodity trends, particularly in agriculture and energy markets, influencing its volatility.


NZD CAD Market Overview
The NZD-CAD pair currently exhibits a bearish sentiment amid recent Canadian economic releases. Canadian housing starts and multiple CPI measurements, which significantly affect currency valuation, are expected soon. Strong housing starts and higher-than-expected CPI figures generally strengthen the Canadian dollar. The upcoming release of Canada’s CPI data on January 19, 2026, will be critical, as inflation indicators strongly influence central bank rate decisions. Conversely, the next BusinessNZ Performance of Services Index for New Zealand, due on January 26, 2026, will also impact the pair, with numbers above 50.0 indicating economic expansion and potentially providing some support for NZD.

NZDCAD-Price-Action-Analysis-12.15.2025.webp


NZD/CAD Technical Analysis
The daily chart for NZD CAD demonstrates long-term bearish sentiment, clearly reflected in a bearish price channel formation. Candlesticks currently gravitate towards the channel's mid-band, suggesting persistent selling pressure aiming for the lower channel boundary. The Moving Average Channel currently resides above the candles, reinforcing the bearish trend. The Aroon indicator at 57.14% bullish and 0.00% bearish indicates recent upward moves have limited strength, further supported by the Chaikin oscillator at -23.369K, confirming underlying selling momentum.


Final words about NZD vs CAD
Given the prevailing bearish technical structure and anticipated positive Canadian economic indicators, the NZD/CAD pair appears likely to maintain its downward trajectory. Traders should closely monitor Canadian CPI and housing data releases, along with New Zealand's upcoming services sector performance index, for clearer trading signals. The bearish channel's lower boundary could serve as the immediate downside target. Effective risk management is crucial, given the pair's susceptibility to rapid changes in commodity markets and economic data-driven volatility.


Disclaimer: This NZDCAD analysis, provided by Unitedpips, is for informational purposes only and does not constitute trading advice. Always conduct your own Forex analysis before making any trading decisions.


12.15.2025
 
USD vs JPY Daily Forecast: Economic Data in Focus

USDJPY-Price-Action-Analysis-12.24.2025.featured-image.webp


Introduction to USD/JPY
The USD-JPY pair, commonly known as the "Gopher," represents the exchange rate between the United States Dollar and the Japanese Yen. It is among the most traded currency pairs globally, influenced significantly by US economic data and Japan’s monetary policies. Traders closely monitor this pair to understand risk appetite, market sentiment, and shifts in economic strength between the US and Japan.


USD JPY Market Overview
The USD/JPY pair has recently faced resistance near the significant historical level at 157.491, indicating a strong psychological barrier for traders. Market sentiment is currently mixed due to recent economic indicators from both the US and Japan. On the US front, traders await key data releases including Jobless Claims scheduled for December 31, 2025, which will shed more light on labor market strength and economic health. Meanwhile, Japan’s Services Producer Price Index (CSPI), due January 27, 2026, and the detailed minutes from the Bank of Japan's latest policy meeting expected on January 28, 2026, are likely to offer crucial insights into Japan's inflation outlook and monetary policy stance. Traders are cautious, expecting volatility around these data points which could shape short-term trends.

USDJPY-Price-Action-Analysis-12.24.2025.webp


USD-JPY Technical Analysis
From a technical viewpoint, the daily chart of USD JPY shows that price action has reached the key resistance at 157.491 and has moved downward, affirming this level's historical significance. The recent bearish Harami pattern formation confirms a high probability of continued downward momentum. Indicators such as the Chaikin Oscillator currently standing at 60.826K suggest strong buying momentum, yet caution is advised as this might also signal potential exhaustion near resistance. The Fisher indicator values of 0.70 and 0.56 reflect diminishing bullish strength. Additionally, the Price Channel indicates the latest candle hovering around the mid-line, suggesting indecision and potential consolidation before the next significant move.


Final Words about USD vs JPY
Given the technical signals and the imminent economic releases, traders should anticipate potential volatility in USD/JPY movements. The resistance at 157.491 remains a critical point for confirming further direction. Should the US data reflect positive labor market conditions, USD may find additional strength. Conversely, more hawkish statements or inflationary signals from the Bank of Japan could reinforce Yen strength. Traders must closely observe these fundamental triggers and technical cues, ensuring effective risk management strategies are employed given the potential for sudden shifts in market sentiment.


Disclaimer:This USDJPY analysis, provided by Unitedpips, is for informational purposes only and does not constitute trading advice. Always conduct your own Forex analysis before making any trading decisions.


12.24.2025
 
USD-CHF Market Update: Range-Bound Trading Persists

USDCHF-Price-Action-Analysis-12.31.2025.featured-image.webp


Introduction to USDCHF
The USD/CHF currency pair, often referred to as the "Swissie," represents the value of the US dollar against the Swiss franc. Known for its stability and safe-haven characteristics, USD/CHF tends to be a popular choice among traders seeking lower volatility during uncertain market conditions. This pair is influenced significantly by both US economic data and Swiss economic indicators, making it essential for traders to monitor developments in both economies.


USD CHF Market Overview
Currently, USDCHF is experiencing range-bound movement, influenced by the latest economic data from both the United States and Switzerland. Recently, the US Dollar received positive momentum from favorable housing data with improvements indicated by the FHFA House Price Index and the S&P Case-Shiller Home Price Index, suggesting strength in the US housing market and providing support for the USD. Additionally, the upcoming release of the Chicago Purchasing Managers' Index (PMI) is anticipated to influence short-term USD dynamics. On the Swiss side, traders await the KOF Economic Barometer data due soon, which will forecast economic conditions for the next six months. Given the mixed economic signals, USD/CHF has remained range-bound, reflecting traders' caution and uncertainty about future trends.

USDCHF-Price-Action-Analysis-12.31.2025-1.webp


USD/CHF Technical Analysis
The daily chart of USD-CHF currently shows the pair trapped in a sideways market pattern, consolidating between strong support at 0.78818 and resistance at 0.80974. Following previous bearish movements, the price has stabilized within this clearly defined range, suggesting market indecision. The Williams Alligator indicator reveals intertwined moving averages, indicating consolidation with no clear momentum. The Chaikin Oscillator, although slightly positive, shows limited momentum in buying pressure. Meanwhile, the Fisher indicator remains neutral, suggesting balanced market sentiment without significant direction. Traders should watch closely for any breakout beyond the current support or resistance levels as this will signal the next major move for USD/CHF.


Final Words about USD vs CHF
Considering the prevailing market dynamics and economic conditions, USD/CHF will likely maintain its sideways movement until a significant economic trigger emerges. Investors and traders should keep an eye on upcoming data releases from the US and Switzerland, particularly housing indices and economic barometers, to anticipate potential market shifts. Risk management remains crucial due to the inherent uncertainty during these consolidation phases. Traders are advised to adopt a cautious approach, closely monitoring technical indicators and maintaining flexibility for quick adjustments to their positions based on emerging market signals.


Disclaimer: This USDCHF analysis, provided by Unitedpips, is for informational purposes only and does not constitute trading advice. Always conduct your own Forex analysis before making any trading decisions.


12.31.2025
 

Create an account or login to comment

You must be a member in order to leave a comment

Create account

Create an account on our community. It's easy!

Log in

Already have an account? Log in here.

Similar threads

Users Who Are Viewing This Thread (Total: 1, Members: 0, Guests: 1)

Back
Top