What's new

Forex News Daily Market Forecast By Capitalcore

5.00 star(s) 1 Vote
Technical Correction or Bullish Resumption for GBP USD

GBP/USD, commonly referred to as "Cable," is one of the most widely traded forex pairs globally. It represents the British Pound against the US Dollar and is known for its volatility and liquidity. Today, fundamental analysis highlights key economic events influencing both currencies. For GBP, the British Retail Consortium (BRC) price data release and a speech by Bank of England MPC Member Catherine Mann could impact sentiment, especially if the BRC figures indicate rising inflation or if Mann hints at a more hawkish monetary stance. On the USD side, speeches from Federal Reserve officials John Williams and Thomas Barkin, combined with reports on Durable Goods Orders and housing indices, could drive volatility—particularly if hawkish tones or stronger-than-expected economic data emerge, supporting the dollar's strength.

Chart Notes:
• Chart time-zone is UTC (+03:00)
• Candles’ time-frame is 4h.

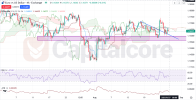
Analyzing the GBP/USD H4 chart reveals an overall bullish trend currently undergoing a bearish correction. The recent price action suggests the correction phase might have concluded, with prices stabilizing around the 0.236 Fibonacci expansion level. If bullish momentum resumes, targets at 0.382 or 0.5 Fibonacci levels are likely. However, continued bearish pressure could see the pair testing support around the historically significant 1.33989 level. Ichimoku analysis indicates a flat Senkou Span B above current candles, suggesting possible consolidation. MACD shows the histogram at 0.00058, with the MACD line just above zero at 0.00007 and the signal line at -0.00051, implying tentative bullish signals. Meanwhile, the RSI hovers near neutral at 46.33, indicating market indecision.

•DISCLAIMER: Please note that the above analysis is not an investment suggestion by “Capitalcore LLC”. This post has been published only for educational purposes.

Capitalcore
 
EUR/USD Steady Ahead of Key Consumer Sentiment

EUR/USD, the most actively traded currency pair in the world, reflects the euro against the US dollar and is heavily influenced by macroeconomic events on both sides of the Atlantic. Today, euro traders are focused on the release of NIQ’s consumer sentiment index, which gauges optimism or pessimism among households and serves as a leading indicator for spending trends in the eurozone. A stronger-than-expected reading could bolster the euro by signaling resilience in consumer confidence. On the US side, attention turns to energy-related data, with the American Petroleum Institute (API) and Energy Information Administration (EIA) crude oil inventory reports scheduled this week. Although typically more impactful for oil-sensitive currencies like the Canadian dollar, sharp swings in oil supply-demand dynamics can spill over into USD sentiment through inflation expectations. Additionally, a speech by Federal Reserve Bank of Richmond President Thomas Barkin, titled “Why the Consumer Matters”, is closely watched for policy cues; any hawkish tone reinforcing tighter monetary policy could strengthen the dollar, driving volatility in EUR/USD.
eurusd 08.27.png
Chart Notes:
• Chart time-zone is UTC (+03:00)
• Candles’ time-frame is 4h.

Analyzing the EUR/USD H4 chart shows the pair consolidating within a key support zone around 1.1600–1.1570, marked by repeated price reactions. The Ichimoku Cloud highlights ongoing indecision, with candles fluctuating inside the cloud and a downward sloping trendline suggesting persistent bearish pressure. However, the RSI is positioned near neutral at 47, reflecting market indecision rather than strong directional momentum. Meanwhile, the ATR at 0.00309 signals relatively low volatility, pointing to subdued price swings in the near term. A breakout above the descending trendline could trigger bullish continuation toward the 1.1700 zone, while sustained selling pressure may drive the pair below the highlighted support, opening the path toward 1.1500.

•DISCLAIMER: Please note that the above analysis is not an investment suggestion by “Capitalcore LLC”. This post has been published only for educational purposes.

Capitalcore
 
USDCAD Price Analysis and Movement Outlook

Based on the upcoming economic events, the USDCAD pair, nicknamed the "Loonie" due to the Canadian one-dollar coin featuring a loon, is poised for a volatile day. The fundamental outlook is complex as multiple high-impact US data releases clash with a single, but significant, Canadian GDP report. With Federal Reserve Governor Christopher Waller's speech on monetary policy, the US dollar's strength will be heavily influenced by any hawkish remarks about interest rates and inflation containment, particularly ahead of the US Core PCE price index release - the Fed's preferred inflation gauge. A higher-than-forecast Core PCE, coupled with positive readings from other reports like Personal Income and Expenditures, the Chicago PMI, and UoM consumer sentiment, could signal a resilient US economy, providing strong bullish momentum for the USD. Conversely, a weaker-than-expected Canadian GDP figure would further disadvantage the Canadian dollar, potentially reinforcing the bullish USD/CAD forex trend. Traders will be closely monitoring these releases for price action clues on the USD CAD daily chart technical analysis.

Chart Notes:
• Chart time-zone is UTC (+03:00)
• Candles’ time-frame is 4h.

The USD/CAD H4 live chart technical analysis today shows the pair is in a long-term slightly bullish trend, but has recently experienced a short-term bearish correction. The Loonie price has moved from around 1.39250 to 1.37400 over the last six days. However, recent price action suggests a potential reversal as the last two candles have corrected upward after touching a key support level, which is highlighted by a red box. This support level will be a crucial point to watch for traders. A significant challenge for the bulls is the bearish trend line, which is acting as the first resistance. A breakout above this trend line and the red rectangle would be a bullish signal and a key confirmation of a sustained upward move. The price is also trading below the red Ichimoku cloud, which has expanded and whose bands are moving downward, signaling a strong bearish sentiment in the short-term forex trend. Additionally, the Williams %R 14 indicator is at -90.02, which indicates that the pair is significantly oversold, and supports the possibility of an upward correction or a trend reversal. Traders should look for a break of the bearish trend line and the Ichimoku cloud to confirm a new bullish price action.

•DISCLAIMER: Please note that the above analysis is not an investment suggestion by “Capitalcore LLC”. This post has been published only for educational purposes.

Capitalcore
 
AUD USD price action chart outlook

The AUD/USD, also known by traders as the “Aussie”, is one of the most actively traded currency pairs in the forex market, often influenced by commodity prices and risk sentiment. Today’s focus on the AUDUSD pair comes as Australia releases several high-impact indicators including the Melbourne Institute CPI, ANZ job advertisements, building approvals, corporate profits, and the RBA commodity price index, while in the U.S., markets remain quiet due to the Labor Day holiday. Fundamentally, stronger-than-expected CPI and building approvals would boost the Aussie as they reflect underlying inflationary pressures and construction sector growth, while an uptick in corporate profits and commodity prices would further strengthen the outlook by signaling resilience in domestic demand and trade balance. However, thin U.S. liquidity due to the holiday could result in irregular volatility, meaning traders should be cautious of sudden price swings despite the broadly supportive Australian data backdrop.

Chart Notes:
• Chart time-zone is UTC (+03:00)
• Candles’ time-frame is 4h.

On the AUD/USD H4 chart technical analysis, the price is moving on a bullish short-term trend, with the last two bullish candles testing the 0.618 Fibonacci retracement level near 0.6547, which aligns with the long-term bearish descending trend line. Despite this recovery, the price action is still fluctuating between the 0.5 and 0.618 Fibonacci retracement zones, suggesting consolidation within a broader range. The Ichimoku Cloud is positioned below the candles, turning green with widening structure, while the Leading Span A is moving upward, reinforcing bullish sentiment. Momentum is also supported by the %R (14) at -2.78, indicating the pair is near overbought territory, yet still showing strong bullish pressure. Overall, AUD-USD price action suggests short-term upside potential, but traders should monitor the 0.6547–0.6560 resistance area closely as a decisive break above it could open the door toward 0.6580, while rejection may pull the pair back into the consolidation zone.

•DISCLAIMER: Please note that the above analysis is not an investment suggestion by “Capitalcore LLC”. This post has been published only for educational purposes.

Capitalcore
 

Create an account or login to comment

You must be a member in order to leave a comment

Create account

Create an account on our community. It's easy!

Log in

Already have an account? Log in here.

Similar threads

Users Who Are Viewing This Thread (Total: 6, Members: 0, Guests: 6)

Top
AdBlock Detected

We get it, advertisements are annoying!

Sure, ad-blocking software does a great job at blocking ads, but it also blocks useful features of our website. For the best site experience please disable your AdBlocker.

I've Disabled AdBlock    No Thanks