Unitedpips
Member
EUR/USD Technical Analysis and Market Sentiment

Introduction to EUR/USD
The EURUSD currency pair, often regarded as the most liquid and widely traded pair in the forex market, represents the exchange rate between the Euro, the official currency of the Eurozone, and the United States Dollar. This pair reflects the economic dynamics and monetary policies of the Eurozone and the United States, two of the world’s largest economies. EUR/USD is highly responsive to key macroeconomic indicators such as GDP growth, inflation data, and central bank decisions from the European Central Bank (ECB) and the Federal Reserve (Fed). Due to its high liquidity and volatility, it attracts a diverse range of market participants, from short-term traders to long-term investors, who closely watch geopolitical events, trade relations, and economic trends influencing both regions.
EURUSD Market Overview
The EUR/USD pair is showing cautious volatility ahead of key Eurozone inflation data and a series of Federal Reserve speeches this week. Traders are eyeing the Eurozone Consumer Price Index (CPI) release on September 12 and the Wholesale Price Index (WPI) on September 15, both crucial for gauging inflationary pressures in the Eurozone. Additionally, the Bundesbank’s 10-year bond auction on September 10 will provide insights into investor confidence and interest rate expectations. On the US side, Federal Reserve officials, including Richmond’s Thomas Barkin and Chicago’s Austan Goolsbee, are scheduled to speak, with markets closely monitoring for any hawkish signals that could strengthen the dollar. With the US dollar’s recent resilience amid expectations of ongoing Fed tightening, EUR/USD faces downward pressure but remains sensitive to upcoming economic data and central bank commentary.

EUR-USD Technical Analysis
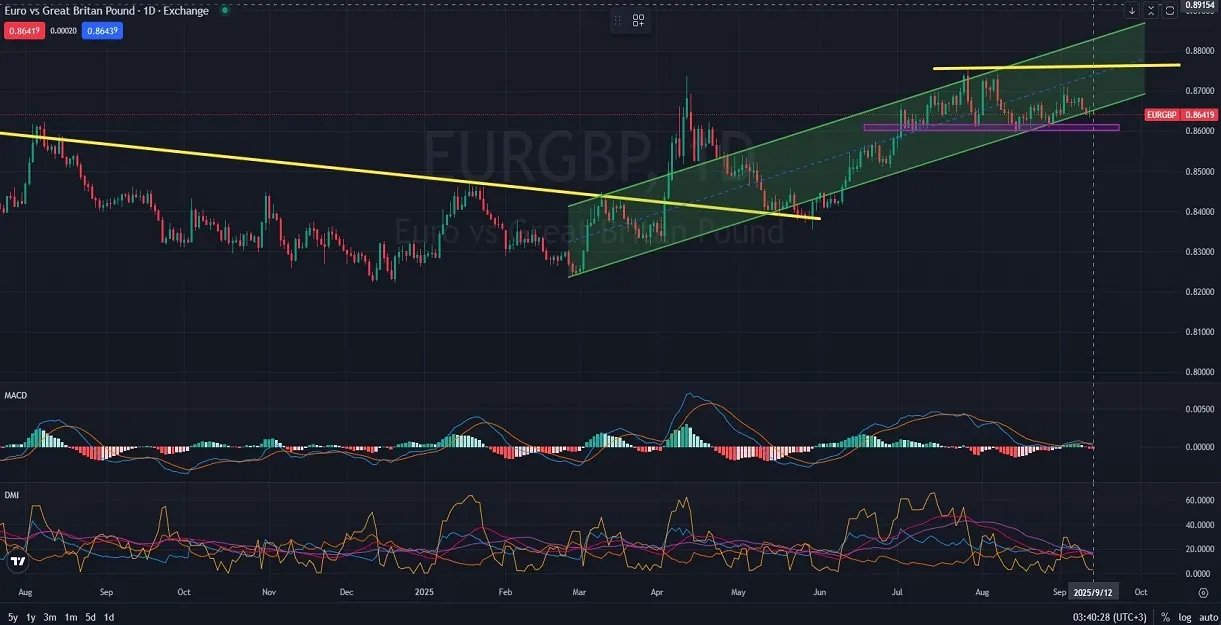
The EUR/USD pair is currently experiencing moderate volatility as traders await key Eurozone inflation data, including the Consumer Price Index (CPI) release on September 12 and the Wholesale Price Index (WPI) on September 15, both critical for assessing inflationary trends. Additionally, the Bundesbank’s 10-year bond auction on September 10 will be monitored for insights into investor confidence and interest rate expectations. On the US side, Federal Reserve officials such as Richmond’s Thomas Barkin and Chicago’s Austan Goolsbee are scheduled to speak, with markets attentive to any hawkish signals impacting the dollar. Amid the dollar’s recent resilience on expectations of further Fed tightening, EUR/USD faces downward pressure but remains sensitive to upcoming data and central bank commentary.
Final Words About EUR vs USD
In summary, the EUR/USD pair remains at a critical juncture, influenced heavily by upcoming Eurozone inflation reports and key Federal Reserve communications. The interplay between European price pressures and US monetary policy expectations will likely determine the pair’s near-term trajectory. Traders should closely monitor these economic releases and central bank signals, as shifts in either region’s outlook could drive significant volatility. Overall, the EUR/USD market continues to reflect the broader economic and geopolitical dynamics shaping both the Eurozone and the United States.
Disclaimer: This EURUSD analysis, provided by Unitedpips, is for informational purposes only and does not constitute trading advice. Always conduct your own Forex analysis before making any trading decisions.
08.13.2025
Introduction to EUR/USD
The EURUSD currency pair, often regarded as the most liquid and widely traded pair in the forex market, represents the exchange rate between the Euro, the official currency of the Eurozone, and the United States Dollar. This pair reflects the economic dynamics and monetary policies of the Eurozone and the United States, two of the world’s largest economies. EUR/USD is highly responsive to key macroeconomic indicators such as GDP growth, inflation data, and central bank decisions from the European Central Bank (ECB) and the Federal Reserve (Fed). Due to its high liquidity and volatility, it attracts a diverse range of market participants, from short-term traders to long-term investors, who closely watch geopolitical events, trade relations, and economic trends influencing both regions.
EURUSD Market Overview
The EUR/USD pair is showing cautious volatility ahead of key Eurozone inflation data and a series of Federal Reserve speeches this week. Traders are eyeing the Eurozone Consumer Price Index (CPI) release on September 12 and the Wholesale Price Index (WPI) on September 15, both crucial for gauging inflationary pressures in the Eurozone. Additionally, the Bundesbank’s 10-year bond auction on September 10 will provide insights into investor confidence and interest rate expectations. On the US side, Federal Reserve officials, including Richmond’s Thomas Barkin and Chicago’s Austan Goolsbee, are scheduled to speak, with markets closely monitoring for any hawkish signals that could strengthen the dollar. With the US dollar’s recent resilience amid expectations of ongoing Fed tightening, EUR/USD faces downward pressure but remains sensitive to upcoming economic data and central bank commentary.
EUR-USD Technical Analysis
The EUR/USD pair is currently experiencing moderate volatility as traders await key Eurozone inflation data, including the Consumer Price Index (CPI) release on September 12 and the Wholesale Price Index (WPI) on September 15, both critical for assessing inflationary trends. Additionally, the Bundesbank’s 10-year bond auction on September 10 will be monitored for insights into investor confidence and interest rate expectations. On the US side, Federal Reserve officials such as Richmond’s Thomas Barkin and Chicago’s Austan Goolsbee are scheduled to speak, with markets attentive to any hawkish signals impacting the dollar. Amid the dollar’s recent resilience on expectations of further Fed tightening, EUR/USD faces downward pressure but remains sensitive to upcoming data and central bank commentary.
Final Words About EUR vs USD
In summary, the EUR/USD pair remains at a critical juncture, influenced heavily by upcoming Eurozone inflation reports and key Federal Reserve communications. The interplay between European price pressures and US monetary policy expectations will likely determine the pair’s near-term trajectory. Traders should closely monitor these economic releases and central bank signals, as shifts in either region’s outlook could drive significant volatility. Overall, the EUR/USD market continues to reflect the broader economic and geopolitical dynamics shaping both the Eurozone and the United States.
Disclaimer: This EURUSD analysis, provided by Unitedpips, is for informational purposes only and does not constitute trading advice. Always conduct your own Forex analysis before making any trading decisions.
08.13.2025