FXGlory Ltd
Member
EURUSD H4 Daily Technical and Fundamental Analysis for 07.24.2025

Time Zone: GMT +3
Time Frame: 4 Hours (H4)
Fundamental Analysis:
The EUR/USD currency pair today faces key economic indicators from both the Eurozone and the United States, potentially driving volatility. The upcoming releases include consumer sentiment from NIQ, unemployment rates, and several critical PMI readings from S&P Global, expected to significantly impact the EUR’s strength. Similarly, the USD may experience volatility with upcoming PMI data from manufacturing and services sectors and new home sales data. Traders should closely monitor these releases as they provide insight into economic health and consumer confidence, influencing the short-term direction of EUR-USD.
Price Action:
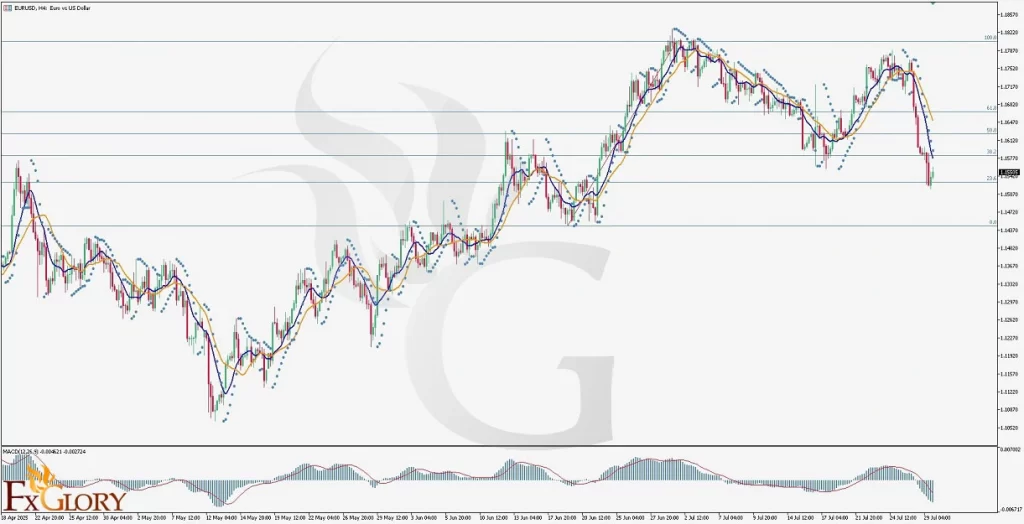
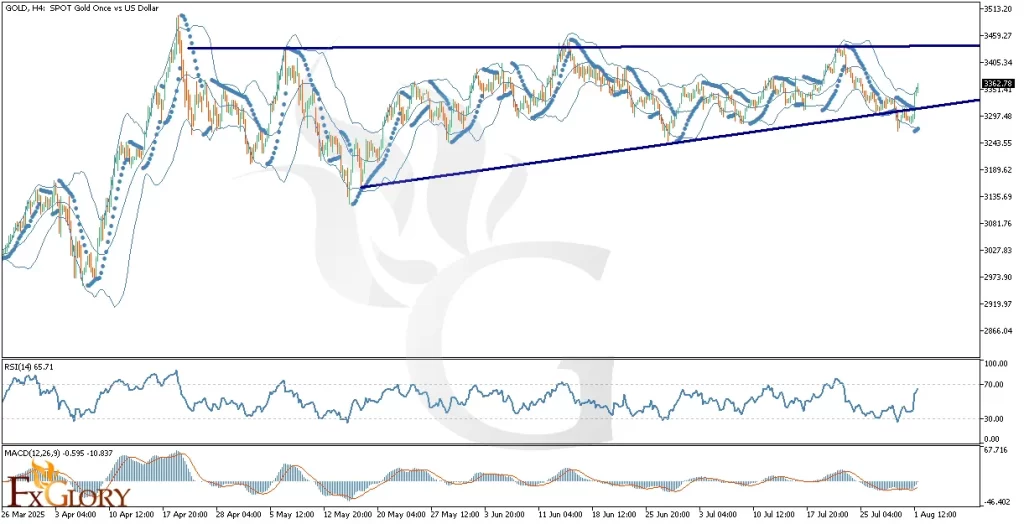
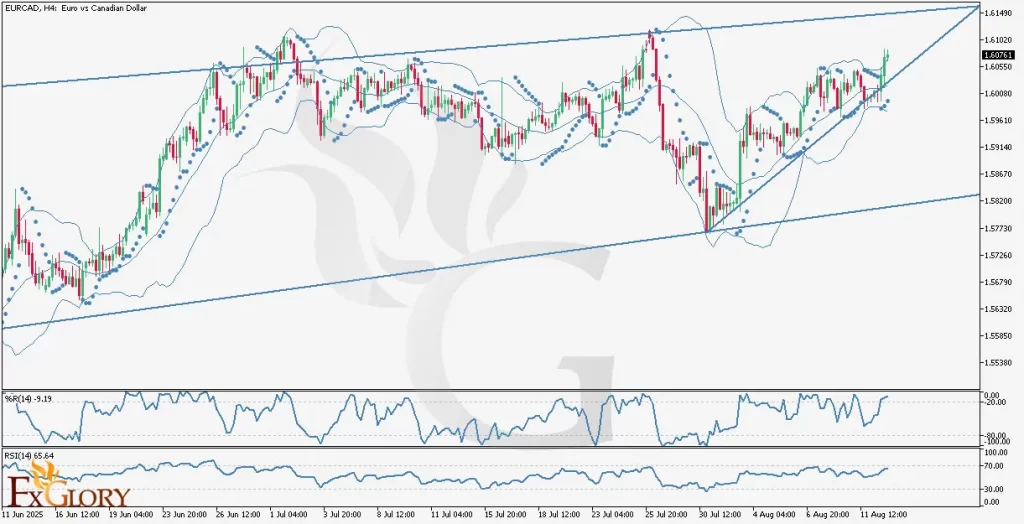
The EUR vs. USD H4 analysis indicates a robust bullish price action. After a prolonged corrective move, price reacted positively to the long-term ascending trendline support, recently breaking above the correction’s resistance line. The clear bullish candle breakout suggests strong bullish momentum. Moreover, given the RSI divergence confirming the bullish strength, the previous swing high before the correction emerges as a probable price target.
Key Technical Indicators:
Parabolic SAR: The Parabolic SAR indicator has shifted below the current price action, confirming bullish momentum. Dots positioned beneath candlesticks indicate a clear upward trend continuation signal for EURUSD on the H4 timeframe.
RSI (Relative Strength Index): RSI stands at approximately 69.36, nearing overbought conditions but notably displaying a bullish divergence against recent price lows. This divergence underlines solid bullish momentum, suggesting potential further gains before significant corrections.
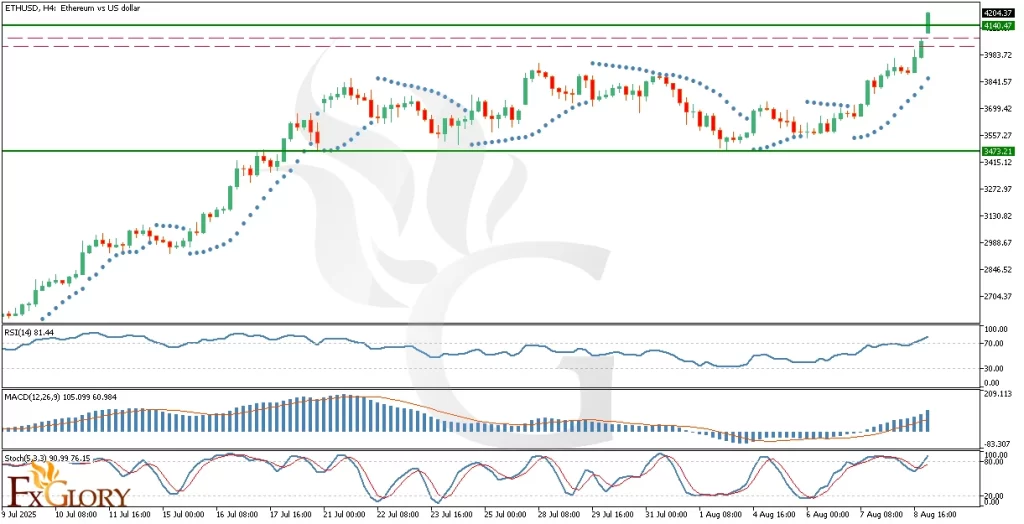
Stochastic Oscillator: The Stochastic Oscillator, currently around 89.99, indicates strongly overbought conditions. Despite this, it continues to reflect bullish strength. Traders should remain vigilant for possible short-term retracements due to overextended price conditions.
Support and Resistance:
Support: Immediate support is located at the recent breakout point near 1.1665, aligning with the ascending trendline support.
Resistance: Initial resistance is observed at the recent swing high around 1.1795; overcoming this level could open the pathway toward higher resistance at approximately 1.1845.
Conclusion and Consideration:
The EUR/USD H4 timeframe technical analysis favors bullish continuation, supported by decisive price action and confirming indicators like RSI divergence and Parabolic SAR signals. Despite strong bullish sentiment, traders should exercise caution considering the overbought signals from the Stochastic oscillator. Upcoming economic releases for EUR and USD warrant careful attention due to their potential to create substantial volatility and directional changes.
Disclaimer: The analysis provided for EUR/USD is for informational purposes only and does not constitute investment advice. Traders are encouraged to perform their own analysis and research before making any trading decisions on EURUSD. Market conditions can change quickly, so staying informed with the latest data is essential.
FXGlory
07.24.2025
Time Zone: GMT +3
Time Frame: 4 Hours (H4)
Fundamental Analysis:
The EUR/USD currency pair today faces key economic indicators from both the Eurozone and the United States, potentially driving volatility. The upcoming releases include consumer sentiment from NIQ, unemployment rates, and several critical PMI readings from S&P Global, expected to significantly impact the EUR’s strength. Similarly, the USD may experience volatility with upcoming PMI data from manufacturing and services sectors and new home sales data. Traders should closely monitor these releases as they provide insight into economic health and consumer confidence, influencing the short-term direction of EUR-USD.
Price Action:
The EUR vs. USD H4 analysis indicates a robust bullish price action. After a prolonged corrective move, price reacted positively to the long-term ascending trendline support, recently breaking above the correction’s resistance line. The clear bullish candle breakout suggests strong bullish momentum. Moreover, given the RSI divergence confirming the bullish strength, the previous swing high before the correction emerges as a probable price target.
Key Technical Indicators:
Parabolic SAR: The Parabolic SAR indicator has shifted below the current price action, confirming bullish momentum. Dots positioned beneath candlesticks indicate a clear upward trend continuation signal for EURUSD on the H4 timeframe.
RSI (Relative Strength Index): RSI stands at approximately 69.36, nearing overbought conditions but notably displaying a bullish divergence against recent price lows. This divergence underlines solid bullish momentum, suggesting potential further gains before significant corrections.
Stochastic Oscillator: The Stochastic Oscillator, currently around 89.99, indicates strongly overbought conditions. Despite this, it continues to reflect bullish strength. Traders should remain vigilant for possible short-term retracements due to overextended price conditions.
Support and Resistance:
Support: Immediate support is located at the recent breakout point near 1.1665, aligning with the ascending trendline support.
Resistance: Initial resistance is observed at the recent swing high around 1.1795; overcoming this level could open the pathway toward higher resistance at approximately 1.1845.
Conclusion and Consideration:
The EUR/USD H4 timeframe technical analysis favors bullish continuation, supported by decisive price action and confirming indicators like RSI divergence and Parabolic SAR signals. Despite strong bullish sentiment, traders should exercise caution considering the overbought signals from the Stochastic oscillator. Upcoming economic releases for EUR and USD warrant careful attention due to their potential to create substantial volatility and directional changes.
Disclaimer: The analysis provided for EUR/USD is for informational purposes only and does not constitute investment advice. Traders are encouraged to perform their own analysis and research before making any trading decisions on EURUSD. Market conditions can change quickly, so staying informed with the latest data is essential.
FXGlory
07.24.2025