What's new

Forex News Daily Analysis By FXGlory

4.70 star(s) 3 Votes
GBP/AUD H4 Technical and Fundamental Analysis for 05.14.2025


GBPAUDH4-FXGlory.png


Time Zone: GMT +3
Time Frame: 4 Hours (H4)


Fundamental Analysis:

GBPAUD is in focus today as markets react to significant economic releases from both the UK and Australia. From the GBP perspective, preliminary GDP figures came in stronger than expected at 0.6% quarter-on-quarter, outperforming forecasts of 0.1%. Manufacturing production and industrial output, however, missed expectations, declining by 0.8% and 0.6%, respectively. Despite a slightly wider goods trade deficit of -£19.7B, improvements in construction output and services index provided mixed signals for the UK economy. On the Australian side, employment data showed robust job growth, adding 20.9K positions against an anticipated 32.2K, with the unemployment rate holding steady at 4.1%. Traders will closely monitor how these mixed data points influence GBPAUD's direction, watching for potential shifts in sentiment or confirmation of the pair’s near-term momentum.


Price Action:
The GBPAUD pair on the H4 timeframe has recently shifted to a bearish structure, evidenced by the clear break and sustained movement below the 200-period moving average. The recent series of strong bearish candles highlights increased selling pressure, suggesting market sentiment has turned negative. This downward move follows an extended phase of consolidation around the moving average, indicating that sellers have gained decisive control. If the price continues to sustain this bearish momentum and clearly breaks below recent support levels, it could lead to further declines and solidify the bearish trend.


Key Technical Indicators:
100-period Moving Average (MA100):
The GBPAUD price is currently trading below the 100-period moving average (blue line), confirming that the overall market sentiment remains bearish. This moving average has acted consistently as dynamic resistance, suppressing bullish attempts and reinforcing downward momentum. A sustained break above this moving average would signal a weakening of bearish control and potentially mark the beginning of a bullish reversal.
MACD Indicator: The MACD histogram remains below the zero line, signaling ongoing bearish momentum. However, the histogram bars have begun to shorten, indicating a possible weakening in bearish strength and hinting at the potential for a bullish crossover. Traders should closely watch the MACD line for any bullish crossover above the signal line, as this could further validate a potential reversal scenario.


Support and Resistance:
Support:
The nearest resistance lies near 2.06880, aligned with the 100-period moving average, which continues to act as a dynamic ceiling. A clear break above this could lead the price toward the next key resistance zone around 2.07600.
Resistance: The nearest resistance lies near 2.06880, aligned with the 100-period moving average, which continues to act as a dynamic ceiling. A clear break above this could lead the price toward the next key resistance zone around 2.07600.


Conclusion and Consideration:
In conclusion, the GBPAUD pair is currently facing bearish pressure both technically and fundamentally. Despite better-than-expected UK GDP figures, mixed economic signals and robust employment data from Australia create uncertainty regarding future direction. Technically, price action confirms increased selling momentum with key moving averages acting as resistance, and MACD indicating potential for bearish momentum to weaken. Traders should closely monitor the pair’s reaction near critical support at 2.05650 and resistance around 2.06880 for clear directional cues, which could either confirm a continuation of the bearish trend or signal a possible bullish reversal.


Disclaimer: The analysis provided for GBP/AUD is for informational purposes only and does not constitute investment advice. Traders are encouraged to perform their own analysis and research before making any trading decisions on GBPAUD Market conditions can change quickly, so staying informed with the latest data is essential.


FXGlory
05.14.2025
 
GBP/USD Technical and Fundamental Analysis for 05.15.2025


GBPUSD_H4_Technical_and_fundamental_analysis_for_05_15_2025.png


Time Zone: GMT +3
Time Frame: 4 Hours (H4)


Fundamental Analysis:

The GBPUSD currency pair will experience heightened volatility today due to significant economic events from both the UK and the US. Traders will closely monitor the UK's GDP release, Manufacturing Production, and Trade Balance figures, which will reflect the overall health of the UK economy and may influence GBP strength. For the US, numerous crucial indicators such as PPI, Retail Sales, Initial Jobless Claims, and speeches by Fed officials Mary Daly and Jerome Powell could provide significant insights into future US monetary policy. More hawkish tones from these speeches or stronger-than-expected economic data would likely boost the USD, potentially placing downward pressure on the GBPUSD pair.


Price Action:
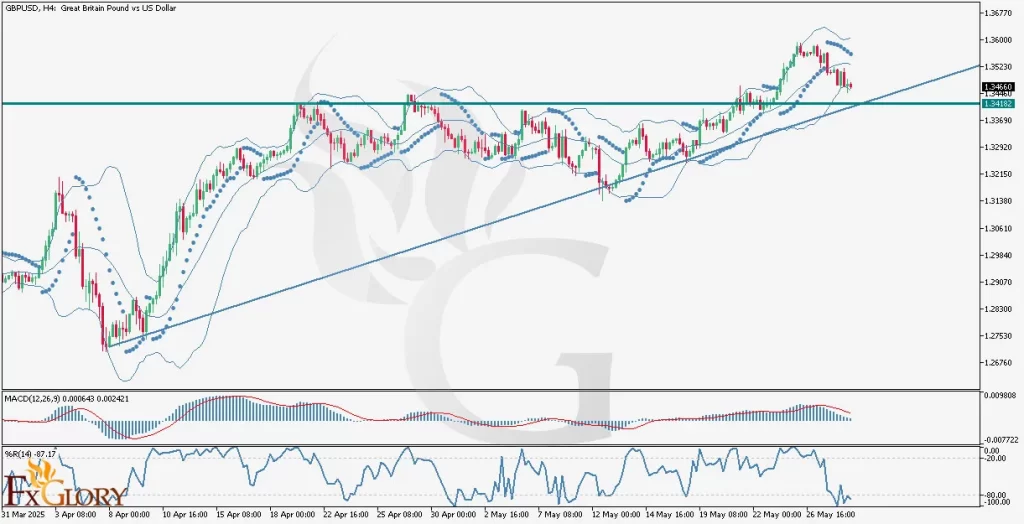
The GBP-USD pair on the H4 chart recently pulled back from the upper Bollinger Band, retreating to test the middle Bollinger Band. This mid-band area acts as critical immediate support, and a failure here might see the pair challenging the ascending trendline near the 1.31735 level. Should this key trendline fail to hold, a deeper correction towards the psychological support at 1.30038 might be seen. Conversely, bullish recovery above the mid-band may drive the price to retest the major resistance at 1.34331.


Key Technical Indicators:
Bollinger Bands:
The Bollinger Bands for GBP/USD are currently converging, indicating reduced volatility and a potential upcoming breakout. The price reacted from the upper band and is testing support at the middle band. A decisive break below the middle band could signal increased bearish momentum.
Parabolic SAR: The Parabolic SAR dots have recently switched below the price, signaling a potential bullish reversal on this timeframe. However, traders should remain cautious and confirm this bullish signal with price action.
RSI (Relative Strength Index): A divergence between price action and RSI is evident, with RSI making lower highs while the price recently made higher highs, suggesting weakening bullish momentum and potential bearish reversal ahead.
Stochastic Oscillator: The stochastic oscillator is approaching oversold conditions, currently at 9.11 and 29.76. This suggests that a short-term bounce might occur soon if the price finds support, potentially limiting immediate downside risk.


Support and Resistance:
Support:
Immediate support is located at 1.31735, aligning with the ascending trendline and previous price action area. The next significant support lies at the psychological level of 1.30038, historically significant for price reversals.
Resistance: Immediate resistance stands at the recent swing high at 1.34331, representing a critical barrier for bulls to overcome for continued upward momentum.


Conclusion and Consideration:
The GBP-USD H4 technical and fundamental daily chart analysis reveals a critical juncture for the pair. Current indicators suggest mixed signals, indicating caution in both directions. Traders should pay close attention to today's economic events and news releases, as significant volatility is anticipated. Proper risk management and close monitoring of price action around key levels and economic announcements are strongly recommended.


Disclaimer: The analysis provided for GBP/USD is for informational purposes only and does not constitute investment advice. Traders are encouraged to perform their own analysis and research before making any trading decisions on GBPUSD Market conditions can change quickly, so staying informed with the latest data is essential.


FXGlory
05.15.2025
 
NZDUSD Daily Technical and Fundamental Analysis for 05.16.2025


Time Zone: GMT +3
Time Frame: 4 Hours (H4)


Fundamental Analysis:

Today's fundamental outlook for NZDUSD is marked by critical economic data from both New Zealand and the United States. On the USD side, traders will closely monitor the release of Residential Building Permits and Housing Starts, indicators that reflect the health of the U.S. housing market. Additionally, the Import Price Index will provide early inflation insights, while the University of Michigan’s Consumer Sentiment and Inflation Expectations data may affect market sentiment toward the USD. Moreover, Richmond Fed President Thomas Barkin’s speech will be scrutinized for insights into future Fed monetary policy. In New Zealand, traders will pay attention to BusinessNZ’s Performance of Manufacturing Index (PMI), which could indicate economic expansion or contraction and influence the NZD’s strength.


Price Action:
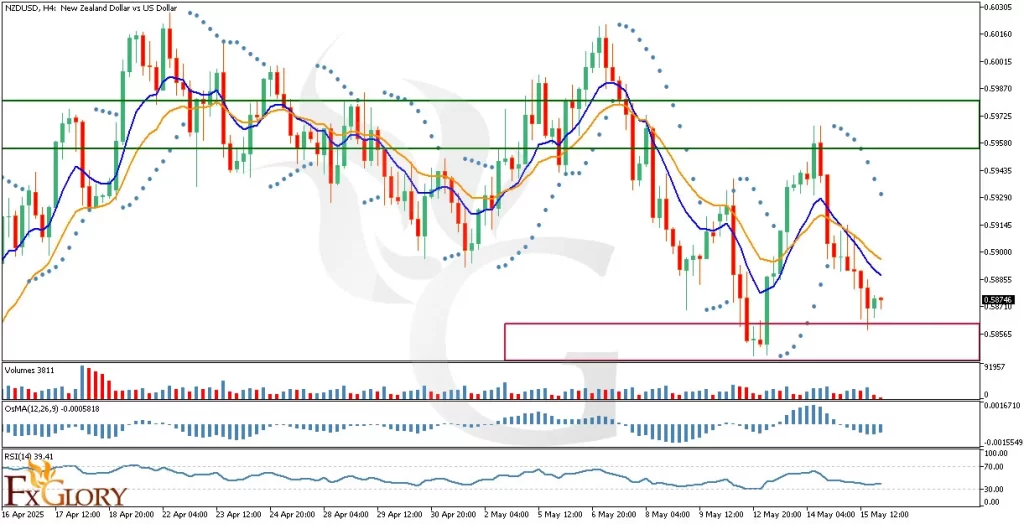
Analyzing the NZD/USD pair on the H4 timeframe indicates a clear bearish trend through recent price action. The market has consistently formed lower highs and lower lows, confirming ongoing selling pressure. The most recent candles display bearish momentum, with price action struggling to break above moving average resistances, and continuously testing support near recent lows. The candlestick patterns suggest the bears remain in control, albeit with some hesitance approaching the immediate support area.


Key Technical Indicators:
Parabolic SAR:
The Parabolic SAR indicator distinctly illustrates the bearish sentiment as its last 8 dots have consistently been placed above the price candles. This alignment signals continuing downward pressure and indicates that sellers are maintaining their dominance, suggesting further bearish continuation is likely unless a bullish reversal is clearly established.
Moving Averages (MA 9 & MA 17): The moving averages confirm the bearish scenario; the short-term MA (9, blue line) recently crossed below the longer-term MA (17, orange line), a classic bearish crossover indicating continued selling pressure. As the price remains below both MAs, bearish momentum remains strong and intact.
Volumes: The Volumes indicator is showing decreased buying activity with slightly increasing volume on bearish candles, signifying stronger selling pressure at current price levels. This suggests that bearish sentiment persists, with market participants leaning towards further downside movements.
OsMA (Moving Average of Oscillator): The OsMA indicator currently shows bars below the zero line and increasing in negative magnitude, reflecting growing bearish momentum. Such negative divergence reinforces the potential for further downward movement, indicating sellers are likely to maintain control in the short term.
RSI (Relative Strength Index): The RSI is currently at 39.41, trending downward but not yet in oversold territory. This signifies that while the bearish sentiment is clearly strong, the pair still has room to continue falling before becoming oversold, which would signal caution for potential reversals or consolidation.


Support and Resistance:
Support:
Immediate support is identified at the 0.58585-0.58710 zone, a critical area where recent lows have formed.
Resistance: The nearest resistance levels are at 0.59350 and subsequently at 0.59750, where previous swing highs and consolidation phases occurred.


Conclusion and Consideration:
The NZD USD H4 chart analysis continues to reflect a bearish trend, supported strongly by the Parabolic SAR, moving averages crossover, and negative OsMA. Traders should consider short positions, particularly if the immediate support at 0.58585 is breached with conviction. However, caution is advised ahead of significant fundamental news today from both NZD and USD, as these events could trigger increased volatility and potential reversals or corrective moves.


Disclaimer: The analysis provided for USD/NZD is for informational purposes only and does not constitute investment advice. Traders are encouraged to perform their own analysis and research before making any trading decisions on USDNZD. Market conditions can change quickly, so staying informed with the latest data is essential.


FXGlory
05.16.2025
 
USD/CAD H4 Technical and Fundamental Analysis for 05.20.2025


Time Zone: GMT +3
Time Frame: 4 Hours (H4)


Fundamental Analysis:

Today, market participants are closely monitoring the Canadian CPI (Consumer Price Index) data release, a critical inflation indicator expected to influence the Canadian Dollar significantly. Higher-than-forecast CPI figures usually strengthen the CAD, reflecting potential rate hikes by the Bank of Canada aimed at combating inflation. Additionally, several Federal Reserve members, including Barkin, Bostic, and Musalem, are scheduled to speak. Hawkish remarks from these members could potentially bolster the USD by signaling tighter monetary policy ahead.


Price Action:
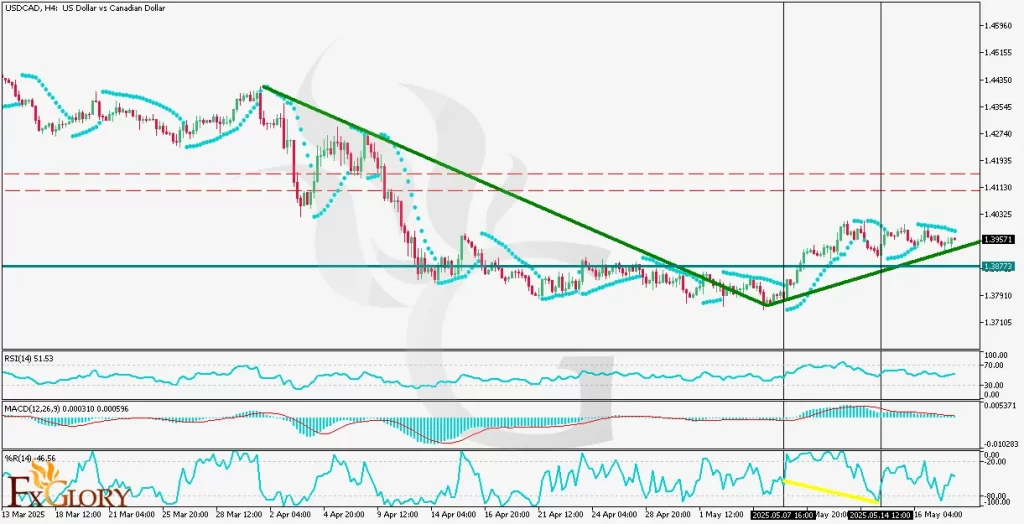
The USD-CAD currency pair on the H4 chart has recently initiated an upward trend after forming a noticeable bottom. The pair is approaching a critical resistance zone, and given its recent momentum, it may encounter difficulty surpassing this level on its initial attempt. Notably, a bullish divergence is observed between the price and RSI lows, suggesting underlying bullish strength. The current price rests on a supportive ascending trend line, reinforcing potential continuation of the upward movement.


Key Technical Indicators:
Parabolic SAR:
The Parabolic SAR indicator currently shows bullish momentum, with dots positioned below the price bars, affirming continued buying interest and upward potential.
RSI (Relative Strength Index): The RSI value stands at 51.53, indicating a neutral market condition. However, a visible bullish divergence between price lows and RSI lows highlights increasing upward momentum, which supports the bullish scenario.
MACD (Moving Average Convergence Divergence): The MACD histogram reflects decreasing bullish momentum, suggesting caution. Although still above zero, the potential for a bearish crossover should be closely monitored, signaling a possible short-term reversal or consolidation.
Williams %R: The Williams %R indicator is at -46.56, indicating balanced market conditions without clear overbought or oversold signals. However, it confirms the upward trajectory with room for further price advancement before reaching an overbought scenario.


Support and Resistance:
Support:
Immediate support is located at 1.38723, aligning with the current ascending support trend line and recent price consolidation.
Resistance: The nearest resistance level is at 1.40250-1.41000, coinciding with historical highs and significant selling interest.


Conclusion and Consideration:
The USDCAD H4 analysis suggests an ongoing bullish bias, supported by technical indicators and recent price action behavior. While immediate resistance could temporarily hinder the bullish movement, underlying momentum indicators, notably the RSI divergence, favor an eventual upward breakout. Traders should cautiously watch today's Canadian CPI data and Fed members' speeches for significant volatility that could rapidly shift market sentiment and affect the USD/CAD price action.


Disclaimer: The analysis provided for USD/CAD is for informational purposes only and does not constitute investment advice. Traders are encouraged to perform their own analysis and research before making any trading decisions on USDCAD. Market conditions can change quickly, so staying informed with the latest data is essential.


FXGlory
05.20.2025
 
EUR/USD H4 Technical and Fundamental Analysis for 05.21.2025


EURUSDH4-FXG.png


Time Zone: GMT +3
Time Frame: 4 Hours (H4)


Fundamental Analysis:

Today, attention in the currency markets is turning toward several key developments that could influence the EUR/USD pair. The European Central Bank is set to release its Financial Stability Review, a biannual report that provides insights into potential risks to the euro area’s financial system. Any signs of increased vulnerabilities or a more cautious tone could weigh on the euro. Additionally, the German 10-year bond auction, with a yield of 2.47% and a bid-to-cover ratio of 1.4, offers further clues about investor confidence and demand for euro-denominated debt. On the U.S. side, crude oil inventory data is due, with a sharp drawdown of -0.9 million barrels expected compared to the previous build of 3.5 million. A larger-than-anticipated decline could support the U.S. dollar by reflecting stronger demand or supply disruptions. Furthermore, remarks from FOMC members Barkin and Bowman are scheduled later in the day. Should their comments lean hawkish, market participants may anticipate continued policy tightening, potentially boosting the USD against the euro.


Price Action:
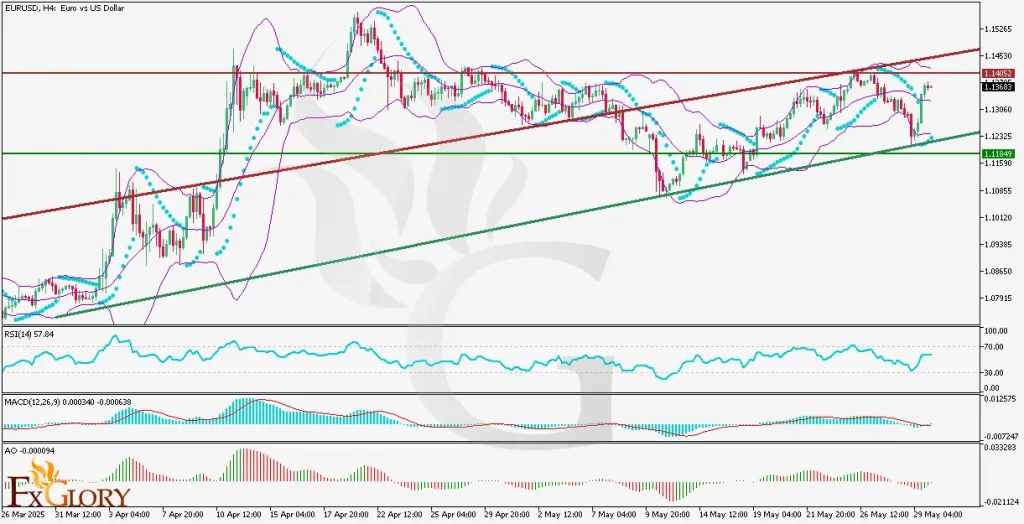
The EUR-USD currency pair on the H4 chart has recently initiated an upward trend after forming a noticeable bottom. The pair is approaching a critical resistance zone, and given its recent momentum, it may encounter difficulty surpassing this level on its initial attempt. Notably, a bullish divergence is observed between the price and RSI lows, suggesting underlying bullish strength. The current price rests on a supportive ascending trend line, reinforcing potential continuation of the upward movement.


Key Technical Indicators:
RSI (Relative Strength Index):
The RSI currently reads 62.47, indicating strengthening bullish momentum as it approaches the overbought zone. This upward movement reflects increasing buying interest, aligning with the recent breakout above the descending channel. The sustained rise in RSI suggests that bulls are gaining control, and further upside could be expected if momentum continues.
MACD (Moving Average Convergence Divergence): The MACD shows a bullish crossover, with the MACD line moving above the signal line and histogram bars turning positive. This crossover confirms a shift in momentum from bearish to bullish, reinforcing the potential for continued upward price action following the breakout.


Support and Resistance:
Support:
Immediate support is seen near 1.12250, aligning closely with the upper boundary of the recently broken descending channel. This level now acts as a potential retest zone, offering a key area where bulls may seek to defend the breakout and confirm a trend reversal.
Resistance: The nearest resistance is located at 1.13125, which marks a critical horizontal level and coincides with a previous swing high. A decisive break above this area would likely signal stronger bullish control and could open the path for further upside momentum.


Conclusion and Consideration:
In summary, the EUR/USD pair is currently at a pivotal juncture, with both fundamental and technical factors aligning to suggest a potential shift in market direction. From a fundamental perspective, upcoming eurozone and U.S. events—such as the ECB’s Financial Stability Review and comments from FOMC members—could inject volatility and guide near-term sentiment. On the technical front, the pair’s breakout above a long-standing descending channel, supported by bullish signals from both RSI and MACD indicators, points to growing upward momentum. The immediate support at 1.12250 and the key resistance at 1.13125 will be critical levels to watch. A sustained move above resistance could validate the bullish reversal and set the stage for further gains, while a failure to hold above support may call the breakout into question.


Disclaimer: The analysis provided for EUR/USD is for informational purposes only and does not constitute investment advice. Traders are encouraged to perform their own analysis and research before making any trading decisions on EURUSD. Market conditions can change quickly, so staying informed with the latest data is essential.


FXGlory
05.21.2025
 
GBP/USD Daily Technical and Fundamental Analysis for 05.23.2025


Time Zone: GMT +3
Time Frame: 4 Hours (H4)


Fundamental Analysis:

Today's economic calendar for GBPUSD highlights several important news events that could significantly impact the pair's volatility. From the UK, traders are watching the NIQ consumer confidence data and the Office for National Statistics' retail sales figures, both crucial indicators of economic health and consumer spending trends. Stronger-than-expected data could provide bullish momentum for GBP. Conversely, the USD is influenced by several speeches from Federal Reserve officials, including President Alberto Musalem, Jeffrey Schmid, and Governor Lisa Cook. Their remarks on monetary policy and economic stability could notably affect USD strength, especially if they adopt a more hawkish tone.


Price Action:
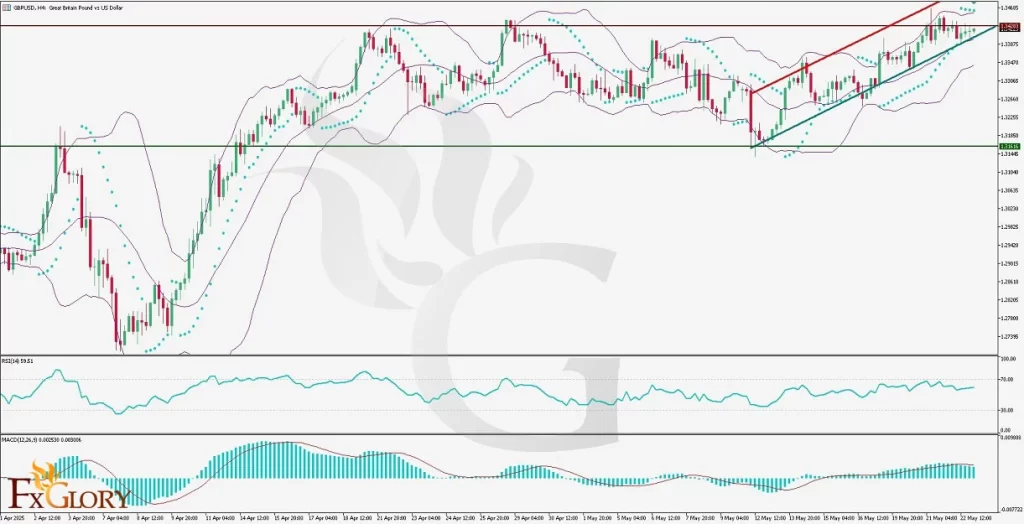
Analyzing GBP-USD in the H4 timeframe shows recent price action forming an ascending channel. After successfully pulling back to a previously broken resistance line (now acting as support), GBP/USD price is currently approaching a critical horizontal resistance level. The price action is slightly consolidative, indicating indecision as the price interacts with this level. Traders should watch closely for a clear break above resistance or a potential breakdown below channel support to confirm future price direction.


Key Technical Indicators:
Parabolic SAR:
The Parabolic SAR dots remain below the price candles, supporting a bullish bias. This suggests that, for now, buyers still have control, though a reversal could be imminent if dots shift above the price.
Bollinger Bands: Bollinger Bands are moderately wide, signaling moderate volatility. The price is trading near the upper band, indicating bullish momentum, but also cautioning a potential reversal or consolidation due to possible overextension.
RSI (Relative Strength Index): The RSI indicator currently stands at around 59, which indicates bullish sentiment but still has space to advance before reaching overbought territory. This suggests bullish momentum might continue in the short term.
MACD (Moving Average Convergence Divergence): The MACD histogram displays slightly weakening bullish momentum, with decreasing bar sizes. Although the MACD line remains above the signal line, traders should watch for a potential bearish crossover signaling weakening buying pressure.


Support and Resistance:
Support:
The immediate key support is at 1.3185, coinciding with the lower boundary of the ascending channel and recent price action pullback.
Resistance: Major resistance is evident at the horizontal level of 1.3465, closely aligned with the channel's upper boundary. A break above this resistance could trigger a strong bullish continuation.


Conclusion and Consideration:
GBPUSD on the H4 timeframe maintains a cautiously bullish outlook. While price action is positive, caution is advised given the resistance overhead and weakening MACD momentum. Upcoming fundamental news from both the UK and US could provide strong catalysts for GBP-USD’s next significant move. Traders should stay alert for the market reactions to economic releases and central bank speeches, which could alter the current technical landscape considerably.


Disclaimer: The analysis provided for GBP/USD is for informational purposes only and does not constitute investment advice. Traders are encouraged to perform their own analysis and research before making any trading decisions on GBPUSD. Market conditions can change quickly, so staying informed with the latest data is essential.


FXGlory
05.23.2025
 
ETH/USD Daily Technical and Fundamental Analysis for 05.26.2025


Time Zone: GMT +3
Time Frame: 4 Hours (H4)


Fundamental Analysis:

Today, the ETHUSD pair could experience lower liquidity and irregular volatility due to the US banks being closed for Memorial Day. Historically, when banks are closed, the market becomes less liquid, and speculative activities tend to increase, causing potential abnormal volatility levels. Ethereum’s fundamental outlook remains dependent on general crypto market sentiment and developments, including regulatory announcements and technological updates on the Ethereum blockchain.


Price Action:
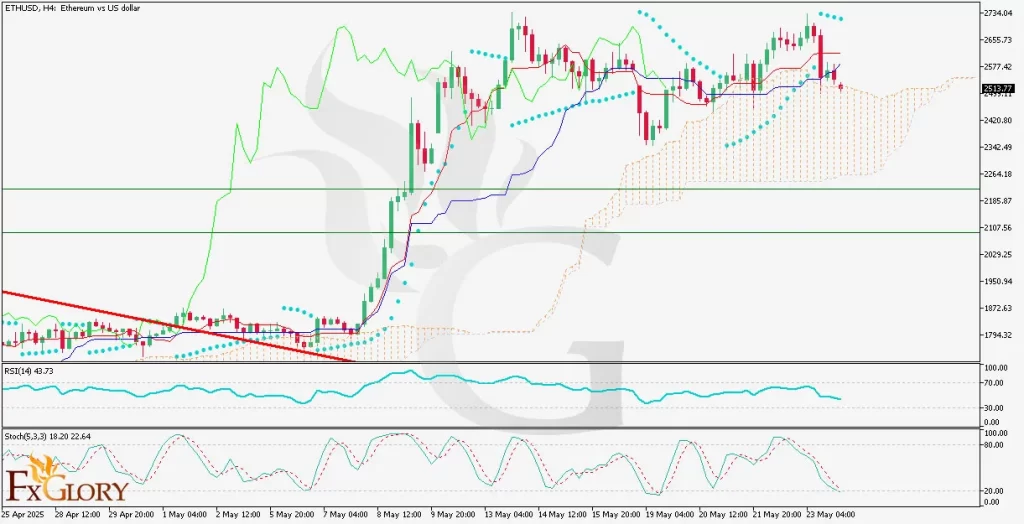
ETH-USD price action on the H4 timeframe recently broke a significant downtrend line, signaling a transition from bearish to bullish sentiment. After this breakout, ETHUSD exhibited a bullish rally followed by a correction phase, currently testing the Ichimoku cloud region. The pullback towards a previously broken level indicates potential support around that area, setting the stage for another bullish leg if buyers step back in.


Key Technical Indicators:
Ichimoku Cloud:
ETH USD is testing the upper boundary of the Ichimoku Cloud, indicating a critical juncture. A clear rebound off this area would validate bullish strength, while breaking deeper into the cloud could hint at bearish momentum returning.
Parabolic SAR: The indicator has recently shifted above the candlesticks, suggesting current short-term bearish pressure. Traders should await a reversal below the candlesticks to confirm a resumption of bullish momentum.
RSI (Relative Strength Index): The RSI is currently at 43.73, highlighting neutral market conditions with no immediate indication of overbought or oversold status. This provides room for price movement in either direction.
Stochastic Oscillator: The Stochastic is in oversold territory (18.20, 22.64), suggesting potential upward movement soon. Traders should watch for a bullish crossover as a confirmation signal for entering long positions.


Support and Resistance:
Support:
Immediate support is at 2420, aligning with the Ichimoku cloud’s upper boundary and previous structural support. The next significant support is around 2260.
Resistance: Immediate resistance is located at 2655, with a stronger resistance level noted at the recent high of 2734.


Conclusion and Consideration:
ETH/USD H4 analysis indicates the potential continuation of bullish momentum following the recent correction to the previously broken resistance (now support). However, traders must monitor price behavior closely within the Ichimoku cloud. Given today's US bank holiday, irregular volatility and low liquidity could affect market conditions, making it essential to maintain tight risk management.


Disclaimer: The analysis provided for ETH/USD is for informational purposes only and does not constitute investment advice. Traders are encouraged to perform their own analysis and research before making any trading decisions on ETHUSD. Market conditions can change quickly, so staying informed with the latest data is essential.


FXGlory
05.26.2025
 

Create an account or login to comment

You must be a member in order to leave a comment

Create account

Create an account on our community. It's easy!

Log in

Already have an account? Log in here.

Similar threads

Users Who Are Viewing This Thread (Total: 2, Members: 0, Guests: 2)

Top
AdBlock Detected

We get it, advertisements are annoying!

Sure, ad-blocking software does a great job at blocking ads, but it also blocks useful features of our website. For the best site experience please disable your AdBlocker.

I've Disabled AdBlock    No Thanks