Capitalcore
Member
Technical Correction or Bullish Resumption for GBP USD
GBP/USD, commonly referred to as "Cable," is one of the most widely traded forex pairs globally. It represents the British Pound against the US Dollar and is known for its volatility and liquidity. Today, fundamental analysis highlights key economic events influencing both currencies. For GBP, the British Retail Consortium (BRC) price data release and a speech by Bank of England MPC Member Catherine Mann could impact sentiment, especially if the BRC figures indicate rising inflation or if Mann hints at a more hawkish monetary stance. On the USD side, speeches from Federal Reserve officials John Williams and Thomas Barkin, combined with reports on Durable Goods Orders and housing indices, could drive volatility—particularly if hawkish tones or stronger-than-expected economic data emerge, supporting the dollar's strength.

Chart Notes:
• Chart time-zone is UTC (+03:00)
• Candles’ time-frame is 4h.
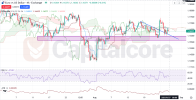
Analyzing the GBP/USD H4 chart reveals an overall bullish trend currently undergoing a bearish correction. The recent price action suggests the correction phase might have concluded, with prices stabilizing around the 0.236 Fibonacci expansion level. If bullish momentum resumes, targets at 0.382 or 0.5 Fibonacci levels are likely. However, continued bearish pressure could see the pair testing support around the historically significant 1.33989 level. Ichimoku analysis indicates a flat Senkou Span B above current candles, suggesting possible consolidation. MACD shows the histogram at 0.00058, with the MACD line just above zero at 0.00007 and the signal line at -0.00051, implying tentative bullish signals. Meanwhile, the RSI hovers near neutral at 46.33, indicating market indecision.
•DISCLAIMER: Please note that the above analysis is not an investment suggestion by “Capitalcore LLC”. This post has been published only for educational purposes.
Capitalcore
GBP/USD, commonly referred to as "Cable," is one of the most widely traded forex pairs globally. It represents the British Pound against the US Dollar and is known for its volatility and liquidity. Today, fundamental analysis highlights key economic events influencing both currencies. For GBP, the British Retail Consortium (BRC) price data release and a speech by Bank of England MPC Member Catherine Mann could impact sentiment, especially if the BRC figures indicate rising inflation or if Mann hints at a more hawkish monetary stance. On the USD side, speeches from Federal Reserve officials John Williams and Thomas Barkin, combined with reports on Durable Goods Orders and housing indices, could drive volatility—particularly if hawkish tones or stronger-than-expected economic data emerge, supporting the dollar's strength.

Chart Notes:
• Chart time-zone is UTC (+03:00)
• Candles’ time-frame is 4h.
Analyzing the GBP/USD H4 chart reveals an overall bullish trend currently undergoing a bearish correction. The recent price action suggests the correction phase might have concluded, with prices stabilizing around the 0.236 Fibonacci expansion level. If bullish momentum resumes, targets at 0.382 or 0.5 Fibonacci levels are likely. However, continued bearish pressure could see the pair testing support around the historically significant 1.33989 level. Ichimoku analysis indicates a flat Senkou Span B above current candles, suggesting possible consolidation. MACD shows the histogram at 0.00058, with the MACD line just above zero at 0.00007 and the signal line at -0.00051, implying tentative bullish signals. Meanwhile, the RSI hovers near neutral at 46.33, indicating market indecision.
•DISCLAIMER: Please note that the above analysis is not an investment suggestion by “Capitalcore LLC”. This post has been published only for educational purposes.
Capitalcore


