What's new

Forex News Daily Market Analysis By FXOpen

4.00 star(s) 11 Votes
ETHUSD and LTCUSD Technical Analysis – 03rd NOV, 2022


ETHUSD: Bullish Engulfing Pattern Above $1483

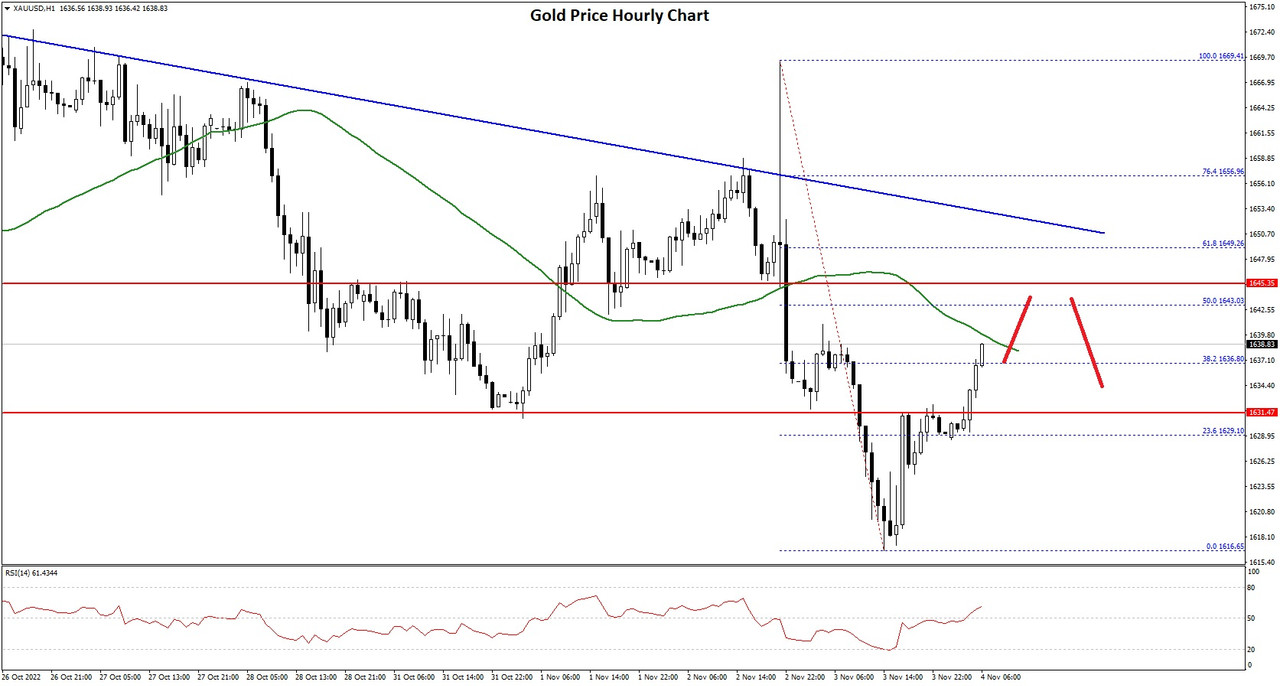
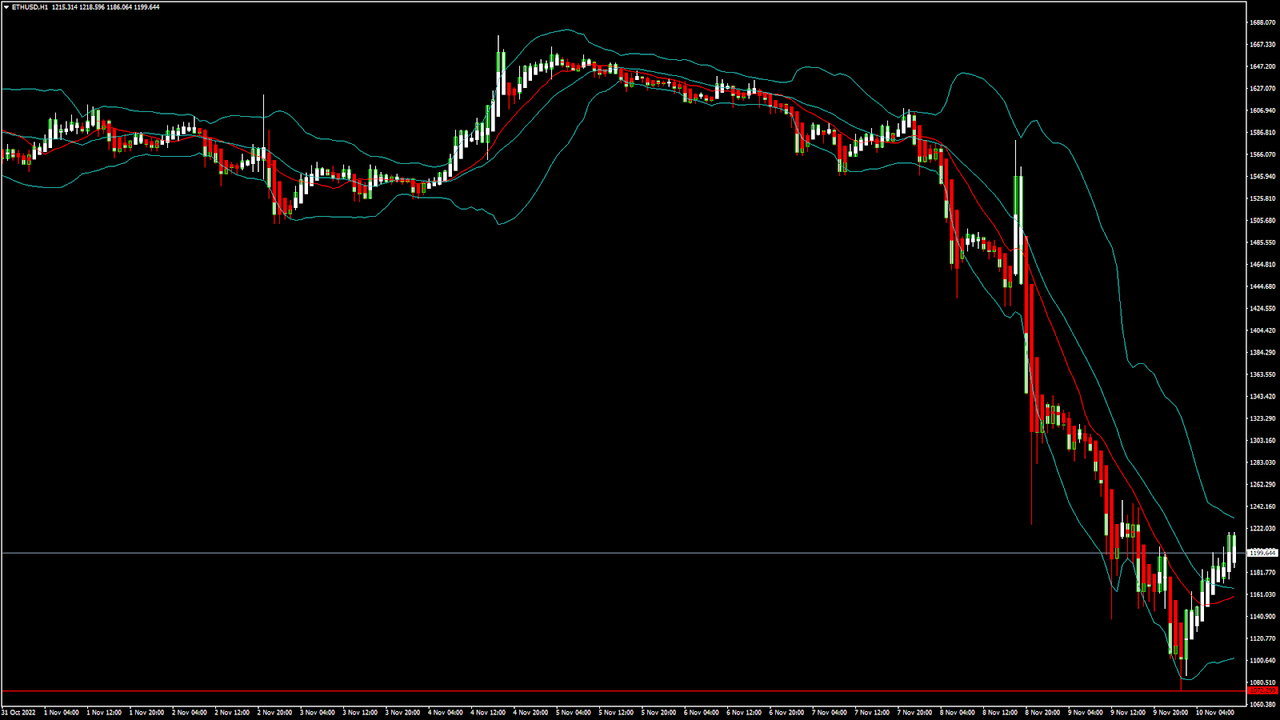
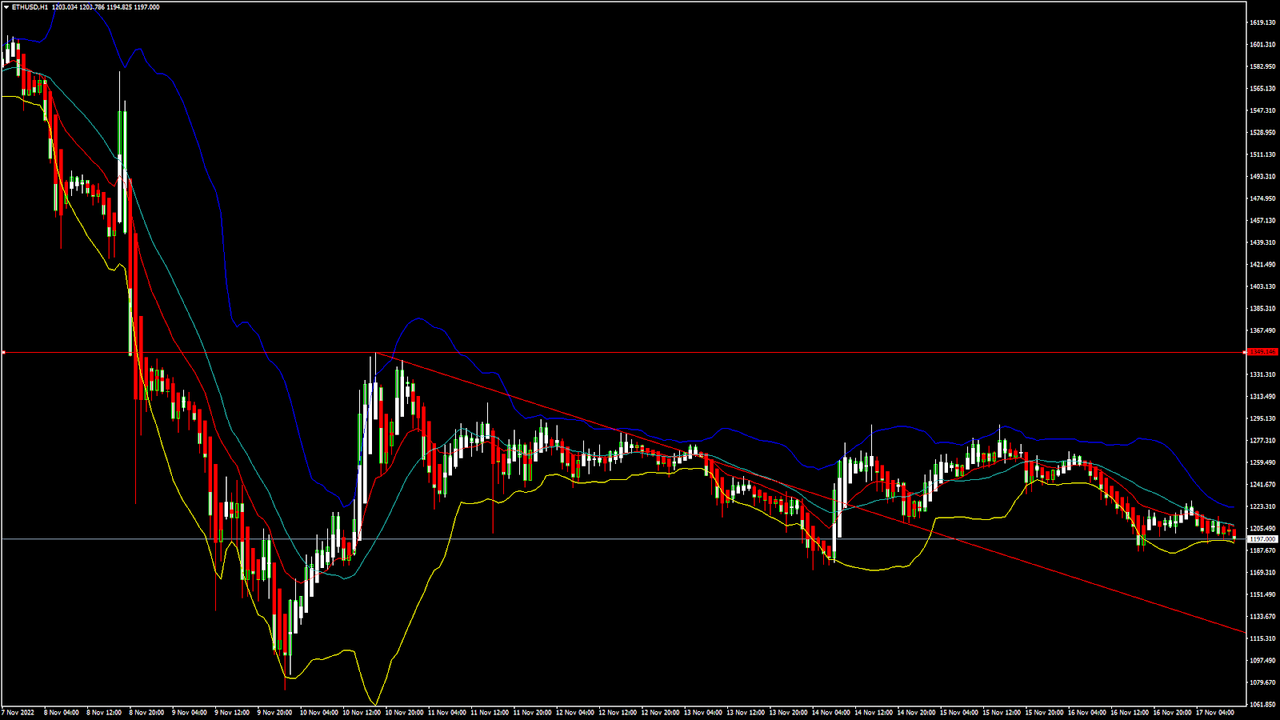
Ethereum was unable to sustain its bearish momentum and after touching a low of 1488 on 28th Oct, the prices started to correct upwards against the US dollar. The prices of Ethereum touched a high of 1642 on 29th Oct after which we can see a shift towards the consolidation phase in the markets.

We can see that the MACD indicator is giving a bullish divergence signal in the 4-hour time frame

We can clearly see a bullish engulfing pattern above the $1483 handle which is a bullish pattern and signifies the end of a bearish phase and the start of a bullish phase in the markets.

ETH is now trading just above its pivot level of 1544 and is moving into a mildly bullish channel. The price of ETHUSD is now testing its classic resistance levels of 1548 and Fibonacci resistance level of 1552 after which the path towards 1600 will get cleared.

The relative strength index is at 48 indicating a neutral market and the shift towards a correction and consolidation phase in the markets.

We can see that the commodity channel index is giving a neutral signal which indicates a range bound movement for some time in the markets.

The STOCHRSI is indicating an overbought market, which means that the prices are expected to decline in the short-term range.

Some of the technical indicators are giving a BUY market signal.

Some of the moving averages are giving a BUY signal and we are now looking at the levels of $1650 to $1700 in the short-term range.

ETH is now trading below both its 100 & 200 hourly simple and exponential moving averages.

  • Ether: bullish reversal seen above the $1483 mark
  • The short-term range appears to be mildly bullish
  • ETH continues to remain above the $1500 levels
  • The average true range is indicating LESS market volatility

Ether: Bullish Reversal Seen Above $1254


ETHUSD is now moving into a mildly bullish channel with the prices trading above the $1500 handle in the European trading session today.

ETH touched an intraday low of 1502 in the Asian trading session and an intraday low of 1558 in the European trading session today.

The RSI indicator is back over 50 indicating a bullish scenario.

We can see a bullish price crossover pattern with moving averages MA20 and MA100.

We can also see the formation of a bullish harami pattern in both the 2-hour and 4-hour time frames.

The MA20 is also indicating a bullish trend reversal signal in the weekly timeframe.

The daily RSI is printing at 60 indicating a strong demand for Ether in the long-term range.

The key support level to watch is $1427 which is a 50% retracement from a 4-week high/low and 1482 which is a 38.2% retracement from 4 week high/low.

ETH has decreased by 0.70% with a price change of 11.14$ in the past 24hrs and has a trading volume of 22.835 billion USD.

We can see an increase of 53.42% in the total trading volume in the last 24 hrs which is due to the continued buying seen at lower levels.

The Week Ahead

ETH price continues to remain in a bullish zone against the US dollar and bitcoin. ETHUSD is expected to move higher towards the $1600 and $1700 levels this week.

We can see the formation of a major bullish trendline in place from $1483 towards $1640 level.

The immediate short-term outlook for Ether has turned mildly bullish, the medium-term outlook has turned neutral, and the long-term outlook for Ether is neutral at present market conditions.

The prices of ETHUSD will need to remain above the important support level of $1513 which is a 38.2% retracement from 13-week low.

Weekly outlook is projected at $1750 with a consolidation zone of $1650.

Technical Indicators:

The STOCH (9,6): is at 77.85 indicating a BUY.

The rate of price change: is at 0.983 indicating a BUY.

The bull/bear power (13): is at 4.55 indicating a BUY.

High/lows(14): is at 9.01 indicating a BUY.

VIEW FULL ANALYSIS VISIT - FXOpen Blog...

Disclaimer: CFDs are complex instruments and come with a high risk of losing your money.
 
Gold Price Recovers While Crude Oil Price Aims Upside Break


Gold price started an upside correction from the $1,615 zone. Crude oil price is rising and might clear the $90 resistance zone.

Important Takeaways for Gold and Oil

  • Gold price found support near the $1,616 level and corrected higher against the US Dollar.
  • There is a key bearish trend line forming with resistance near $1,650 on the hourly chart of gold.
  • Crude oil price is showing positive signs above the $87.20 support zone.
  • There was a break below a connecting bullish trend line with support near $88.30 on the hourly chart of XTI/USD.

Gold Price Technical Analysis

Gold price failed to gain strength for a move above the $1,665 resistance against the US Dollar. The price started a fresh decline and traded below the $1,650 support level.

There was a clear move below the $1,635 support zone and the 50 hourly simple moving average. The price traded as low as $1,616 on FXOpen and recently there was a recovery wave. The price was able to clear the $1,630 resistance zone.

Gold Price Hourly Chart


The price even climbed above the 38.2% Fib retracement level of the downward move from the $1,669 swing high to $1,616 low. It is now facing resistance near the $1,640 level and the 50 hourly simple moving average.

The first major resistance is near the $1,644 level. It is near the 50% Fib retracement level of the downward move from the $1,669 swing high to $1,616 low.

There is also a key bearish trend line forming with resistance near $1,650 on the hourly chart of gold. The main resistance is now forming near the $1,655 level, above which it could even test $1,670. A clear upside break above the $1,670 resistance could send the price towards $1,700.

An immediate support on the downside is near the $1,630 level. The next major support is near the $1,620 level, below which there is a risk of a larger decline. In the stated case, the price could decline sharply towards the $1,600 support zone.

VIEW FULL ANALYSIS VISIT - FXOpen Blog...

Disclaimer: CFDs are complex instruments and come with a high risk of losing your money.
 
Watch FXOpen's October 31 - November 4 Weekly Market Wrap Video

In this video, FXOpen UK COO Gary Thomson sums up the week’s happenings and discusses the most significant news reports.

  • FTSE 100 rockets as oil giant reaps the profits
  • The Fed shook the market. What's next?
  • UK Interest Rate announcement
  • Will the Oil price rise?

Watch our short and informative video, and stay updated with FXOpen.


FXOpen YouTube

Disclaimer: CFDs are complex instruments and come with a high risk of losing your money.
 
House prices in the UK take a nosedive hinting at depth of recession


Whilst it certainly is true that house prices in the UK do not bear a direct relation to the capital markets or world of multi-asset electronic trading, it is most certainly a point of interest that when house prices move up or down, it is an indicator of the confidence in, and security of the domestic economy.

Britain is a home-owning nation. The phrase 'An Englishman's home is his castle' has been very appropriate for many generations and more than just a home, many residents in the United Kingdom see their home as a solid investment which should appreciate steadily over time.

Therefore, when house prices actually decrease, especially by some significant amount, such a decrease can be used as a measure of the weakening condition of the overall economy, which in turn may affect currency and stock markets.

The decreasing value of the British Pound against Western major currencies during the course of mid-2022 until very recently has been a case in point.

Just a few days after the shortest tenure for any Prime Minister in British history was held by Liz Truss for just 44 days, replacement Prime Minister Rishi Sunak took office and the new Chancellor of the Exchequer reversed Ms. Truss and former chancellor Kwasi Kwarteng's budget, with some commentators having even ventured their opinion that had it not been reversed, severe fiscal damage may have been done to the British economy.

Now, as the economy continues to flounder, house prices are at their lowest point since February 2021, this time caused by the increasing cost of borrowing money from banks in the form of mortgages, and the removal of a series of mortgage products from the market by no less than 10 British banks.

Those with mortgages are set for in some cases substantial increases in monthly payments as the interest rates continue to rise, with an expectation of 5 to 6% being reached by January 2023.

Average house prices slid 0.4 per cent between September and October, the most they have fallen since February 2021 and following a 0.1 per cent decline in September according to data from Halifax, one of the UK's largest mortgage lenders.

In February 2021, house prices were at a low point after a brutal period of lockdowns during which many people found their place of employment closed by the government, and payment holidays were commonplace as were fears of unaffordability of monthly commitments.

During the middle of 2021, the British government canceled stamp duty (property purchase tax) for buyers of properties under a certain value, which boosted the market and prices of lower valued properties increased tremendously, largely bolstered by 'buy-to=let' landlords picking up properties with no purchase tax.

That has long since ended, and now with the economy in a sustained state of recession, house prices are once again an indicator of the overall health of the fiscal position in the United Kingdom.

[VIEW FULL ANALYSIS VISIT - FXOpen Blog...

Disclaimer: CFDs are complex instruments and come with a high risk of losing your money.
 
BTCUSD and XRPUSD Technical Analysis – 08th NOV 2022


BTCUSD: Shooting Star Pattern Below $21470

Bitcoin was unable to sustain its bullish momentum and after touching a high of 21470 on 05th Nov, the price started to correct lower against the US dollar and is now trading below the $20000 handle in the European trading session.

We can see that the price is declining due to heavy selling pressure seen across the global crypto markets, and the price of bitcoin is expected to break below the $19000 handle this week.

We have seen a bearish opening of the markets this week.

We can see the formation of bearish engulfing lines in the 1-hour time frame.

The price of bitcoin is below the pivot point and camarilla S3 support level, indicating the bearish trends present in the market.

We can clearly see a shooting star pattern below the $21470 handle which is a bearish reversal pattern because it signifies the end of an uptrend and a shift towards a downtrend.

Bitcoin touched an intraday high of 20666 and an intraday low of 19413 in the Asian trading session today.

Both the STOCH and Williams percent range are indicating overbought levels which means that in the immediate short term, a decline in the prices is expected.

The relative strength index is at 27 indicating a VERY WEAK demand for bitcoin, and the continuation of selling pressure in the markets.

Bitcoin is now moving below its 100 hourly exponential moving average and above its 200 hourly exponential moving average.

Most of the major technical indicators are giving a STRONG SELL signal, which means that in the immediate short term, we are expecting targets of 19000 and 18500.

The average true range is indicating HIGH market volatility with a strong bearish momentum.

  • Bitcoin: bearish reversal seen below $21470
  • The STOCHRSI range is indicating an oversold level
  • The price is now trading below its pivot level of $19818
  • Most of the moving averages are giving a STRONG SELL market signal

Bitcoin: Bearish Reversal Seen Below $21470


We can now see that the price of bitcoin failed to clear the $22000 handle and is now moving towards the $19000 level.

The MACD has crossed down its moving average in the daily time frame indicating a bearish trend.

The parabolic SAR indicator is giving a bearish reversal signal in the daily time frame.

We can see the formation of a bearish price crossover pattern with adaptive moving average AMA20 and AMA50 in the daily time frame.

We have also seen a black evening star in the weekly time frame.

The immediate short-term outlook for bitcoin is strongly bearish, the medium-term outlook has turned bearish, and the long-term outlook remains neutral under present market conditions.

Bitcoin’s support zone is located at $19475 which is a 38.2% retracement from a 4 week low, and the price needs to remain above these levels for any potential bullish reversal in the markets.

The price of BTCUSD is now facing its classic support level of 19646 and Fibonacci resistance level of 19700 after which the path towards 19000 will get cleared.

In the last 24hrs, BTCUSD has decreased by 4.68% by 970$ and has a 24hr trading volume of USD 66.898 billion. We can see an increase of 51.65% in the trading volume compared to yesterday, which is due to the heavy selling pressure seen in the global markets.

The Week Ahead

The price of Bitcoin is moving in a strongly bearish zone below the $20000 level. Further downsides are projected at $19000 and $18500 as the immediate targets.

Now we are aiming for $19385which is an 18-day moving average.

The daily RSI is printing at 45 which indicates a neutral demand for bitcoin and a shift towards the consolidation phase in the markets.

The price of BTCUSD has already crossed below $19855 which is a 50% retracement from a 4-week high/low.

The weekly outlook is projected at $19000 with a consolidation zone of $19250.

Technical Indicators:

The moving averages convergence divergence MACD (12, 26): is at -303.10 indicating a SELL

The commodity channel index CCI (14): is at -107.49 indicating a SELL

The rate of price change ROC: is at -4.53 indicating a SELL

The bull/bear power (13): is at -775.38 indicating a SELL

VIEW FULL ANALYSIS VISIT - FXOpen Blog...

Disclaimer: CFDs are complex instruments and come with a high risk of losing your money.
 
EUR/USD and EUR/JPY Aim More Upsides


EUR/USD is gaining pace above the 1.0000 resistance. EUR/JPY is also rising and might climb further higher above the 147.00 zone.

Important Takeaways for EUR/USD and EUR/JPY

  • The Euro started a fresh increase and was able to clear the 0.9950 resistance zone.
  • There is a key bullish trend line forming with support near 1.0040 on the hourly chart.
  • EUR/JPY started a strong increase and settled well above the 146.00 zone.
  • There is a major bearish trend line forming with resistance near 146.65 on the hourly chart.

EUR/USD Technical Analysis

The Euro formed a base above the 0.9740 zone and started recovery wave against the US Dollar. The EUR/USD pair was able to clear the 0.9820 and 0.9900 resistance levels.

There was a clear move above the 0.9950 level and the 50 hourly simple moving average. The pair even climbed above 1.0000 and traded as high as 1.0096 on FXOpen. It is now consolidating gains near the 1.0080 zone.

EUR/USD Hourly Chart


On the downside, the pair might find support near the 1.0050 level. Besides, there is a key bullish trend line forming with support near 1.0040 on the hourly chart. The trend line is near the 50% Fib retracement level of the upward move from the 0.9972 swing low to 1.0096 high.

The next major support sits near the 1.0020 level and the 50 hourly simple moving average, below which the pair could even test the 76.4% Fib retracement level of the upward move from the 0.9972 swing low to 1.0096 high.

If there is a downside break below the 1.0000 support, the pair might accelerate lower in the coming sessions. In the stated case, it could even test 0.9920.

On the upside, an immediate resistance is near the 1.0095 level. The next major resistance is near the 1.0125 level. The main resistance is near the 1.0150 level. A clear move above the 1.0150 resistance might send the price towards 1.1200. If the bulls remain in action, the pair could revisit the 1.1320 resistance zone in the near term.

VIEW FULL ANALYSIS VISIT - FXOpen Blog...

Disclaimer: CFDs are complex instruments and come with a high risk of losing your money.
 
Tesla stock takes very mild downturn as Musk sells $4 billion worth of stock


Tesla has proven itself to be an extremely unusual force to be reckoned with not only by way of the disruptive influence it has had on the traditional motor industry which is suddenly rallying to transition from internal combustion to electric power, but also on the world of large corporate industry.

As recently as 10 years ago, most motorists worldwide would have continued their long-held belief that electric cars are awful contraptions and that there is nothing like a powerful internal combustion engine to reinforce the fun and experience of car ownership and the driving experience, and motoring groups and media mocked the gormless 'milk float' stature of the attempts to go electric that had gone before.

Suddenly from outside the car industry came Tesla, with no heritage and no 120 years of automotive pedigree and took the world by storm.

Now, Tesla has ten times the market capitalization of Ford Motor Company and is considered to be among America's 'big tech' band of commercial giants such as Amazon and Google.

Yesterday, CEO Elon Musk sold $4 billion worth of Tesla stock. That is a lot of money. It is also a big move by a CEO who is well known for his self-starting, 'my way or the highway' approach to running businesses and influencing entire market sectors and industries.

Surely if Elon Musk cashes out to such a degree, the direction of the company may be diluted and it would take a downturn?

Not really. Yes, the stock has decreased in value slightly but not by very much at all.

Today, Tesla stock is down 2% to 1.91, however when looking over the 5 day period, it is down an unbelievable 34%, so perhaps Elon Musk is cashing out at a time during which the firm's stock is crashing in value over a longer period of time.

Perhaps Tesla has made its point, and now with the rental car fleets, taxi companies and lease market totally flooded with the Model 3, it is no longer considered a novelty, especially considering that the traditional car manufacturers are making arguably much better electric cars. Porsche is selling more fully electric Taycans than all of its other models, and today Volvo launches its fully electric SUV the EX90. BMW and Mercedes Benz have gone fully electric across the range, and the Audi e-Tron is universally popular.

Elon Musk is a savvy investor as much as he is a savvy innovator.

Perhaps he is pulling some capital to safety at a time during which Tesla stock is declining and he has long since made his point.

VIEW FULL ANALYSIS VISIT - FXOpen Blog...

Disclaimer: CFDs are complex instruments and come with a high risk of losing your money.
 
ETHUSD and LTCUSD Technical Analysis – 10th NOV, 2022


ETHUSD: Hammer Pattern Above $1072

Ethereum was unable to sustain its bullish momentum, and after touching a high of 1654 on 05th Nov, the price started to decline against the US dollar touching a low of 1079 on 10th Nov, 2022.

Today we can see some upwards correction in the price of Ethereum which has touched $1200 handle in the European trading session.

We have seen a bullish opening of the markets this week.

We can clearly see a hammer pattern above the $1072 handle which is a bullish pattern and signifies the end of a bearish phase and the start of a bullish phase in the markets.

ETH is now trading just below its pivot level of 1203 and moving into a mildly bullish channel. The price of ETHUSD is now testing its classic resistance level of 1230 and Fibonacci resistance level of 1246 after which the path towards 1300 will get cleared.

The relative strength index is at 47 indicating a neutral market and a shift towards the correction and consolidation phase in the markets.

We can see that the price is back over the pivot point indicating a bullish scenario in the daily time frame.

The STOCHRSI is indicating an overbought market, which means that the prices are expected to decline in the short-term range.

Most of the technical indicators are giving a BUY market signal.

Some of the moving averages are giving a BUY signal and we are now looking at the levels of $1350 to $1400 in the short-term range.

ETH is now trading below both the 100 & 200 hourly simple and exponential moving averages.

  • Ether: bullish reversal seen above the $1072 mark
  • Short-term range appears to be mildly bullish
  • ETH continues to remain above the $1100 level
  • The average true range is indicating LESS market volatility

Ether: Bullish Reversal Seen Above $1072


ETHUSD is now moving into a mildly bullish channel with the price trading above the $1150 handle in the European trading session today.

ETH touched an intraday low of 1127 in the Asian trading session and an intraday high of 1217 in the European trading session today.

We can see a bullish trend reversal signal with moving average MA50 in the 15-minute time frame.

Some of the technical indicators still continue to give bearish signals including the rate of price change.

The price of Ethereum is marching towards a nullish zone against the US dollar and bitcoin. ETHUSD could continue to move higher back towards the $1400 level.

The daily RSI is printing at 36 indicating a very weak demand for Ether in the long-term range.

The key support levels to watch are $1077 which is a 1-month low, and 1184 which is a pivot point.

ETH has increased by 1.79% with a price change of 20.91$ in the past 24hrs and has a trading volume of 36.854 billion USD.

We can see a decrease of 13.76% in the total trading volume in the last 24 hrs which appears to be normal.

The Week Ahead

The price of ETH continues to remain in a bullish zone against the US dollar and bitcoin. ETHUSD is expected to move higher towards the $1300 and $1400 levels this week.

On the upside, we are now looking at the immediate targets of 1303 which is a 38.2% retracement from a 4-week low, and 1372 which is a 50% retracement from 4-week high/low.

The immediate short-term outlook for Ether has turned mildly bullish, the medium-term outlook has turned neutral, and the long-term outlook for Ether is neutral in present market conditions.

The price of ETHUSD will need to remain above the important support levels of $1188 which is the last support point.

The weekly outlook is projected at $1450 with a consolidation zone of $1350.

Technical Indicators:

The average directional index ADX (14): is at 37.20 indicating a BUY

The rate of price change: is at 3.057 indicating a BUY

The bull/bear power (13): is at 37.90 indicating a BUY

High/lows (14): is at 25.17 indicating a BUY

VIEW FULL ANALYSIS VISIT - FXOpen Blog...

Disclaimer: CFDs are complex instruments and come with a high risk of losing your money.
 
AUD/USD and NZD/USD Eye Additional Gains


AUD/USD is moving higher and showing positive signs above 0.6550. NZD/USD is also rising and might aim more upsides above 0.6050.

Important Takeaways for AUD/USD and NZD/USD

  • The Aussie Dollar started a decent increase above the 0.6450 and 0.6500 levels against the US Dollar.
  • There was a break above a key bearish trend line with resistance near 0.6455 on the hourly chart of AUD/USD.
  • NZD/USD is showing a lot of bullish signs above the 0.5950 support zone.
  • There was a break above a major bearish trend line with resistance near 0.5880 on the hourly chart of NZD/USD.

AUD/USD Technical Analysis

The Aussie Dollar formed a base above the 0.6380 level and started a fresh increase against the US Dollar. The AUD/USD pair gained pace above the 0.6450 level to move into a positive zone.

There was a clear move above the 0.6500 level and the 50 hourly simple moving average. Besides, there was a break above a key bearish trend line with resistance near 0.6455 on the hourly chart of AUD/USD.

AUD/USD Hourly Chart


The pair even climbed above the 0.6550 level and traded as high as 0.6631. It is now correcting gains and trading below the 0.6610 level. On the downside, an initial support is near the 0.6375 level. It is near the 23.6% Fib retracement level of the upward move from the 0.6386 swing low to 0.6631 high.

The next support could be the 0.6550 level. If there is a downside break below the 0.6550 support, the pair could extend its decline towards the 0.6500 level. It is near the 50% Fib retracement level of the upward move from the 0.6386 swing low to 0.6631 high.

On the upside, the AUD/USD pair is facing resistance near the 0.6640 level. The next major resistance is near the 0.6660 level. A close above the 0.6660 level could start a steady increase in the near term. The next major resistance could be 0.6750.

VIEW FULL ANALYSIS VISIT - FXOpen Blog...

Disclaimer: CFDs are complex instruments and come with a high risk of losing your money.
 
US may avoid recession whereas Europe may plunge deeper


Just before the weekend began, reports from the United States showed that there is finally some light at the end of what has been a very long tunnel as inflation began to decrease.

On Friday, figures were released showing that consumer price increases eased to 7.7% in October which, although still high compared to the levels most consumers in North America have been used to over recent years, is a definite step in the right direction after inflation headed over the double figures mark a few months ago.

In Europe, however, things are not showing any signs of change. In the United Kingdom it remains just under 10%, and in the Eurozone its 10.7%.

Whereas the majority of the Eurozone and Britain were locked down periodically for over a year and a half, some parts of the United States remained free of any such draconian rules and had managed to maintain productivity. Some of those areas were the states of Florida and Texas, which are both highly urbanized states with large industrial capacity.

This is certainly one factor, as by comparison the Eurozone and United Kingdom had their entire economies postponed for a sustained period of time and are now in fiscal dire straits with that as a major contributing factor.

This morning, analysts at Morgan Stanley reinforced this dynamic, stating that Britain and the euro zone economies are likely to tip into recession next year, whereas by contrast the United States may avoid a recession thanks to a resilient job market.

Morgan Stanley's analysis of this situation also focused on the Federal Reserve's interest rate policy, and the investment bank considers that the Federal Reserve is likely to keep the interest rates at a high level during 2023 as although inflation has decreased in October, 7.7% is still high enough to warrant maintaining high interest rates.

According to a report by Reuters today, Morgan Stanley predicts a sharp split between developed economies in 2023 which are "in or near recession" while emerging economies "recover modestly" but said an overall global pickup would likely remain elusive. China's economy was predicted to grow 5% in 2023, outpacing the average 3.7% growth expected for emerging markets, while the average growth in the Group of 10 developed countries was forecast at just 0.3%.

The value of the British Pound against the US Dollar has performed accordingly, as the Pound dropped in value this morning on the opening of the London trading session, after a substantial rise in value over the weekend, marking a steady move away from several weeks of plummeting Pound values.

VIEW FULL ANALYSIS VISIT - FXOpen Blog...

Disclaimer: CFDs are complex instruments and come with a high risk of losing your money.
 
FTSE 100 index jumps 10 points in one day!


The London Stock Exchange's index containing the 100 most prestigious companies, the FTSE 100, has made a sudden jump upwards by a remarkable 10% this morning.

By 10.00am UK time, it stood at 7,395, representing its highest point over the past 30 days.

The mainstream media is focusing on the insolvency of publicly listed clothes brand Joules, which after 33 years of trading, had its shares suspended ahead of the expected appointment of Interpath Advisory as administrators.

This has not caused the drop that the tabloids across the United Kingdom had predicted and in fact quite the opposite is the case.

Despite the British government's will to raise taxes and unemployment and inflation figures due today and tomorrow before chancellor Jeremy Hunt’s autumn statement on Thursday, the Pound is actually up against the US Dollar at 1.18, and the FTSE 100's stellar performance is defying the gloomy outlook which is being viewed by many citizens.

Inflation is still standing at around 10%, and there is speculation that interest rates could rise dramatically to around 5% in January as Britain's recession continues, the economy reeling in the wake of lockdowns, followed by Brexit-related issues, and subsequently a floundering government led for a record short period of 44 days by Liz Truss who tanked the Pound and caused tremendous levels of uncertainty alongside equally short-lived Chancellor Kwasi Kwarteng whose mini-budget struck fear into the soul of hundreds of thousands of people before it was canceled following the resignation of both Ms Truss and Mr Kwarteng.

So far, the British job market has managed to hold up quite well. The 3,300 increase in new jobs was accompanied by an unemployment rate of 3.6%, which compares with 3.5% the previous month. This has been a positive figure.

Ultimately, it is still clear that volatility in the usually utterly stable stock markets and prestigious indices is the order of the day.

VIEW FULL ANALYSIS VISIT - FXOpen Blog...

Disclaimer: CFDs are complex instruments and come with a high risk of losing your money.
 
BTCUSD and XRPUSD Technical Analysis – 15th NOV 2022


BTCUSD: Double Bottom Pattern Above $15590

Bitcoin was unable to sustain its bullish momentum and after touching a high of 20877 on 07th Nov, the prices started to decline against the US dollar touching a low of 15622 on 10th Nov.

After this decline we can see some correction in the price of bitcoin which is now trading above the 16500 in the European Trading session today.

We can see the formation of a bullish harami pattern in both the 30-minute and weekly time frames.

The RSI indicator is back over 50 indicating the bullish scenario present in the markets.

We can clearly see a double bottom pattern above the $15590 handle which is a bullish reversal pattern because it signifies the end of a downtrend and a shift towards an uptrend.

Bitcoin touched an intraday low of 16364 in the Asian trading session and an intraday high of 16968 in the European trading session today.

Both the STOCH and STOCHRSI are indicating overbought levels which means that in the immediate short term, a decline in the prices is expected.

The relative strength index is at 58 indicating a STRONG demand for bitcoin, and the continuation of the buying pressure in the markets.

Bitcoin is now moving above its 100 hourly exponential moving average and below its 200 hourly exponential moving averages.

Most of the major technical indicators are giving a STRONG BUY signal, which means that in the immediate short term, we are expecting targets of 17000 and 18500.

The average true range is indicating LESS market volatility with a mildly bullish momentum.

  • Bitcoin: bullish reversal seen above $15590
  • The Williams percent range is indicating an overbought level
  • The price is now trading just below its pivot level of $16924
  • Most of the moving averages are giving a BUY market signal

Bitcoin: Bullish Reversal Seen Above $15590


We can now see that the price of bitcoin is moving in a mildly bullish momentum and we are expecting more correction waves in this week.

We can see the formation of a three white soldiers pattern in the 4-hour time frame.

We can see a bullish trend reversal signal with adaptive moving average AMA50 in the 2-hourly time frame.

The price of bitcoin is now moving in an up-channel formation above the $16000 handle.

Some of the technical indicators are also giving a neutral stance of the markets.

The immediate short-term outlook for bitcoin is strongly bullish,the medium-term outlook has turned bullish, and the long-term outlook remains neutral under present market conditions.

Bitcoin’s support zone is located at $16447 which is a pivot point, and $16783 which is a 14-3 day raw stochastic at 20%.

The price of BTCUSD is now facing its classic resistance level of 17015 and Fibonacci resistance level of 17090 after which the path towards 21500 will get cleared.

In the last 24hrs, BTCUSD has increased by 0.36% by 59$ and has a 24hr trading volume of USD 41.390 billion. We can see an increase of 5.45% in the trading volume compared to yesterday, which appears to be normal.

The Week Ahead

The price of Bitcoin is moving in an ascending channel forming with support at $15850 on the hourly chart of the BTCUSD.

Both the MACD and RSI are now giving bullish divergence signals on the weekly time frame.

Now we are aiming for $17849 which is a 38.2% retracement from a 4-week low.

The daily RSI is printing at 36 which indicates a weaker demand for bitcoin and a shift towards the consolidation/correction phase in the markets.

The prices of BTCUSD will need to remain above the important support levels of $16000 this week.

The weekly outlook is projected at $18500 with a consolidation zone of $18000.

Technical Indicators:

The moving averages convergence divergence, MACD (12,26): is at 90.80 indicating a BUY

The commodity channel index, CCI (14): is at 72.52 indicating a BUY

The rate of price change, ROC: is at 3.18 indicating a BUY

The bull/bear power (13): is at 201.98 indicating a BUY

VIEW FULL ANALYSIS VISIT - FXOpen Blog...

Disclaimer: CFDs are complex instruments and come with a high risk of losing your money.
 
EUR/USD Rallies While USD/JPY Takes A Major Hit


EUR/USD started a strong increase above the 1.0200 resistance zone. USD/JPY started a major decline below the 143.50 support zone.

Important Takeaways for EUR/USD and USD/JPY

  • The Euro formed a base and started a strong upward move above the 1.0200 zone.
  • There is a key bullish trend line forming with support near 1.0290 on the hourly chart of EUR/USD.
  • USD/JPY declined sharply after it traded below the 145.60 support zone.
  • There is a major bearish trend line forming with resistance near 143.55 on the hourly chart.

EUR/USD Technical Analysis

This past week, the Euro found support near the 0.9950 zone against the US Dollar. The EUR/USD pair started a steady upward move above the 1.0100 and 1.0200 resistance levels.

There was a steady increase above the 1.0350 resistance zone and the 50 hourly simple moving average. The pair even climbed above the 1.0400 resistance zone. A high was formed near 1.0479 on FXOpen and the pair is now consolidating gains.

EUR/USD Hourly Chart


An immediate resistance on the upside is near the 1.0380 level. It is near the 50% Fib retracement level of the recent decline from the 1.0479 swing high to 1.0277 low.

The next major resistance is near the 1.0430 level. It is close to the 76.4% Fib retracement level of the recent decline from the 1.0479 swing high to 1.0277 low. An upside break above 1.0430 could set the pace for another increase.

In the stated case, the pair might revisit 1.0480. Any more gains might send the pair towards 1.0550. An initial support on the downside is near the 1.0340 level.

The first major support is near the 1.0300 level. There is also a major bearish trend line forming with resistance near 143.55 on the hourly chart. The main support sits near the 1.0250 zone, below which the pair could start a major decline.

VIEW FULL ANALYSIS VISIT - FXOpen Blog...

Disclaimer: CFDs are complex instruments and come with a high risk of losing your money.
 
AUD/USD and NZD/USD Remain At Risk


AUD/USD started a fresh decline from the 0.7275 zone. NZD/USD is also declining and there is a risk of a move below the 0.6720 support.

Important Takeaways for AUD/USD and NZD/USD


  • The Aussie Dollar started another decline from well above the 0.7250 level against the US Dollar.
  • There was a break below a key bullish trend line with support near 0.7200 on the hourly chart of AUD/USD.
  • NZD/USD also declined sharply below the 0.6750 support zone.
  • There is a connecting bearish trend line forming with resistance near 0.6790 on the hourly chart of NZD/USD.

AUD/USD Technical Analysis

The Aussie Dollar struggled to clear the 0.7275 level against the US Dollar. The AUD/USD pair started a fresh decline below the 0.7250 support level to move into a bearish zone.

The bears were able to push the pair below the 50% Fib retracement level of the upward move from the 0.7170 swing low to 0.7275 high (formed on FXOpen). Besides, there was a break below a key bullish trend line with support near 0.7200 on the hourly chart of AUD/USD.

AUD/USD Hourly Chart


The pair settled below the 0.7220 support level and the 50 hourly simple moving average. It is now consolidating near the 0.7185 level.

The 76.4% Fib retracement level of the upward move from the 0.7170 swing low to 0.7275 high is also protecting losses. On the downside, an initial support is near the 0.7170 level. If there is a downside break below the 0.7170 support, the pair could extend its decline towards the 0.7125 level.

Any more downsides might send the pair toward the 0.7100 level. On the upside, the pair is facing resistance near the 0.7210 level.

The next major resistance is near the 0.7240 level. A close above the 0.7240 level could start a steady increase in the near term. The next major resistance could be 0.7300.

Read Full on FXOpen Company Blog...
I like fibo retracement level!
 
Inflation in the UK hits high at 11..1% as US inflation goes down


The floundering British economy has once again been subject to a set of metrics that have marked out the severity of the current situation, this time it is yet again the announcement of an increase in inflation.

Inflation in the United Kingdom reached 11.1% in October 2022, which is higher than had originally been predicted, marking out the very bleak nature of the British economic situation especially considering that yesterday, the United States government issued official figures showing that its level of inflation had reduced significantly to 7.7%.

As can perhaps be expected, low-income households suffered the biggest jump in the cost of living, while high income households were less hit during that period, because low-income households spend more of their money on energy and food where costs have soared.

Surprisingly, however, despite the very high inflation figures in the United Kingdom, the British Pound actually rose against the US Dollar to 1.19 last night and has thus far sustained that level of value, but it fell against the Euro during the early hours of the trading day this morning.

It is looking likely that the Bank of England will not pause its program of increasing interest rates given the 11.1% inflation figure for October, giving more weight to the speculation that interest rates may rise to as much as 5% by January 2023, which would put pressure on people paying mortgages and other loans.

The housing market outside London has already slowed down tremendously compared to just two months ago after 10 banks across the United Kingdom withdrew mortgage products from the market.

Many analysts are looking back to the dark days of the early 1980s when the British economy was struggling after James Callaghan's 1979 'Winter of Discontent' in which there was no public money to pay for essential services and piles of household refuse were meters high in the streets, and companies implemented a 3-day working week due to inability to afford to pay wages.

Today, the set of circumstances that has led to this level of inflation are completely different to those of the late 1970s, hence the uncertainty of what lies ahead and volatility in the currency markets.

VIEW FULL ANALYSIS VISIT - FXOpen Blog...

Disclaimer: CFDs are complex instruments and come with a high risk of losing your money.
 
ETHUSD and LTCUSD Technical Analysis – 17th NOV, 2022


ETHUSD: Bearish Engulfing Pattern Below $1349

Ethereum was unable to sustain its bullish momentum and after touching a high of 1349 on 10th Nov, the prices started to decline against the US dollar touching a low of 1171 on 14th Nov.

After this decline, we can see some upwards correction in the levels of Ethereum above the $1200 handle.

We have seen a bearish opening of the markets this week.

We can clearly see a bearish engulfing pattern below the $1349 handle which is a bearish pattern and signifies the end of a bullish phase and the start of a bearish phase in the markets.

ETH is now trading just below its pivot levels of 1204 and moving into a mildly bearish channel. The price of ETHUSD is now testing its classic support level of 1188 and Fibonacci resistance level of 1198 after which the path towards 1100 will get cleared.

The relative strength index is at 40 indicating a WEAK demand for Ether and the continuation of the selling pressure in the markets.

The prices are ranging near the horizontal resistance in the weekly time frame, indicating a bearish trend.

Both the STOCHRSI and Williams percent range are indicating oversold levels.

All of the technical indicators are giving a STRONG SELL market signal.

Most of the moving averages are giving a STRONG SELL signal and we are now looking at the levels of $1150 to $1100 in the short-term range.

ETH is now trading below both the 100 & 200 hourly simple and exponential moving averages.

  • Ether: bearish reversal seen below the $1349 mark
  • Short-term range appears to be mildly bearish
  • ETH continues to remain below the $1300 level
  • The average true range is indicating LESS market volatility

Ether: Bearish Reversal Seen Below $1349


ETHUSD is now moving in a mildly bearish channel with the prices trading below the $1300 handle in the European trading session today.

ETH continues to remain under pressure this month and fresh downsides are expected below the $1100 handle.

ETHUSD touched an intraday high of 1227 and an intraday low of 1193 in the Asian trading session today.

We can see a bullish price crossover pattern with moving averages MA50 and MA100 in the 1-hour time frame.

We can also see the formation of a black evening star pattern in the 15-minute time frame.

The daily RSI is printing at 38 indicating a very weak demand for Ether in the long-term range.

The key support level to watch is $1186 which is the last resistance level, and $1195 which is a 14-3 day raw stochastic at 20%

ETH has decreased by 3.15% with a price change of 38.81$ in the past 24hrs and has a trading volume of 11.524 billion USD.

We can see an increase of 1.46% in the total trading volume in the last 24 hrs which appears to be normal.

The Week Ahead

ETH price continues to remain in a bearish zone against the US dollar and bitcoin. ETHUSD is expected to move lower towards the $1100 and $11150 levels this week.

We can see the formation of a major bearish trend line in place from $1349 towards $1119 levels.

The immediate short-term outlook for Ether has turned mildly bearish, the medium-term outlook has turned neutral, and the long-term outlook for Ether is neutral in present market conditions.

The prices of ETHUSD will need to remain above the important support levels of $1094 which is the 3rd support pivot point.

The weekly outlook is projected at $1150 with a consolidation zone of $1100.

Technical Indicators:

The relative strength index (14): is at 37.20 indicating a SELL

The rate of price change: is at -1.23 indicating a SELL

Bull/Bear power (13): is at -14.17 indicating a SELL

High/lows (14): is at -7.94 indicating a SELL

VIEW FULL ANALYSIS VISIT - FXOpen Blog...

Disclaimer: CFDs are complex instruments and come with a high risk of losing your money.
 
Gold Price Could Correct Lower, Crude Oil Price Breaks Key Support


Gold price climbed higher and traded above the $1,750 resistance. Crude oil price declined below the $86.00 and $83.80 support levels.

Important Takeaways for Gold and Oil

  • Gold price found support near the $1,700 level and started a fresh increase against the US Dollar.
  • There was a break below a key bullish trend line with support near $1,772 on the hourly chart of gold.
  • Crude oil price gained bearish momentum below the $86.00 support zone.
  • There is a major bearish trend line forming with resistance near $84.40 on the hourly chart of XTI/USD.

Gold Price Technical Analysis

Gold price formed a base above the $1,700 level against the US Dollar. The price started a fresh increase and was able to clear the $1,720 and $1,740 resistance levels.

There was a clear move above the $1,750 resistance and the 50 hourly simple moving average. The price even broke the $1,780 level and traded as high as $1,786 on FXOpen. Recently, there was a downside correction below the $1,775 level.

Gold Price Hourly Chart


The price traded below the 23.6% Fib retracement level of the upward move from the $1,702 swing low to $1,786 high. Besides, there was a break below a key bullish trend line with support near $1,772 on the hourly chart of gold.

An immediate support on the downside is near the $1,755 level. The next major support is near the $1,745 level or the 50% Fib retracement level of the upward move from the $1,702 swing low to $1,786 high, below which there is a risk of a larger decline.

In the stated case, the price could decline sharply towards the $1,722 support zone. On the upside, the first major resistance is near the $1,770 level.

The main resistance is now forming near the $1,785 level, above which it could even test $1,800. A clear upside break above the $1,800 resistance could send the price towards $1,840.

VIEW FULL ANALYSIS VISIT - FXOpen Blog...

Disclaimer: CFDs are complex instruments and come with a high risk of losing your money.
 
Watch FXOpen's November 14 - 18 Weekly Market Wrap Video

In this video, FXOpen UK COO Gary Thomson sums up the week’s happenings and discusses the most significant news reports.

  • How will Rishi Sunak affect the pound?
  • US may avoid recession whereas Europe may plunge deeper
  • EUR/USD rallies while USD/JPY takes a major hit
  • GBPUSD reaches 1.20, what's next?
  • Inflation in the UK hits high at 11.1% as US inflation goes down.

Watch our short and informative video, and stay updated with FXOpen.


FXOpen YouTube

Disclaimer: CFDs are complex instruments and come with a high risk of losing your money.
 
GBP/USD Corrects Gains, USD/CAD Eyes Fresh Increase


GBP/USD climbed towards 1.2000 before it faced sellers. USD/CAD is rising and might gain pace above the 1.3450 resistance zone.

Important Takeaways for GBP/USD and USD/CAD

  • The British Pound was able to move above the 1.1800 and 1.1900 resistance levels.
  • There is a key bearish trend line forming with resistance near 1.1900 on the hourly chart of GBP/USD.
  • USD/CAD tested the 1.3220 zone and started a recovery wave.
  • There is a major bullish trend line forming with support at 1.3370 on the hourly chart.

GBP/USD Technical Analysis

After forming a base above the 1.1500, the British Pound started a steady increase against the US Dollar. GBP/USD gained pace for a move above the 1.1650 and 1.1800 resistance levels.

There was a move above the 1.1900 resistance and the 50 hourly simple moving average. The pair even moved above the 1.2000 level and traded as high as 1.2027 on FXOpen. It is now correcting gains and trading below the 1.1950 level.

GBP/USD Hourly Chart


Recently, there was a move below the 1.1920 and 1.1880 support levels. The pair declined below the 50% Fib retracement level of the upward move from the 1.1764 swing low to 1.1951 high.

It is now trading below the 1.1880 level and the 50 hourly simple moving average. On the downside, an initial support is near the 1.1835 area. It is near the 61.8% Fib retracement level of the upward move from the 1.1764 swing low to 1.1951 high.

The next major support is near the 1.1765 level. If there is a break below 1.1765, the pair could extend its decline. The next key support is near the 1.1650 level. Any more losses might call for a test of the 1.1550 support.

An immediate resistance is near the 1.1880 level. There is also a key bearish trend line forming with resistance near 1.1900 on the hourly chart of GBP/USD.

The next resistance is near the 1.1920 level. The main resistance is near the 1.2000 level. If there is an upside break above the 1.2000 zone, the pair could rise towards 1.2120. The next key resistance could be 1.2200.

VIEW FULL ANALYSIS VISIT - FXOpen Blog.../B]

Disclaimer: CFDs are complex instruments and come with a high risk of losing your money.
 
Pound's gains wiped off after tax-grab budget leads toward retail sales outlook


The monumental and sustained decline in value that blighted the British Pound over recent months in which it almost went into freefall with no sign of an end suddenly began to show signs of improvement a couple of weeks ago when Liz Truss, the British Prime Minister to hold the shortest tenure in office in British history - just 44 days - resigned.

Her resignation was considered a positive step by the markets, as along with her leaving her office, an equally short-lived stint in office for Chancellor of the Exchequer (Finance Minister) Kwasi Kwarteng also came to an end.

During Ms Truss' 44 day term as Prime Minster, she ramped up the rhetoric against Russia, presided over a disastrous mini-budget which was canceled the moment she left office, and created a sense of nervousness in the markets.

The pound began to recover after her tenure as Prime Minister ended, and although still very much in the doldrums and having not managed to reach 1.18 against the US Dollar which by contrast has been a very strong currency over recent months, the economic woes in the United Kingdom have been too grave to ignore.

Last week, new Prime Minister Rishi Sunak along with new Chancellor of the Exchequer Jeremy Hunt unveiled their new budget, which was laden with significant socialist-style tax increases, right at a time when the economy is in limp-home mode following the hundreds of billions which flowed out of the coffers during 2020 and 2021 under Mr Sunak's watch as Chancellor.

The pound crashed in value once again yesterday during the hours of the London trading session, and although it is not down to the low levels that it reached at the end of Ms Truss' tenure at Number 10 Downing Street, it did head back to the low 1.18 range.

It appears that the confidence-busting high-tax budget which now causes the average British household to be even more cash-strapped during what is being dubbed a 'cost of living crisis', and the potential that some high net worth individuals or companies with international offices may move their wealth to more tax-friendly jurisdictions, has caused investors and traders to take a conservative view once again.

This drop came in at exactly the time when earnings reports from many publicly-listed retail giants are about to be released, and whilst we do not know what those figures may be as yet, it is estimated by many analysts that they could be a bit lower than usual at this time of year due to people simply not having as much disposable income available as they once did, and the government's imminent interest rate rises which are estimated to reach around 5% by January 2023 as inflation soared over the 11% mark in Britain by Friday last week.

By contrast, the United States, whilst still blighted by high inflation over the past year, is not fairing so badly at all. At the end of last week, inflation in the United States actually decreased to 7.7%, and whilst that may still sound a lot compared to the levels that it stood at by the end of last decade, it is far lower than the 10% it reached by the summer of this year.

By no means is the United States economy out of the woods yet, but it is certainly showing signs of returning to some degree of fortitude.

Britain, by contrast, battles on with serious challenges ahead.

VIEW FULL ANALYSIS VISIT - FXOpen Blog...

Disclaimer: CFDs are complex instruments and come with a high risk of losing your money.
 

Create an account or login to comment

You must be a member in order to leave a comment

Create account

Create an account on our community. It's easy!

Log in

Already have an account? Log in here.

Similar threads

Users Who Are Viewing This Thread (Total: 1, Members: 0, Guests: 1)

Top
AdBlock Detected

We get it, advertisements are annoying!

Sure, ad-blocking software does a great job at blocking ads, but it also blocks useful features of our website. For the best site experience please disable your AdBlocker.

I've Disabled AdBlock    No Thanks