FXOpen Trader
Active Member
GBP/USD Faces Hurdles, EUR/GBP Could Correct Losses
GBP/USD started a fresh decline from the 1.2165 resistance. EUR/GBP declined heavily and tested the 0.8440 support zone.
Important Takeaways for GBP/USD and EUR/GBP
GBP/USD Technical Analysis
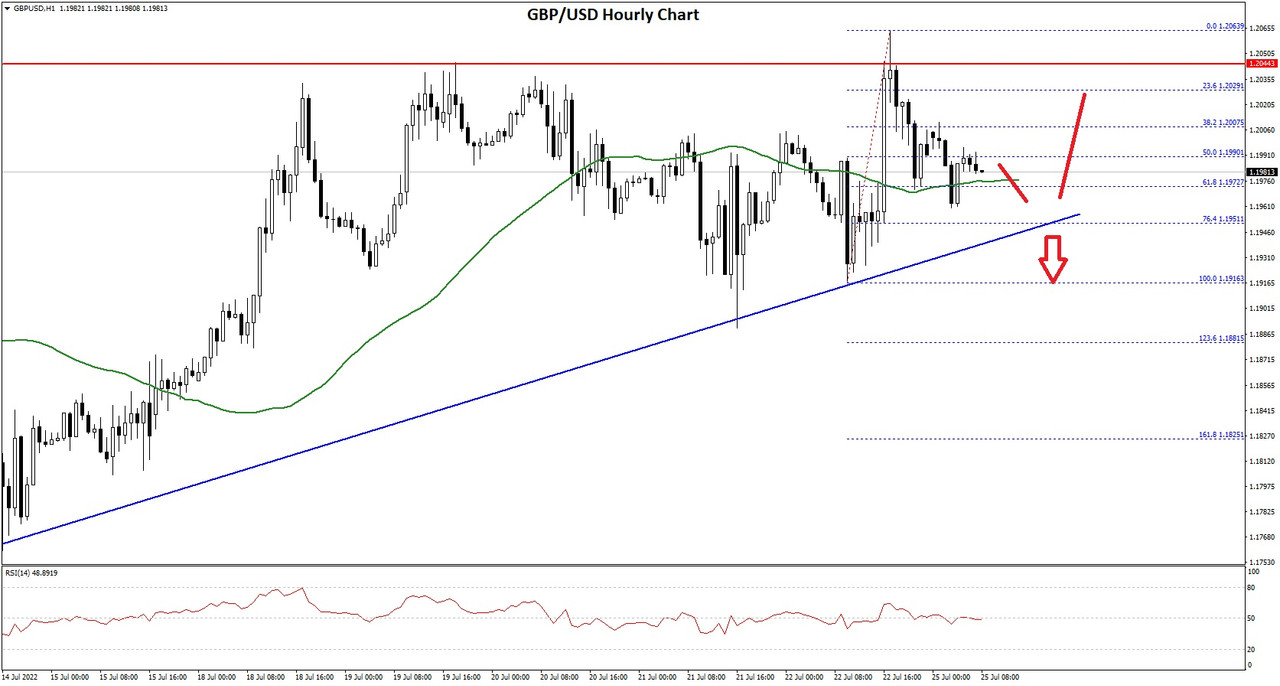
The British Pound failed to gain strength above the 1.2200 level against the US Dollar. The GBP/USD pair started a fresh decline below the 1.2150 and 1.2120 support levels.
There was a clear move below the 1.2000 support level and the 50 hourly simple moving average. The bears even pushed the pair below the 1.1950 level. A low was formed near 1.1875 on FXOpen the pair is now correcting losses.
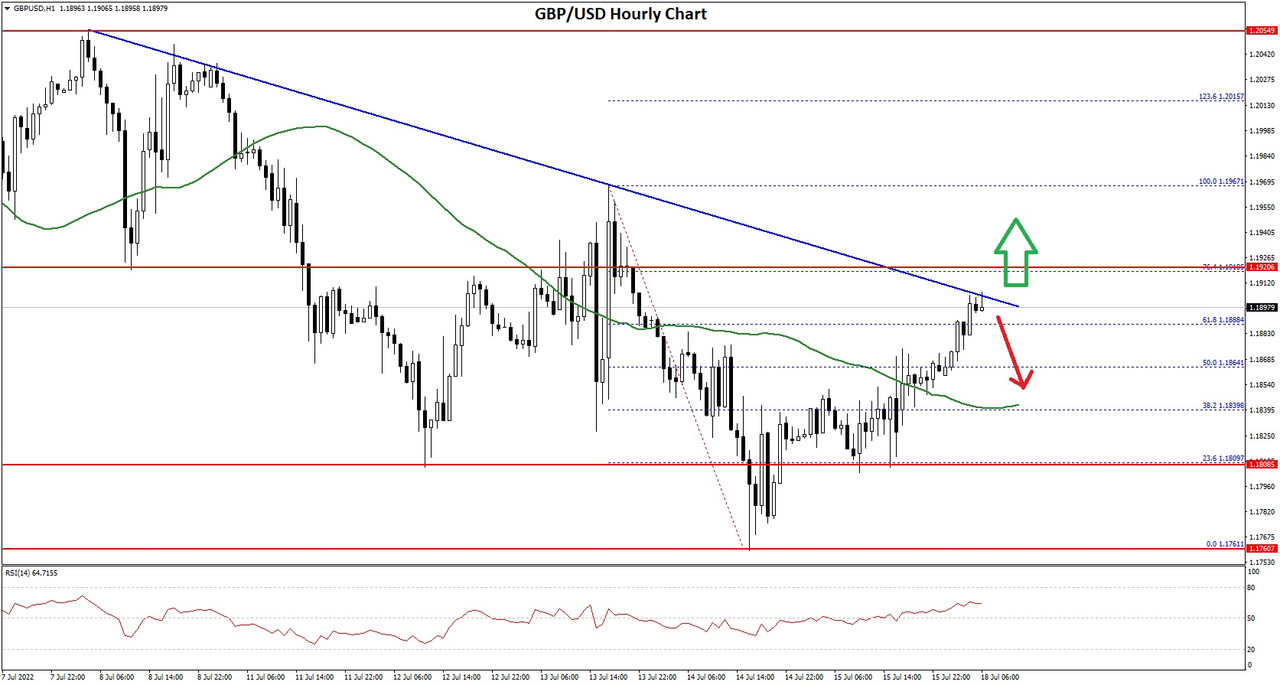
GBP/USD Hourly Chart
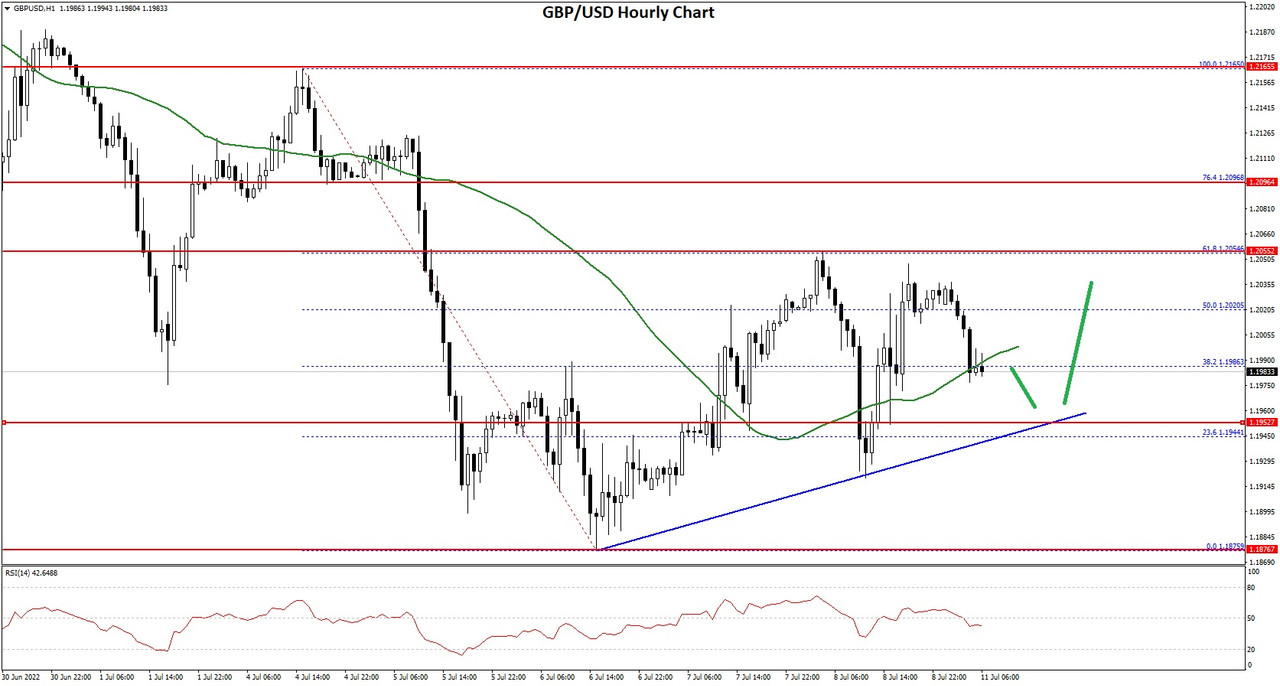
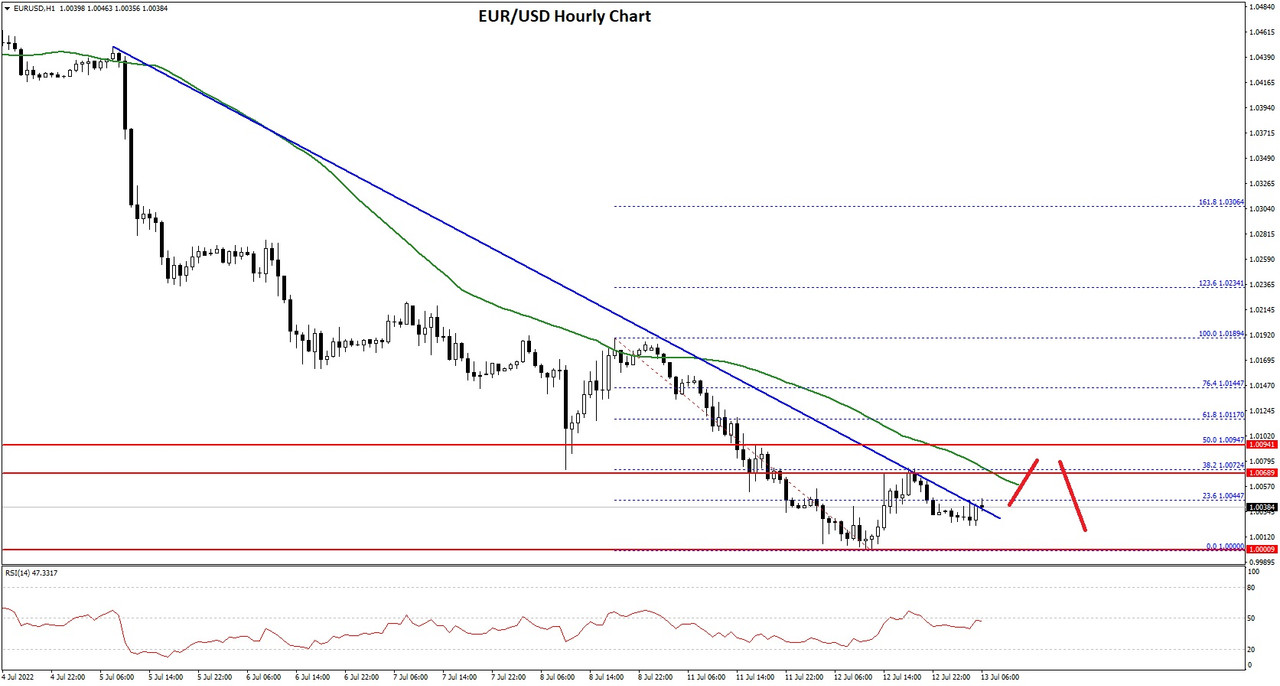
There was a move above the 1.1950 and 1.2000 resistance levels. The pair even climbed above the 50% Fib retracement level of the downward move from the 1.2165 swing high to 1.1875 low.
However, the pair faced sellers near the 1.2050 level. It struggled near the 61.8% Fib retracement level of the downward move from the 1.2165 swing high to 1.1875 low. On the upside, an initial resistance is near the 1.2020 level.
The next main resistance is near the 1.2050 zone. A clear upside break above the 1.2020 and 1.2050 resistance levels could open the doors for a steady increase in the near term. The next major resistance sits near the 1.2165 level.
If not, the pair might start a fresh decline below 1.1980. There is also a key bullish trend line forming with support near 1.1960 on the hourly chart of GBP/USD. The next major support is near the 1.1920 level. Any more losses could lead the pair towards the 1.1875 support zone or even 1.1800.
Read Full on FXOpen Company Blog...
GBP/USD started a fresh decline from the 1.2165 resistance. EUR/GBP declined heavily and tested the 0.8440 support zone.
Important Takeaways for GBP/USD and EUR/GBP
- The British Pound started a fresh decline from the 1.2165 zone against the US Dollar.
- There is a key bullish trend line forming with support near 1.1960 on the hourly chart of GBP/USD.
- EUR/GBP declined below the 0.8550 and 0.8500 support levels.
- There is a major bearish trend line forming with resistance near 0.8480 on the hourly chart.
GBP/USD Technical Analysis
The British Pound failed to gain strength above the 1.2200 level against the US Dollar. The GBP/USD pair started a fresh decline below the 1.2150 and 1.2120 support levels.
There was a clear move below the 1.2000 support level and the 50 hourly simple moving average. The bears even pushed the pair below the 1.1950 level. A low was formed near 1.1875 on FXOpen the pair is now correcting losses.
GBP/USD Hourly Chart
There was a move above the 1.1950 and 1.2000 resistance levels. The pair even climbed above the 50% Fib retracement level of the downward move from the 1.2165 swing high to 1.1875 low.
However, the pair faced sellers near the 1.2050 level. It struggled near the 61.8% Fib retracement level of the downward move from the 1.2165 swing high to 1.1875 low. On the upside, an initial resistance is near the 1.2020 level.
The next main resistance is near the 1.2050 zone. A clear upside break above the 1.2020 and 1.2050 resistance levels could open the doors for a steady increase in the near term. The next major resistance sits near the 1.2165 level.
If not, the pair might start a fresh decline below 1.1980. There is also a key bullish trend line forming with support near 1.1960 on the hourly chart of GBP/USD. The next major support is near the 1.1920 level. Any more losses could lead the pair towards the 1.1875 support zone or even 1.1800.
Read Full on FXOpen Company Blog...