Capitalcore
Member
EUR/CHF H4 Chart Price Action Signals Bullish Reversal
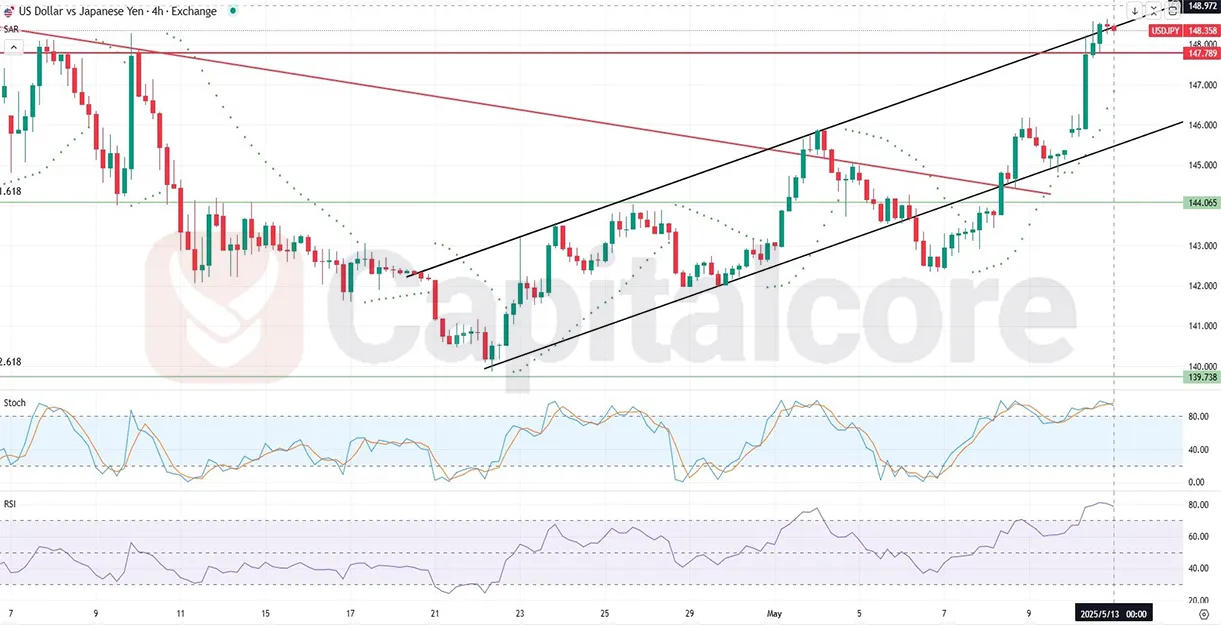
The EUR-CHF, often referred to as the "Swissie," is a significant forex pair reflecting the economic relationship between the Eurozone and Switzerland. Traders frequently monitor this pair due to its reputation as a safe-haven currency pair, particularly during periods of market uncertainty. Fundamental analysis for today indicates potential volatility for EURCHF as multiple key economic data points from the Eurozone are due, including Consumer Sentiment, Consumer Price Index (CPI), Gross Domestic Product (GDP), Money Supply, and private sector loans. Positive results from these indicators, especially higher-than-forecast CPI and GDP, could bolster the Euro, indicating economic strength and leading to potential bullish momentum for EURCHF. Conversely, traders should closely monitor statements from Swiss National Bank (SNB) Vice-Chairman Antoine Martin, as a more hawkish stance may support CHF strength, creating downward pressure on the EURCHF.
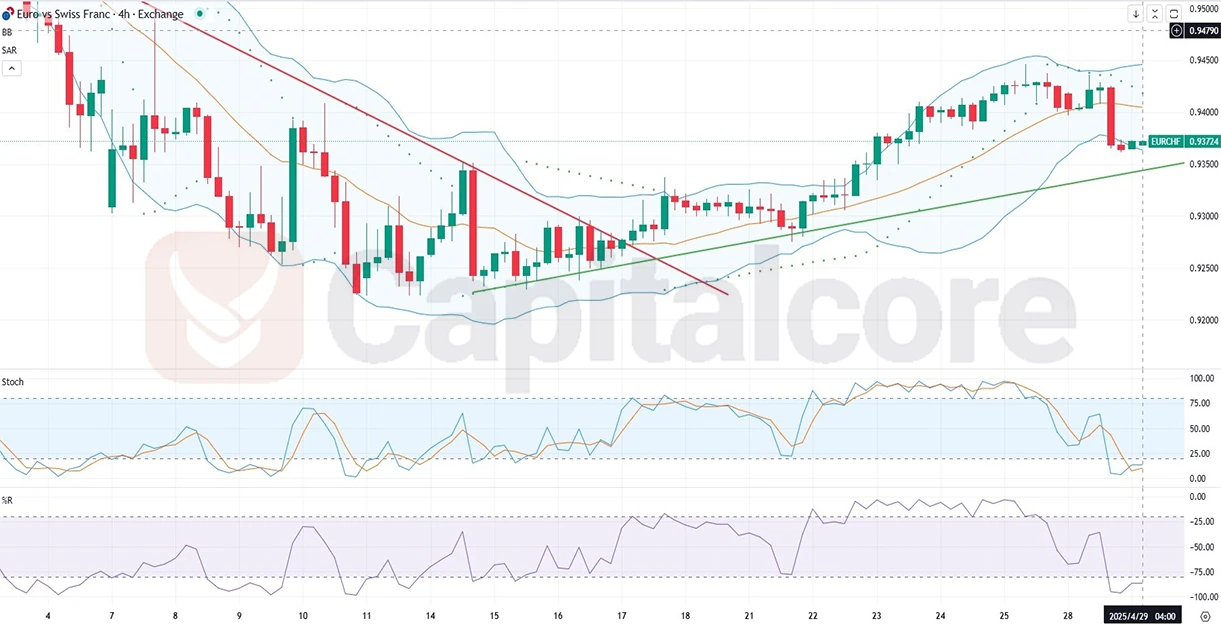
Chart Notes:
• Chart time-zone is UTC (+03:00)
• Candles’ time-frame is 4h.
The EURCHF H4 technical analysis shows that the price has broken above a previous downtrend line and initiated a robust upward trend, now approaching its uptrend support line. The multiple divergences observed between the price action and the stochastic oscillator confirm the bullish strength of this new trend. If the EURCHF price retests the ascending support line, it is likely to find support and rebound rather than breaking below, given the bullish signals from divergence. Additionally, the Stochastic indicator is oversold and poised for a bullish reversal, reinforcing the expectation of price support at current levels. The Williams %R indicator also indicates an oversold market condition, suggesting potential bullish price action in the near term, aligning with the overall upward trend sentiment. The Bollinger Bands suggest a volatility contraction, which could precede a strong price breakout. Currently, the price is near the lower band, indicating potential support at this level. Additionally, the Parabolic SAR has shifted below the price, signaling bullish momentum and supporting the potential continuation of the upward trend.
• DISCLAIMER: Please note that the above analysis is not an investment suggestion by “Capitalcore LLC”. This post has been published only for educational purposes.
Capitalcore
The EUR-CHF, often referred to as the "Swissie," is a significant forex pair reflecting the economic relationship between the Eurozone and Switzerland. Traders frequently monitor this pair due to its reputation as a safe-haven currency pair, particularly during periods of market uncertainty. Fundamental analysis for today indicates potential volatility for EURCHF as multiple key economic data points from the Eurozone are due, including Consumer Sentiment, Consumer Price Index (CPI), Gross Domestic Product (GDP), Money Supply, and private sector loans. Positive results from these indicators, especially higher-than-forecast CPI and GDP, could bolster the Euro, indicating economic strength and leading to potential bullish momentum for EURCHF. Conversely, traders should closely monitor statements from Swiss National Bank (SNB) Vice-Chairman Antoine Martin, as a more hawkish stance may support CHF strength, creating downward pressure on the EURCHF.
Chart Notes:
• Chart time-zone is UTC (+03:00)
• Candles’ time-frame is 4h.
The EURCHF H4 technical analysis shows that the price has broken above a previous downtrend line and initiated a robust upward trend, now approaching its uptrend support line. The multiple divergences observed between the price action and the stochastic oscillator confirm the bullish strength of this new trend. If the EURCHF price retests the ascending support line, it is likely to find support and rebound rather than breaking below, given the bullish signals from divergence. Additionally, the Stochastic indicator is oversold and poised for a bullish reversal, reinforcing the expectation of price support at current levels. The Williams %R indicator also indicates an oversold market condition, suggesting potential bullish price action in the near term, aligning with the overall upward trend sentiment. The Bollinger Bands suggest a volatility contraction, which could precede a strong price breakout. Currently, the price is near the lower band, indicating potential support at this level. Additionally, the Parabolic SAR has shifted below the price, signaling bullish momentum and supporting the potential continuation of the upward trend.
• DISCLAIMER: Please note that the above analysis is not an investment suggestion by “Capitalcore LLC”. This post has been published only for educational purposes.
Capitalcore