What's new

Permission errors

  • Permission 'viewOthers' unknown for content type 'node' (src/XF/Entity/User.php:1278)
  • Permission 'viewOthers' unknown for content type 'node' (src/XF/Entity/User.php:1278)
  • Permission 'viewOthers' unknown for content type 'node' (src/XF/Entity/User.php:1278)
  • Permission 'viewOthers' unknown for content type 'node' (src/XF/Entity/User.php:1278)
  • Permission 'viewOthers' unknown for content type 'node' (src/XF/Entity/User.php:1278)
  • Permission 'viewOthers' unknown for content type 'node' (src/XF/Entity/User.php:1278)
Top Forex Forum | Get Forex Trading Strategies & Feeds | Forex Forum

This is a sample guest message. Register a free account today to become a member! Once signed in, you'll be able to participate on this site by adding your own topics and posts, as well as connect with other members through your own private inbox!

Forex News Daily Market Forecast By Capitalcore

5.00 star(s) 1 Vote
EURUSD Price Forecast: Technical and Fundamental Insights

EUR/USD, commonly known as the "Fiber," is among the most traded currency pairs globally, reflecting the economic dynamics between the Eurozone and the United States. The EUR/USD pair is highly sensitive to economic indicators, central bank decisions, and geopolitical events, making it crucial for forex traders to monitor fundamental news closely. Today's significant event includes the speech from US President Donald Trump in Iowa, potentially impacting market sentiment due to his statements on economic policy and future monetary strategies. Moreover, the recent Energy Information Administration (EIA) data could also affect the US Dollar (USD) valuation, indirectly influencing EUR/USD dynamics by altering expectations around oil supply and economic growth forecasts.
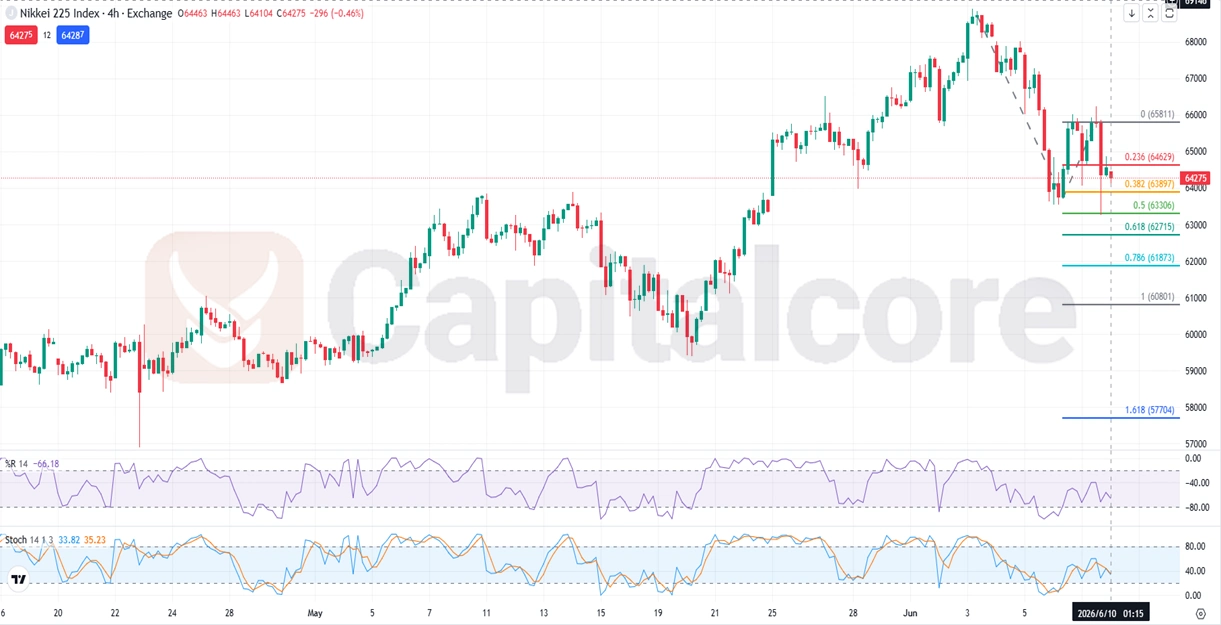
EURUSD-Fundamental-and-Technical-Forecast-01.28.2026.webp

Chart Notes:
• Chart time-zone is UTC (+02:00)
• Candles’ time-frame is 4h

The EUR/USD H4 chart has predominantly shown a bullish trend, characterized by brief bearish movements and periods of consolidation. Recently, the bullish momentum has notably accelerated, indicating increased market volatility. Currently, the EUR/USD pair price action is trading significantly above the Ichimoku cloud (1.19653, 1.18753, 1.20416, 1.16973, 1.16728), signaling strong bullish momentum. However, the RSI (14) at 89.13 suggests an extreme overbought market condition, raising possibilities for a corrective pullback in the near term. Similarly, William’s %R (14) at -12.91 also supports the overbought signal, suggesting traders should be cautious of potential price reversals or temporary consolidations.

•DISCLAIMER: Please note that the above analysis is not an investment suggestion by “Capitalcore LLC”. This post has been published only for educational purposes.

Capitalcore
 
UK100 Index Hovering Midline, Bulls Eye Upper Channel

The UK100, also known as the FTSE 100 Index, represents the top 100 blue-chip companies listed on the London Stock Exchange and is commonly referred to as the "Footsie." It serves as a crucial benchmark for assessing the health of the UK stock market. Today, fundamental market movements will be closely influenced by economic indicators, notably the release of the Services Purchasing Managers' Index (PMI) and consumer inflation reports from the Eurozone. Positive figures exceeding forecasts would likely bolster investor confidence, driving bullish sentiments and supporting the UK100 index upwards, while weaker-than-expected data might trigger caution, leading to corrective moves or volatility.
UK100-Fundamental-and-Technical-Forecast-02.04.2026.webp

Chart Notes:
• Chart time-zone is UTC (+02:00)
• Candles’ time-frame is 4h

Analyzing the UK100 H4 chart, we see a clear bullish price action within a gradually ascending channel, periodically punctuated by corrective phases. Currently, the price hovers near the midline of the channel, suggesting indecision marked by a doji candlestick. Nonetheless, the bullish channel and today's latest bullish candle indicate potential for continuation in the upward trajectory towards the upper boundary of the channel. Technical indicators reinforce this perspective, with the Williams %R at -25.72 suggesting mild bullishness, and the MACD (12,26,9) line at 3.28 crossing above the signal line (32.41), indicating positive bullish momentum.

•DISCLAIMER: Please note that the above analysis is not an investment suggestion by “Capitalcore LLC”. This post has been published only for educational purposes.

Capitalcore
 
XAUUSD H4 technical and fundamental outlook

Gold (XAU/USD)—widely known as the safe-haven metal—is one of the most liquid and influential forex commodity pairs. Its price is strongly driven by global risk sentiment, inflation expectations, and shifts in US monetary policy. Today’s fundamental outlook for XAU/USD is shaped by delayed but highly important USD data, including NFP, Unemployment Rate, and Labor Cost Index, along with speeches from FOMC members Jeffrey Schmid and Michelle Bowman. These releases and comments may increase volatility, as strong labor data or hawkish guidance would support USD strength and pressure gold, while weaker figures or dovish tones could boost XAU/USD. Crude Oil Inventory updates also affect inflation expectations, adding another layer of influence to gold’s short-term direction.
Gold-Fundamental-and-Technical-Forecast-02.11.2026.webp

Chart Notes:
• Chart time-zone is UTC (+02:00)
• Candles’ time-frame is 4h

In the XAU/USD H4 technical analysis, the chart shows gold trying to recover from a strong bearish swing, with buyers currently struggling to break the 5036.97 resistance, which aligns with the 0.236 Fibonacci extension. Although sellers still show interest, the broader trend remains historically bullish, and recent candle strength hints at possible continuation upward. The EMA (9) sits at 5022.88, touching price and reflecting indecision. The RSI (14) at 54.53 indicates mild bullish momentum, while the Stochastic (14,1,3) at 59.21 / 62.46 suggests momentum could build if resistance gives way. Overall, consolidation persists, but a breakout remains likely if fundamentals do not sharply favor the USD.

•DISCLAIMER: Please note that the above analysis is not an investment suggestion by “Capitalcore LLC”. This post has been published only for educational purposes.

Capitalcore
 
Dow Jones Industrial Average Consolidation Points to Breakout

The US30 index, commonly known as the Dow Jones Industrial Average or simply "The Dow," is among the most prominent U.S. equity indices tracking the performance of 30 major publicly traded companies. Today's fundamental analysis for the US30 index revolves around significant scheduled events, notably former President Donald Trump's State of the Union address, which could induce volatility based on policy directives or economic commentary. Additionally, speeches by Federal Reserve officials, including Thomas Barkin, Jeffrey Schmid, and Alberto Musalem, could offer hawkish insights affecting market expectations and investor sentiment. Traders should monitor the weekly Crude Oil Inventories report from the EIA closely, as energy prices significantly impact index-linked company valuations, especially in sectors like energy and manufacturing.
US30-Fundamental-and-Technical-Forecast-02.25.2026.webp

Chart Notes:
• Chart time-zone is UTC (+02:00)
• Candles’ time-frame is 4h

The US30 H4 technical chart has displayed indecision, captured clearly within a horizontal channel formation throughout this year, coupled with several failed breakout attempts. Candlesticks currently gravitate towards the channel's lower boundary, signaling potential bearish momentum, particularly given recent robust bearish movements. A decisive breakout below the lower band could mark the onset of a bearish trend. The 9-period Moving Average currently lies below the candles, reinforcing short-term bearish sentiment. RSI (14) stands at 46.44, indicating neutral but mildly bearish conditions. MACD (12, 26, 9) values at 15, -124, -139 highlight the dominance of selling pressure in recent sessions, further supporting potential bearish moves.

•DISCLAIMER: Please note that the above analysis is not an investment suggestion by “Capitalcore LLC”. This post has been published only for educational purposes.

Capitalcore
 
USDCHF Technical Analysis Range Breakout Retest Levels

USD/CHF measures how many Swiss francs it takes to buy one US dollar, pairing the global reserve currency with Switzerland’s classic safe haven. Commonly nicknamed the Swissie, it’s heavily driven by relative interest rate expectations, risk sentiment, and macro surprises. In today’s USD-CHF daily chart technical and fundamental analysis, markets will key in on ADP employment, S&P Global Services PMI, and ISM Services PMI for US growth and Fed rate-path signals, with the Fed Beige Book adding tone; on the CHF side, Swiss CPI can quickly shift SNB expectations, while comments from SNB Vice Chairman Antoine Martin may add policy color—stronger US data with softer Swiss inflation supports USD/CHF upside, while weaker US prints or hotter Swiss CPI and a hawkish SNB read supports CHF and pressures USD/CHF price action.
USDCHF-Fundamental-and-Technical-Forecast.03.04.2026.webp

Chart Notes:
• Chart time-zone is UTC (+02:00)
• Candles’ time-frame is 4h.

On the USD/CHF H4 chart, the long-run bias has been mostly bearish with extended consolidation, but after a sharp drop, the pair ranged between 0.76476 and 0.77942 before breaking above, raising the odds of either a new bullish leg or a breakout failure back into the range. Fibonacci shows price near 0.236 around 0.78057 as the first pullback support, with 0.382 near 0.77755 as the next key level if sellers push lower; holding above 0.77942 keeps upside pressure toward 0.78545. Bollinger Bands 70 have expanded and may start narrowing as volatility cools, while Williams percent R 14 at minus 31 41 and Stochastic 14 1 3 at 68 59 and 71 10 reflect bullish momentum that could enter a consolidation phase—so the clean price action read is defend-the-breakout for continuation, or lose it and rotate back toward 0.77755.

•DISCLAIMER: Please note that the above analysis is not an investment suggestion by “Capitalcore LLC”. This post has been published only for educational purposes.

Capitalcore
 
Thanks for sharing the forecast. Daily outlooks can be helpful for spotting short‑term opportunities, but it’s always good to compare them with your own analysis and higher time frame trends. Market conditions change quickly, so combining forecasts with personal risk management usually gives better results. :confused: :cautious:
 
Bitcoin Technical Analysis: Sideways Market Structure

BTC-USD, commonly known as Bitcoin and often referred to as Digital Gold, is the leading cryptocurrency pair representing the value of Bitcoin against the US Dollar and is widely followed in global crypto and forex markets. In today’s BTCUSD daily chart technical and fundamental analysis, market participants are closely monitoring key USD economic releases and geopolitical developments that could influence risk sentiment and the direction of the Bitcoin price action. Upcoming US data such as the NFIB Small Business Optimism Index, ADP employment figures, and Existing Home Sales may impact the strength of the US Dollar, which typically shows an inverse correlation with BTC USD price movement in the crypto market. Strong US economic data can support the USD and pressure Bitcoin in the short term, while weaker figures may boost risk appetite and support bullish Bitcoin technical outlook. Additionally, geopolitical headlines including President Trump’s remarks about the Ukraine conflict and discussions with Russian President Vladimir Putin, along with potential G7 intervention and strategic oil reserve stabilization measures, may influence global market volatility and investor sentiment toward risk assets like Bitcoin, making today’s BTC/USD fundamental analysis highly sensitive to macroeconomic signals and geopolitical developments.
BTCUSD_Bitcoin-Technical-Analysis-Sideways-Market-Structure-03.10.2026-.webp

Chart Notes:
• Chart time-zone is UTC (+02:00)
• Candles’ time-frame is 4h.

From a BTC-USD H4 chart technical analysis perspective based on the uploaded chart, the Bitcoin price action is moving sideways and horizontally ranging between $61K and $75K during the last month, indicating a consolidation phase after the previous bearish trend. The Moving Average triple setup EMA 21, EMA 50, and EMA 200 provides important signals for the BTCUSD daily chart technical outlook. The EMA 200 remains above the candles, confirming the broader bearish pressure on the H4 timeframe, while the EMA 21 is currently above the EMA 50, suggesting short-term bullish momentum within the range. The EMA 21 is positioned above the recent candles, acting as near-term resistance, while the EMA 50 is touching the latest candles, indicating a short-term dynamic support zone. Momentum indicators show mixed signals in this Bitcoin technical analysis: the Williams Percent Range %R 14 is at -46.27, reflecting neutral market momentum and confirming the ongoing consolidation phase. Meanwhile, the MACD indicator shows values around -215.25 and -229.63 with a histogram near -14.38, indicating weak bearish momentum but also suggesting that selling pressure is gradually stabilizing. The BTC/USD H4 price action continues to respect the Fibonacci retracement zone with key resistance near $75K, while strong support remains around $61K, meaning a breakout above resistance could shift the Bitcoin market outlook toward $79K–$83K levels, while a breakdown below support may reopen downside pressure toward deeper liquidity zones.

•DISCLAIMER: Please note that the above analysis is not an investment suggestion by “Capitalcore LLC”. This post has been published only for educational purposes.

Capitalcore
 

Create an account or login to comment

You must be a member in order to leave a comment

Create account

Create an account on our community. It's easy!

Log in

Already have an account? Log in here.

Similar threads

Users Who Are Viewing This Thread (Total: 0, Members: 0, Guests: 0)

Back
Top