What's new

RoboForex - Forex Broker: overview and news

4.60 star(s) 7 Votes
Basket Trading: Using Interrelations Between Trading Instruments


Dear Clients and Partners,

In this overview, we will discuss such as trading method as “Basket Trading”. It helps to diversify risks and create a market-neutral trading strategy.

What is Basket Trading?

Basket Trading is a method of trading that uses not just one instrument but a whole bunch (“basket”) of them. For example, instead of trading a single currency, you focus on a set of currencies. Or, instead of trading stocks of one company, you trade a portfolio of several companies in a certain sector.

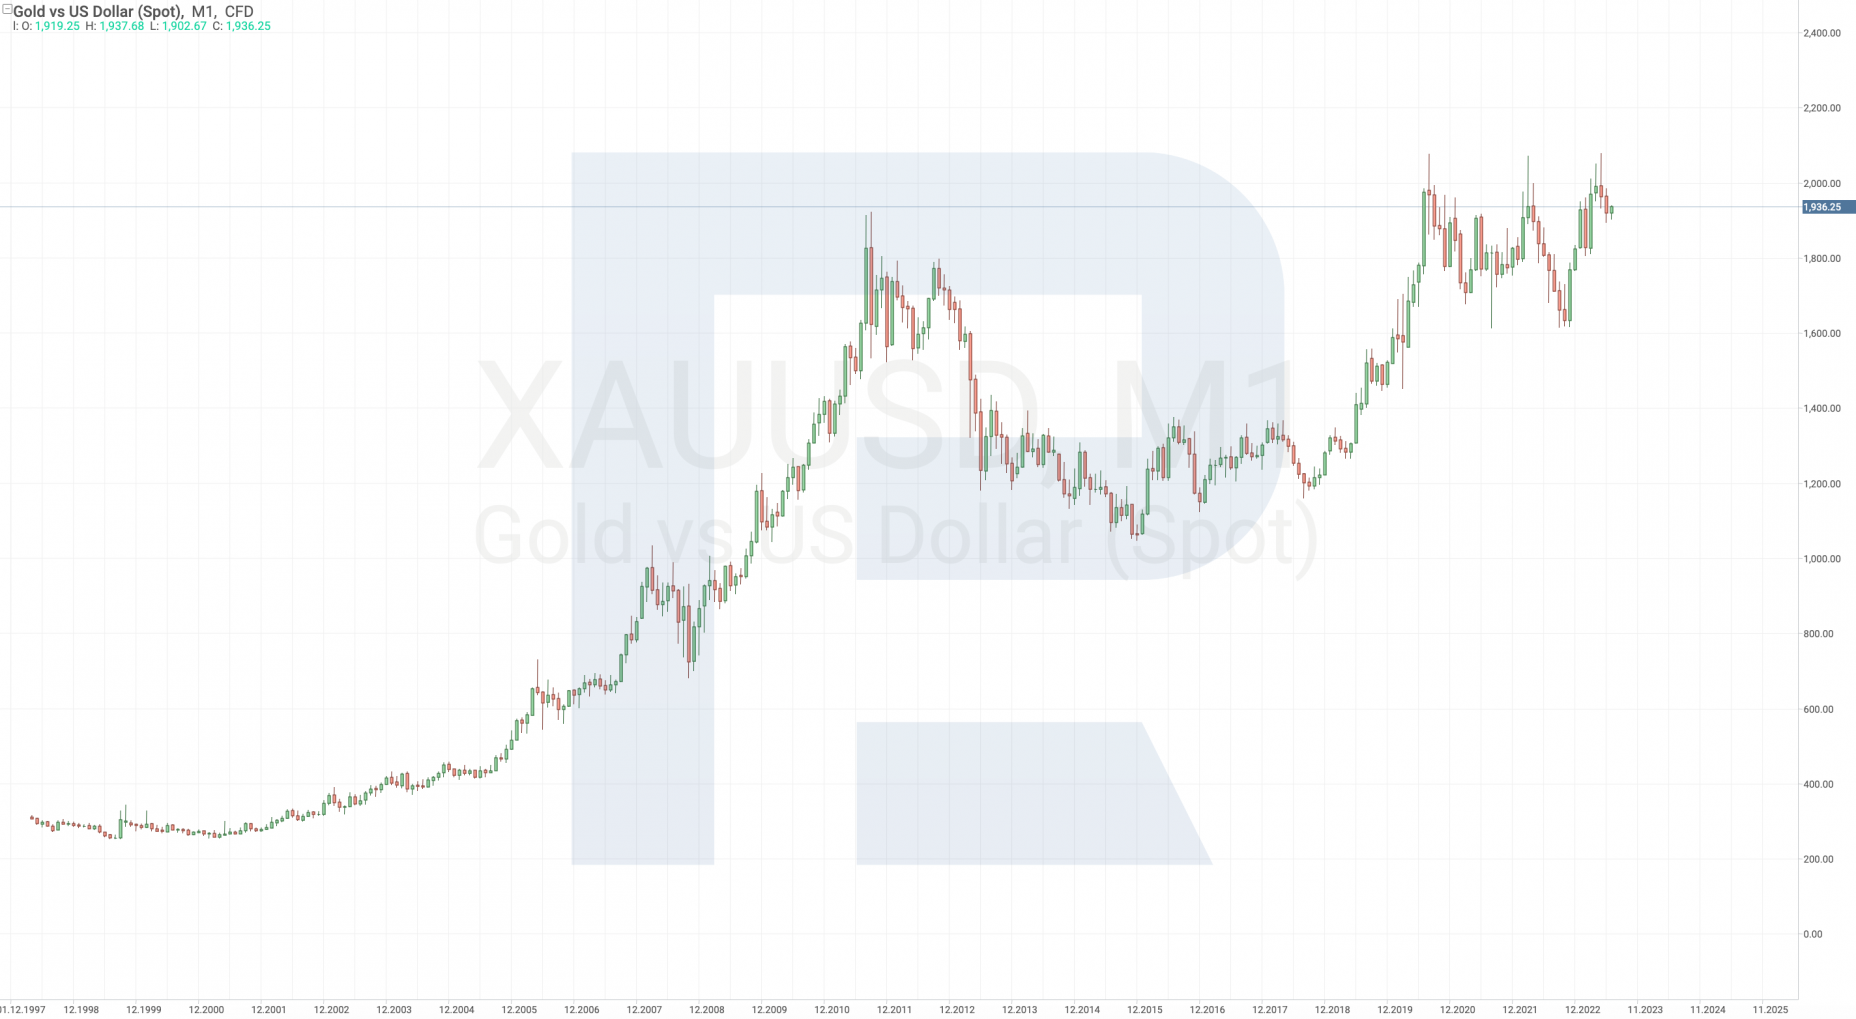
The most popular way of creating a basket (portfolio) of instruments is finding a group of underpriced instruments, counting on their subsequent growth. The instruments can be stocks, currency pairs, ETFs, etc. A bright example is the portfolio of legendary Warren Buffett: he invests in the most promising stocks.

Basket Trading presumes trading one or several baskets of interrelated instruments. The peculiarity of this method is that it helps to diversify risks and create a market-neutral portfolio that helps you make money regardless of the market conditions and a certain trend. Let us discuss some strategies of Basket Trading.

How to do Basket Trading?

There are two main strategies of Basket Trading: investment (trendy) and market-neutral (arbitrary).

Investment strategy

This is a trend strategy that uses a basket of instruments. It is good for various investment ideas and helps to diversify risks. Instead of investing in one asset, we proportionally divide our capital among several instruments. As a rule, such instruments are interrelated and have similar characteristics.

In the stock market, this means investing in several similar companies instead of just one. For example, you expect stocks in the healthcare sector to grow supported by the fight with the coronavirus. Instead of investing in just one famous company, it will be wiser to put your money in several companies in the sector. This will help to avoid corporate risks – the stocks of one company might get stuck due to some inner reasons while the rest are likely to live up to your expectations.

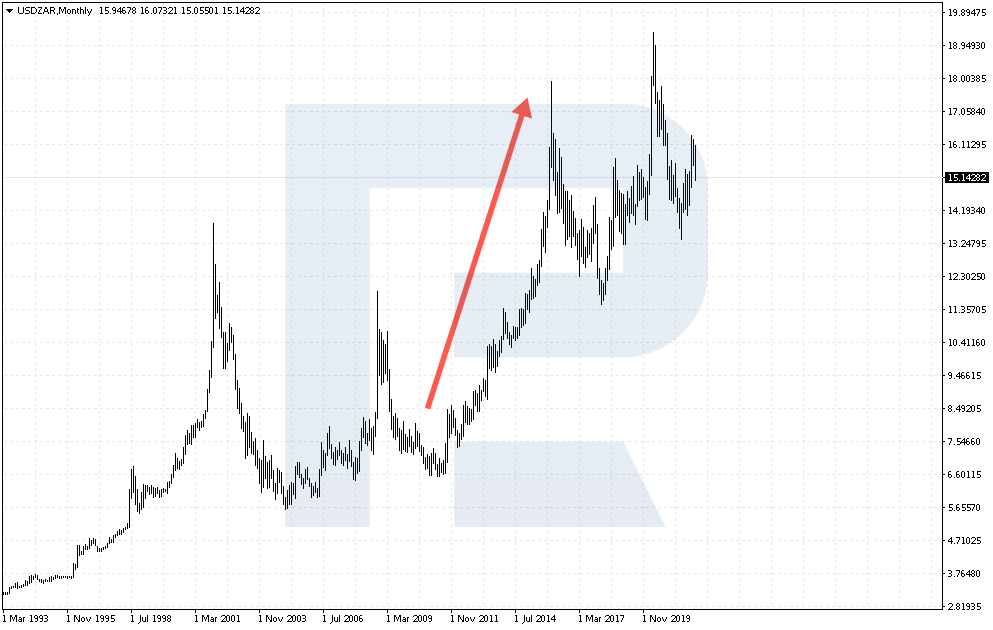
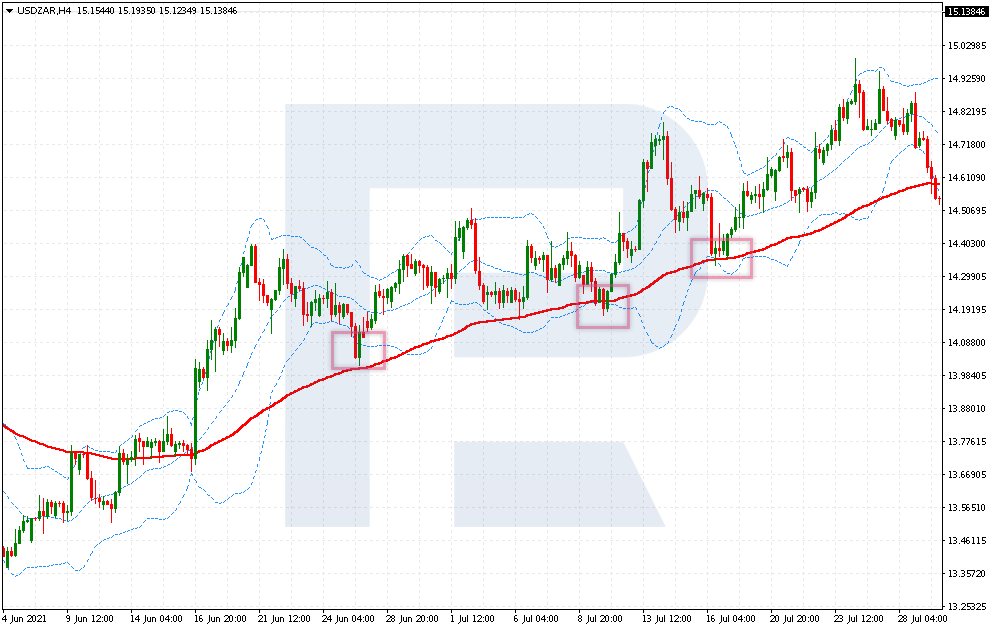
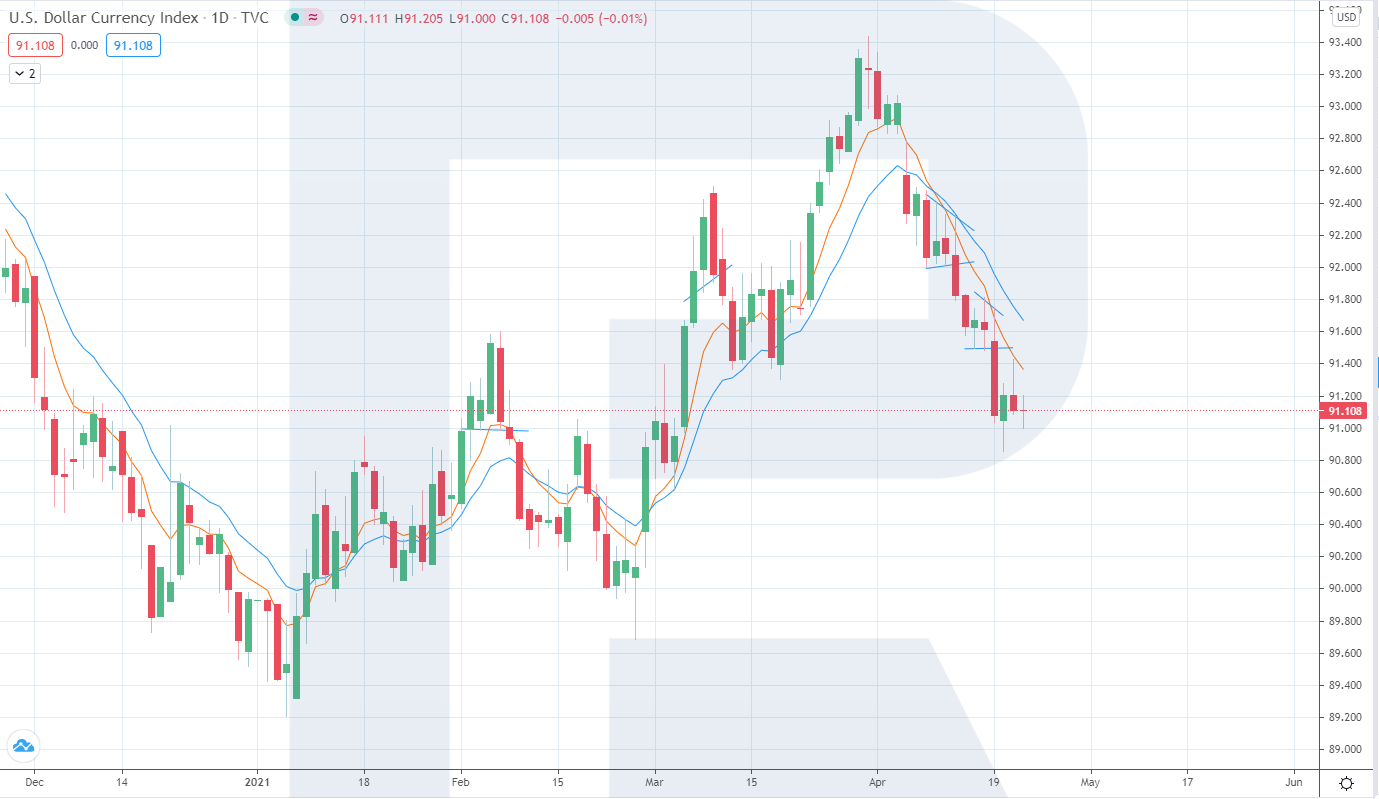
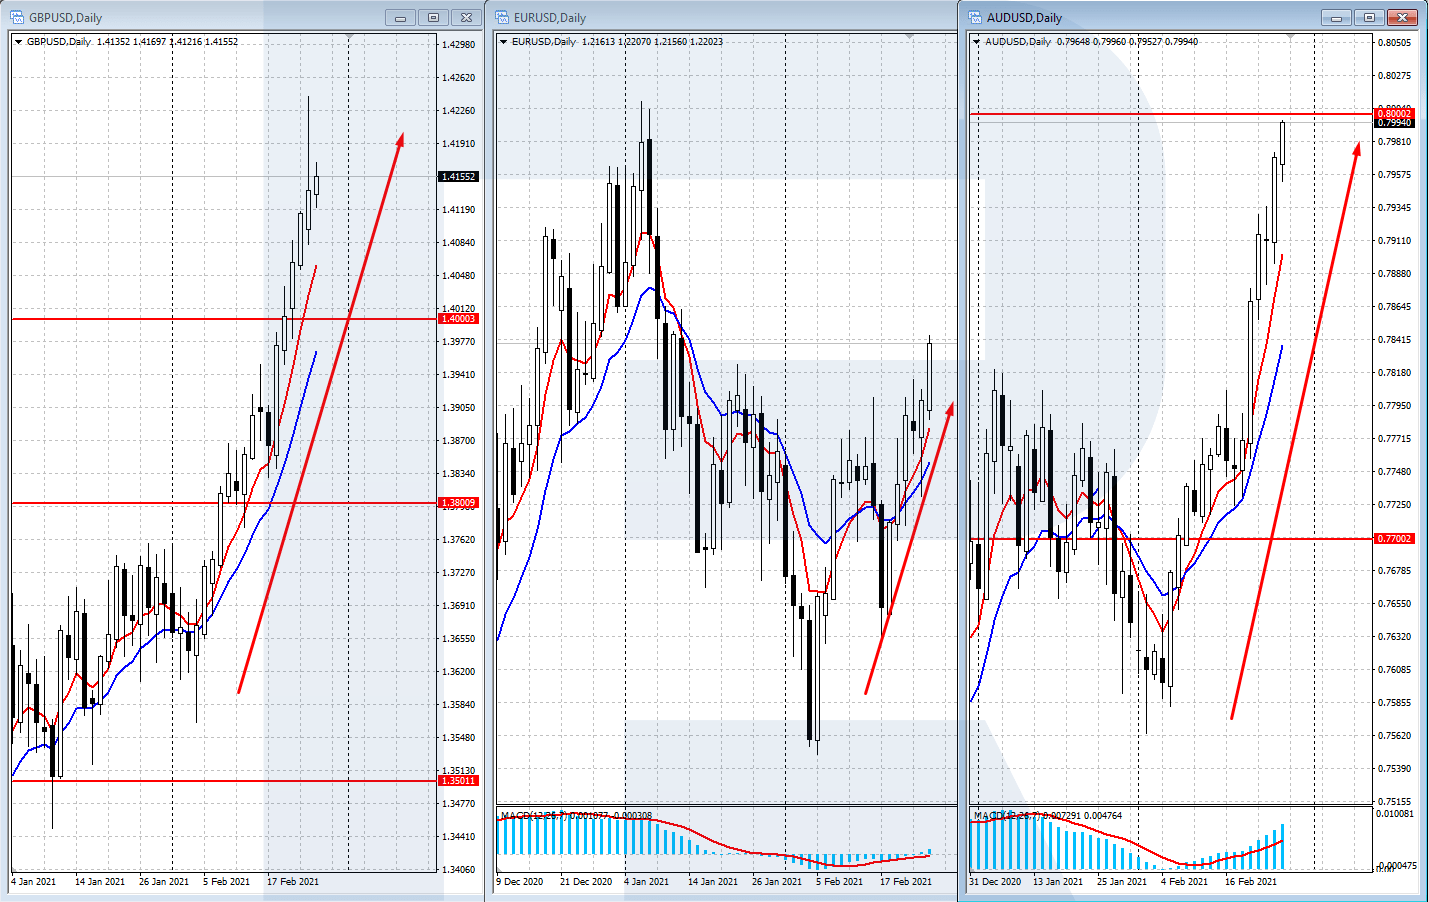
In the currency market, this means trading several currency pairs, not just one. For example, fundamental analysis tells you that the US dollar will be declining in the nearest future. Instead of selling the dollar in just one currency pair (say, with the euro), you can use a basket of several currencies. For example, EURUSD, GBPUSD, AUDUSD (and more) simultaneously. As a result, you decrease the risks of investing in just one currency pair.


Market-neutral strategy

This strategy suggests buying and selling several interrelated instruments at once. The idea of the strategy is to track the difference in the prices of correlating instruments and use deviations of the price from the average to open positions in opposite directions. The hope is that after the deviation, the price will go back to average, bringing you a profit.

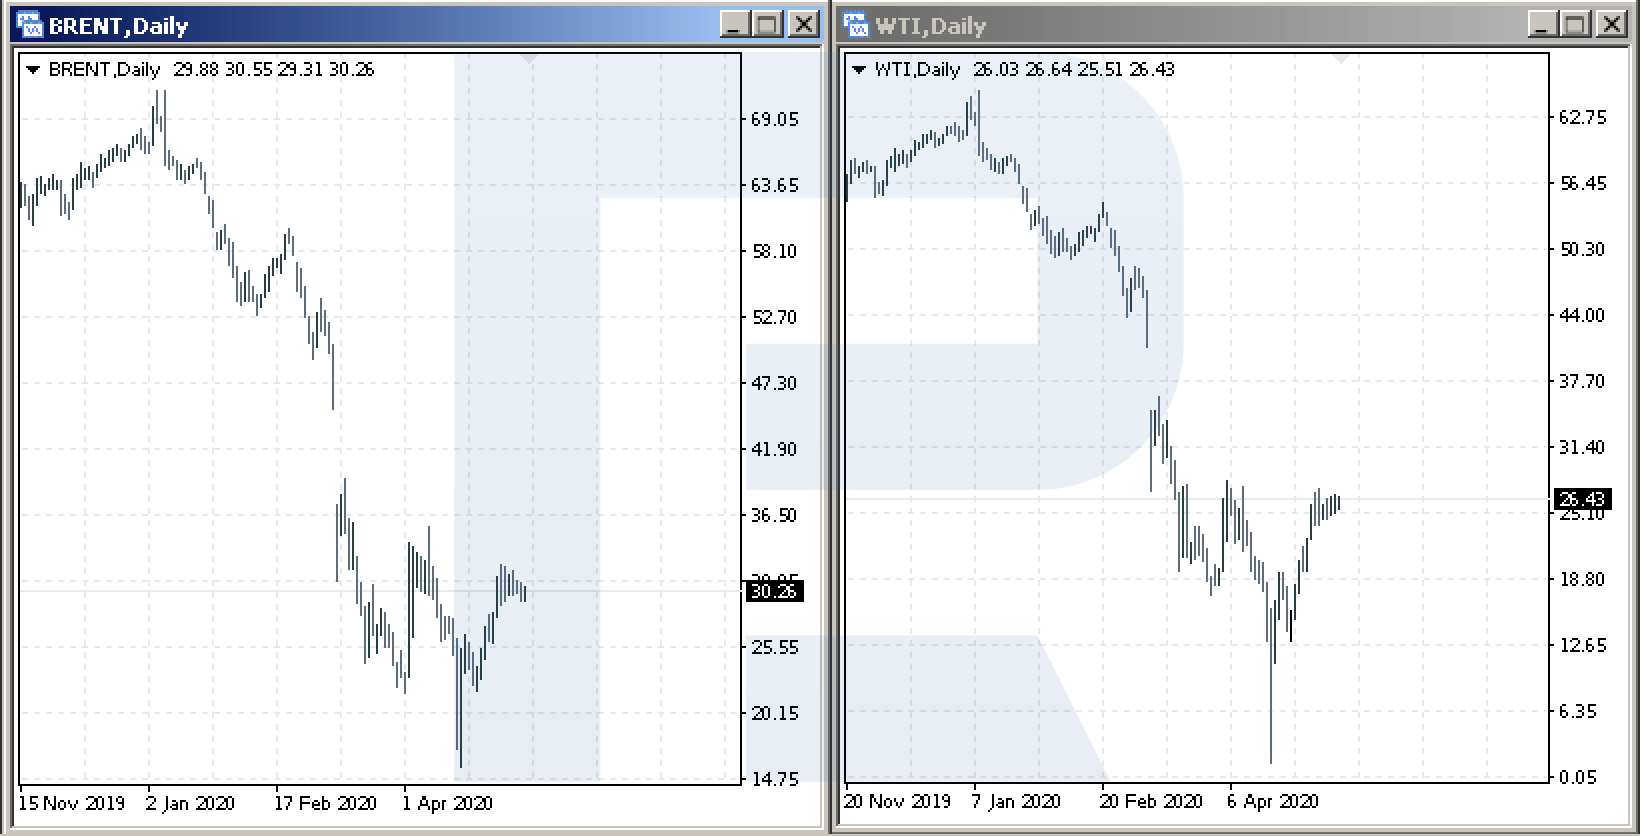
In the stock market, you can sell the stocks of several companies that have already shown decent growth and simultaneously buy a corresponding number of the stocks of companies from the same sector that have just started to grow. You expect the stocks that have leaped up will stabilize or even correct a bit while those that are just at the start will catch up; thus you will take the aggregate profit when the price difference of these two baskets decreases.

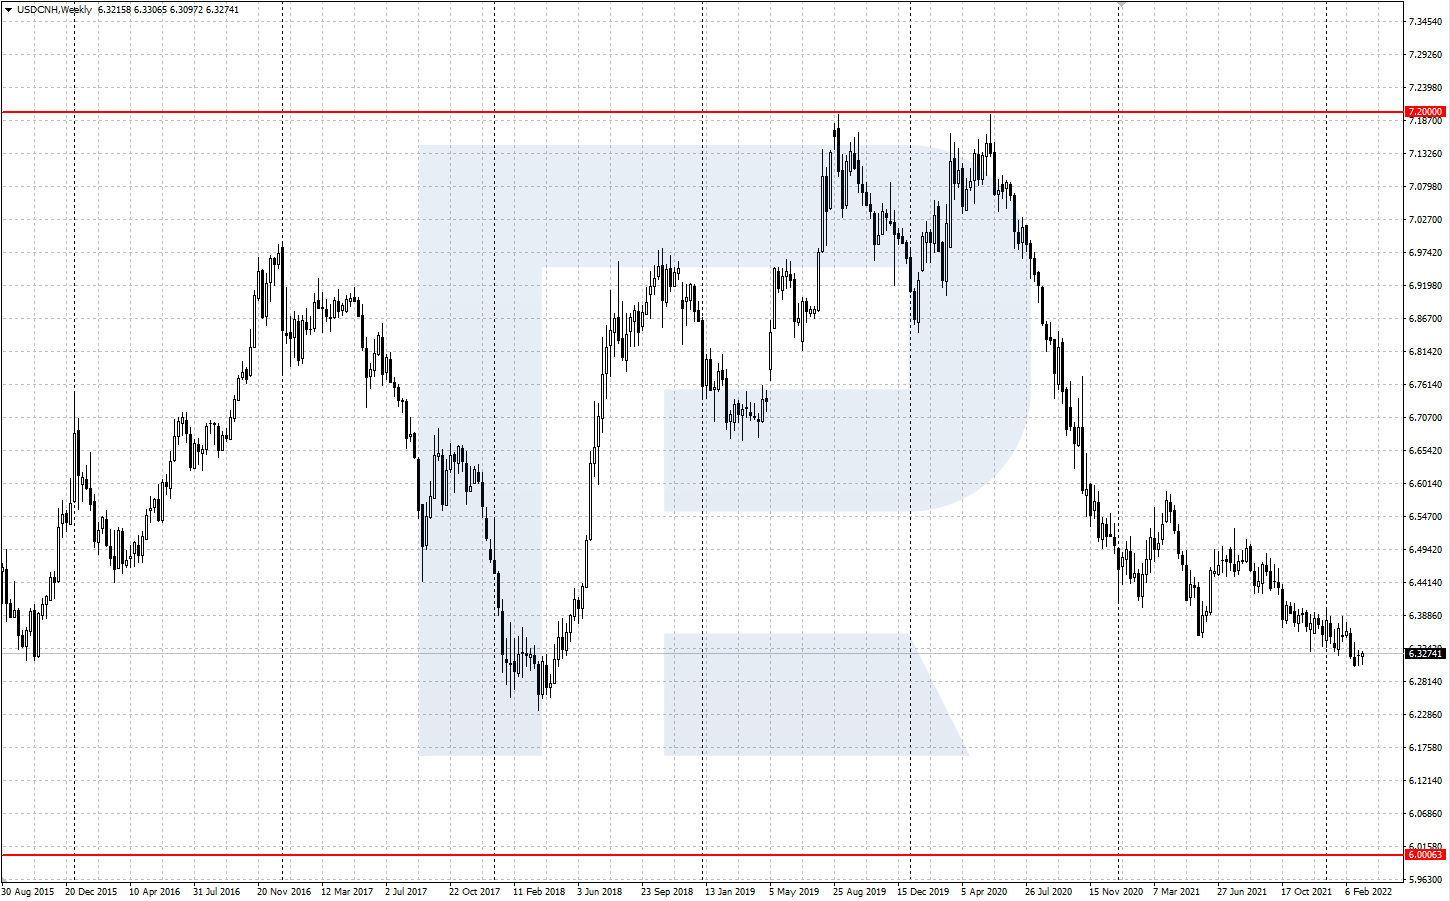
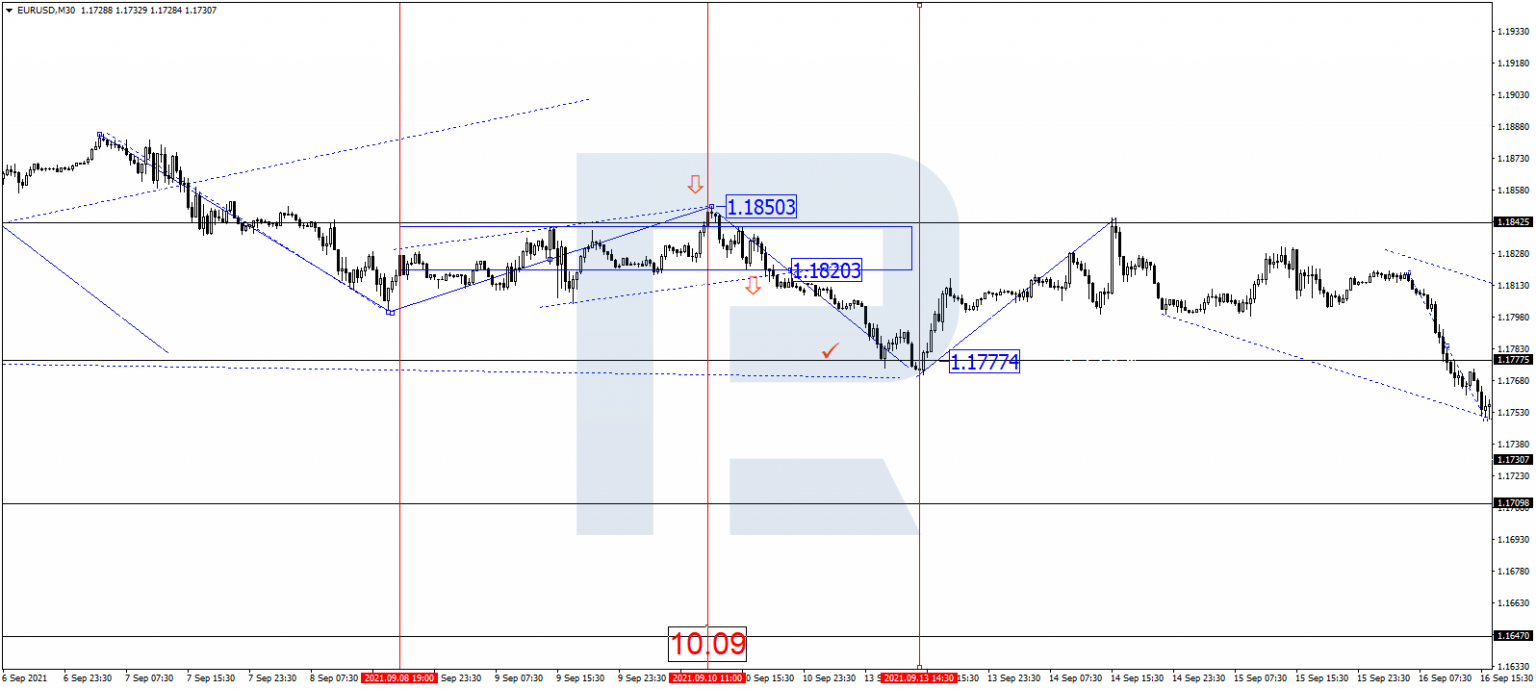
In the currency market, this can be a basket of opposite positions in currency pairs. For example, if the pound has gone down significantly in pairs with other currencies but is expected to grow, you can buy GBPUSD and sell EURUSD and AUDUSD in proportions, corresponding to the price and volatility of the pairs. This makes the positions market-neutral towards the USD.

Advantages and drawbacks of Basket Trading

Like other trading methods, Basket Trading has its advantages and drawbacks.

Advantages
  • Diversification of risks. When we use a basket of instruments, we become less dependent on the dynamics of each of them. If your forecasts are correct, “successful” stocks will pull in tow the “unlucky” ones.
  • The use of market-neutral strategies based on the correlation of the assets you use – they are less sensitive to changes in market trends.
  • It is suitable for a wide range of assets and markets (Forex, stock, commodities, etc.).
Drawbacks
  • The method is complicated as you have to keep an eye on several instruments at once.
  • Risk increases when something extraordinary happens in the market. Statistical laws and interrelations that worked for you before might cause losses when conditions change.
  • You need to use some special software (scripts, expert advisors, indicators).
Read more at R Blog - RoboForex

Sincerely,
The RoboForex team
 
Debt to Equity Ratio: What Do Debts Mean?

Author : Maks Artemov


Dear Clients and Partners,

There are plenty of instruments for analysing companies, financial ratios among them. Today I am speaking about one of them — the Debt to Equity Ratio, or Debt/Equity.

It demonstrates the ratio of the capital that the company owns to the one it loans. Simply speaking, it is the debt of the company divided by its equity, just as the name goes. The multiplier helps to understand what comprised the assets of the company. In certain cases, D/E is also called financial leverage.

The ratio is useful for checking the current financial situation of the company, whether it will be able to develop in the future, and whether it will generate profit.

How to calculate Debt to Equity

The formula for D/E is as follows:

Debt to Equity Ratio = Liabilities / Assets
  • Assets of a company are all the money it has.
  • Liabilities are all the money is borrows (credits, loans, debts).
  • Short-term liabilities are used for paying off cash gaps. They are to be paid off within a year which makes them "cost" more.
  • Long-term liabilities are used for bringing to life large projects. They are to be paid off within several years which makes them "cost" less. In other words, accounting for inflation, the more time passes since the time when the money was borrowed till the moment it is to be returned, the less this debt costs.
Information about liabilities and assets can be found in the financial reports of the company in the Balance Sheet Liability section.

Note that not always the fact that the company has certain debts is negative for it. Loaned money facilitats restructuring, development, mastering new technology, and expanding the business. All this can potentially yield a profit. In short, even huge and successful corporations sometimes loan money for business development.

What D/E means
  • When D/E is zero, the company does not use loaned money, only its own assets. This is not always a good sign. We can conclude that the management is cautious about finance and in the future the company might make less profit than it could. As a rule, such companies develop slowly, but enjoy market stability. Your invested money will bring a modest yet constant profit.
  • Above zero: this means that the company does loan some money. With such D/E, companies can potentially increase their profits. However, you need to know what they spend the loaned money on. The company might be covering up older debts, getting deeper in financial trouble. Nonetheless, companies tend to use their loans wisely.
  • Above one: the company loans more money than it has. If it does not have enough to pay off its debts, it might end up as a bankrupt.
Which D/E is optimum

The answer depends on the sector that the company works in. The conditionally optimum level is 0.5-0.7. This means that the company uses the financial leverage correctly and has some future. In exceptional cases, the optimum D/E is taken as 1.

Advantages and disadvantages of D/E

The advantages are:
  • It helps to compare companies by the ratio of their own money and debts;
  • It shows whether the company loans money rationally;
  • It demonstrates the solvency of the company;
  • It helps to assess the perspectives for the development of the company.
Drawbacks:
  • It does not allow comparing companies from different sectors;
  • It seriously differs for companies from the same sector but different countries;
  • It needs fresh info about liabilities and assets that is normally published once in a quarter.
Read more at R Blog - RoboForex

Sincerely,
RoboForex team
 
RoboForex: upcoming changes to the trading schedule in view of Independence Day


Dear Clients and Partners,

We are informing you that changes will be made to the trading schedule due to Independence Day in the US.

This schedule is for informational purposes only and may be subject to further change.

MetaTrader 4 / MetaTrader 5 platforms

Schedule for trading on Metals (XAUUSD and XAGUSD), CFDs on US Indices (US30Cash, US500Cash, and USTECHCash), the Japanese index J225Cash, and CFDs on oil (Brent and WTI)
  • 3 July 2023 – trading stops at 7:40 PM server time
  • 4 July 2023 – trading stops at 7:40 PM server time
  • 5 July 2023 – trading as usual
Schedule for trading on CFDs on US stocks and CFDs on US Futures
  • 3 July 2023 – trading stops at 8:00 PM server time
  • 4 July 2023 – no trading
  • 5 July 2023 – trading as usual
R StocksTrader platform

Schedule for trading on US stocks and ETFs
  • 3 July 2023 – trading stops at 8:00 PM server time
  • 4 July 2023 – no trading
  • 5 July 2023 – trading as usual
Schedule for trading on CFDs on US stocks, ETFs and US Futures
  • 3 July 2023 – trading stops at 8:00 PM server time
  • 4 July 2023 – no trading
  • 5 July 2023 – trading as usual
Schedule for trading on CFDs on US indices (US500, US30, and NAS100) and the Japanese index JPY225
  • 3 July 2023 – trading stops at 7:40 PM server time
  • 4 July 2023 – trading stops at 7:40 PM server time
  • 5 July 2023 – trading as usual
Schedule for trading on Metals (XAUUSD and XAGUSD) and CFDs on oil (WTI.oil, BRENT.oil)
  • 3 July 2023 – trading stops at 7:40 PM server time
  • 4 July 2023 – trading stops at 7:40 PM server time
  • 5 July 2023 – trading as usual
cTrader platform

Schedule for trading on Metals (XAUUSD and XAGUSD)
  • 3 July 2023 – trading stops at 7:40 PM server time
  • 4 July 2023 – trading stops at 7:40 PM server time
  • 5 July 2023 - trading as usual (close Only)
Please take note of the above trading schedule changes when planning your trading activity.

Sincerely,
The RoboForex team
 
How to Trade Crude Oil? Full Guide for Beginner Traders

Author : Andrey Goilov


Dear Clients and Partners,

There are several ways of trading oil; an individual trader may choose from futures, CFDs, and options. Whatever type of contract you choose, you will have to analyze the chart of your asset and only then open a position: a buying one if you expect the crude oil to grow or a selling one if you think it will decline.

In most cases, the traders who work in MetaTrader 4 stick to currency pairs, leaving behind crude oil or gold. However, these instruments are especially interesting because they are "technical"; moreover, oil charts tend to react better to various graphic patterns than currency charts.

In this article, we will talk about the peculiarities of trading oil so that everyone could understand what is this asset like and how to trade it.

WTI and Brent: what is the difference?

There are several types of oil coming from different oilfields and differing in the quality and other properties. Today, the standard of oil price is the crude oil named Brent; it is produced in the North Sea and sold in Asia and Europe. Futures for this crude oil type are most popular in the world.

WTI crude oil is produced in the USA, in West Texas and mostly sold in the Western Hemisphere. The Brent and WTI prices did not probably differ too much until 2011. Since then, the WTI price has become much higher due to expensive transportation; at the moment, the difference could reach $10 or more.


At present, the difference between the two prices amounts to $5. However, most contract with real supply is signed for the WTI brand - that is why the futures fell to -$40 at the moment when there was little demand. Another important difference is the fact that Brent is denser and contains more sulfur.

What factors influence the oil market?

If you crave for making money on oil, it is vital to know the factors that influence the oil market. They are as follows.

Demand and supply

There is a viewpoint that it is the demand data that forms market trends; however, quality data on oil consumption and shortage is scarce. There are just the statistics of OPEC and Baker and Hughes. Anyway, it is clear that when the world needs oil and increases production, the price also goes up. In the current situation of the world pandemics and a decrease in production and consumption all over the world, oil prices fall. As soon as the market gets back to normal, the prices will be able to start quality growth thanks to an increase in demand.

Quotas for crude oil production from OPEC

Thanks to the decline in crude oil production by the agreements signed at OPEC meetings, oil prices grow. The aim of the organization is exactly keeping the prices stable. As you know, when Saudi Arabia and Russia failed to agree at one of the meetings, oil prices slumped. This was the market reaction to the price war between the two countries and their unwillingness to reduce production. However, the countries came to an agreement later, so there is a chance for a bullish trend in the market.

Read more at R Blog - RoboForex

Sincerely,
RoboForex team
 
Mentoring in Trading: Why People Do It, and How to Choose a Tutor?

Author : Vadim Kovalenko


Dear Clients and Partners,

Mentoring has become quite popular these years. In the center of this movement we can encounter experts that for some fee help other people make a career, develop skills, and avoid typical mistakes in certain branches of knowledge.

The advantage of this method of education is that the student can get knowledge filled with practical skills. In trading, these services are also popular. With it, some managers started off as experts and even opened schools of trading and investments.

However, beginners are wondering how to choose a mentor. People take different ways of doing it: some find a mentor at once, some start off with self-education. In the latter case, fees are charged by the market in the form of losses that traders experience for mistakes. This article is devoted to the details of mentoring in trading: why experts for it and how a beginner should choose a tutor.

Why should an experienced trader teach someone

When a beginner starts looking for a mentor, they encounter ads of many traders who, in their turn, demonstrate impressive results and sums with many zeros. A question appears: why do they need to teach someone else and take more eyes for this? To my mind, there are several reasons:

1. New source of income
If a trader charges fees for learning, this means they want a compensation for their time and effort they could spend on trading. Hence, such lessons cannot be cheap. Moreover, this way managers can make money on attracting people — their students — to partnership programs of brokers. This is how traders make money on their trading. Most often, students become investors and increase the capital of their manager.

2. Vanity
Human qualities are also their in traders, and many of them crave for social recognition. They enjoy happy feedback from former students. Some managers just enjoy the process of teaching.

3. Enthusiasm
There are categories of people who are eager to be useful for the society. Such experts are few, but enthusiasm can also drive people into mentoring

I will single out special cases when people cannot trade successfully for psychological reasons. Excitement, lack of mental balance, emotional unstability are the reasons for negative trading history. Howevee, they have pedagogical experience, experience, and knowledge. On the other hand, such traders are hard to distinguish from frauds that seek likes and subscribers in social networks.

How to choose a mentor?

Understanding the motives that drive traders into teaching, let us find out how to choose a good mentor.

Firstly, make up your mind about your goals. Do you need to learn the basics or make your trading better? In the first case, when you need the basics, there is no reason for seeking help of an experienced trader. On the Net, there are plenty of free materials that can help you find your way through the main notions and categories. Then you can practice on a demo account, then switch to a cent account, and then decide on your trading style depending on your character. Thus you will get some experience, positive or not.

Choosing a mentor, check for not only their results but also the type of their trading system. If you are psychologically uncomfortable with scalping, there is no reason for learning from a scalper as you will have no result.

Price and length of learning

The price of your learning will depend on the expertize of your trader. I advise you against courses cheaper than 150 USD for group learning. As I wrote above, the manager will try to compensate for the time they spent on the students. Moreover, the price will be influenced by the number of successful students and the profitability of their trading.

As for the length of learning, you will need no less than 3 months. Get ready for the way to be long. Optimum length is 6 months.

Read more at R Blog - RoboForex

Sincerely,
RoboForex team
 
How to Trade USD/CNH

Author : Victor Gryazin


Dear Clients and Partners,

The US dollar against the Chinese yuan is quite a specific currency pair in Forex. This article is devoted to its trading peculiarities and formation of its exchange rate.

Some info about China and yuan

People’s Republic of China is an Eastern Asian country, number three in the world in terms of area and number one in terms of population. Since 1949, the country has been ruled by the Communist party of China.

The Chinese economy is based on both planned distribution economy and market economy alongside numerous foreign investments. Today China is the country with the second-largest GDP after the US. Many experts expect it to become number one quite soon.

China is the largest manufacturer and exporter of various goods. Thanks to a wide spectrum of economic connections, the Chinese yuan is quite a demanded currency. It is necessary for economic operations with the country. It is included in the special drawing rights basket of the IMF, which makes it a reserve currency.

Inside the country, the yuan is called “people’s money”. The monetary policy is carried out by the Central bank of the country, People’s Bank of China. All changes of the official exchange rate of the yuan are tracked and regulated by the Bank and only partially depend on market conditions.

Before 2005, the exchange of the yuan used to be strictly bound to the US dollar rate: 1 USD = 8.27 CNH. Now the rate is bound to a special currency basket comprised of currencies of 13 countries. The yuan is traded in Forex but its fluctuations are limited by 2% of the exchange rate set by the Chinese Central bank. Since 2010, the USD has been fluctuating between 6 and 7 CNH .


USD/CNH peculiarities

The peculiarity of the yuan is that it has two parallel exchange rates: its official domestic rate (USD/CNY) and international one (USD/CNH). The rate with the ticker CNH was introduced by the Central bank of China and the government of Hong Kong to attract international investors. The official yuan rate (CNY) is firmly regulated by the government and meant only for use inside the country.

People’s bank of China publishes the official exchange rate (Central Parity Rate) every day. This is the ratio of the yuan and the currency basket. USD/CNY and USD/CNH fluctuations cannot exceed 2% of it. When the border of the range is reached, the Central Banks intervenes, regulating further movements of the currency.

Trading characteristics of USD/CNH
  • Trading time. The pair trades 24 hours a day except weekend, with the main activity during the Asian and American sessions.
  • Volatility. Volatility is high, about 150-200 points a day. However, the range is limited by the Chinese CB.
  • Spread. The spread is moderate as this pair is not the most volatile one in Forex. On popular ECN accounts, spread is normally about 3-4 points.
How to trade USD/CNH by fundamental analysis

Firstly, the trader should keep an eye on the monetary policy of the Chinese regulator: this is the key factor that forms the exchange rate.

Thanks to the robust growth demonstrated by the Chinese economy, the yuan has all the chances to grow against the dollar. According to economists, it is now seriously undervalued. China holds back the rate because it is highly oriented on export: it is more profitable for the country to have a low exchange rate of its national currency than to stimulate demand for its goods.

Hence, the Chinese CB prevents the national currency from growing too much. The current range is between 6 and 7 CNH per 1 USD, so take these levels as the landmarks for long-term trading.

Read more at R Blog - RoboForex

Sincerely,
RoboForex team
 
How to Trade USD/ZAR

Author : Andrey Goilov


Dear Clients and Partners,

USD/ZAR — US dollar vs South African rand — is quite an exotic currency pair, not really popular among traders. Trading this asset has certain peculiarities and internal laws.

Some say that, compared to other pairs, this one is less liquid. However, on the D1 of USD/ZAR one could see a lengthy uptrend from the end of 2011 till the beginning of 2016. That time the quotations rose from 6.40 to 17.97, then declined several times in the form of corrections, and then started growing again.


At the very first glance you can see that USD/ZAR is capable of strong movements. And not only ascending ones that prevail but also lengthy declines. Do you want to know right now how to trade this currency pair, making use of all its characteristics? Let me tell you.

Trading characteristics of the currency pair

The pair reflects the relation of the US dollar to the South African rand. When I was preparing this article, you could buy a bit more than 15 ZAR for 1 USD. The growth of the pair means that the dollar is becoming stronger, and falling means that the rand is growing.

Trading characteristics:
  • Trading time. The pair trades 24 hours a day on weekdays. Volatile movements take place during the European session.
  • Volatility. Assessed by the ATR, it reaches 230 points a day on average. Minimal ATR levels were reached in the middle of 2021 and maximal — in July 2020. The difference is quite noticeable — the low was 180 points and the high was 380 points, all these during one year.
  • Spread. It is quite low, reaching about 0.8 points at the calm market.
How to trade USD/ZAR

The currency pair can be traded by indicators, levels, and graphic patterns.

Trading by indicators

The pair is trendy, so a combination of Moving Averages will yield good results. You can choose tactics from the article “Top-7 Forex Trading Strategies in 2022” If you want something unique, add to the chart an EMA (95) and Bollinger Bands. Use an H4 chart.

Buying rules
  • The price has secured above EMA (95) – this indicates a bullish trend.
  • The price tests the lower border of the Bollinger Bands indicator that shows the lows.
  • Place a Take Profit at the upper border of Bollinger Bands.
  • The Stop Loss will be two times smaller than the TP.

Selling rules
  • The price has secured below EMA (95) – this indicates a bearish trend.
  • The price tests the upper border of the Bollinger Bands indicator that shows the highs.
  • Place a Take Profit at the lower border of Bollinger Bands.
  • The Stop Loss will be two times smaller than the TP.
Read more at R Blog - RoboForex

Sincerely,
RoboForex team
 
Gold Price Forecast for 2023: Analyzing the Potential for Continued Growth

Author : Andrey Goilov


Dear Clients and Partners,

As at the time of writing, the price of gold dropped by more than 8% from its all-time high of 2,081 USD per troy ounce, which was recorded on 4 May 2023. However, investors are not losing interest in the precious metal. In addition, record purchases by central banks over the past year give hope for a further potential rise in the asset price.

Today we will talk about the current price of gold, how prices have changed in the past and what values they can reach over the next few years. We will examine the main factors affecting the fluctuations in the gold price, specify drivers of possible growth of its quotes, and carry out a technical analysis of the price chart.

How did gold prices change earlier?

Gold was discovered by the ancient Egyptians over 4,000 years ago. They used it to create jewellery and religious items. For the Romans, gold was a symbol of status and power, and it was used to decorate crowns and statues. In the Middle Ages, gold coins were the main means of trade and international exchange. In later periods of history, this metal became the basis of the monetary system.

During the period of the gold standard, since 1887, the US government fixed the gold price at 20.67 USD per troy ounce. Following the abandonment of the gold standard and dollar devaluation in 1933, the cost of the ounce increased to 35 USD and remained at this level until 1967.

In 1971, US President Richard Nixon finally abolished the gold backing of the US currency, which resulted in a significant increase in the value of the precious metal. In the early 1980s, the price reached a record level of 850 USD per troy ounce, but over the next nearly 20 years, it was steadily going down.


Gold started to rise in price in 2001 amid financial crises, geopolitical tensions, and market uncertainty, with the quotes hitting a new all-time high of 1,920 USD in 2011. From 2012 to 2016 inclusive, the quotes went down to 1,000 USD. Since mid-2018, the prices resumed their upward movement and reached the level of 2,075 USD in 2020, hitting a new record high of 2,081 USD in 2023.

Why invest in gold
  • Hedge against inflation. The reserves of this resource and its mining are limited, and therefore its value grows during periods of high inflation when fiat currencies are rapidly depreciating
  • Reserve asset. During periods of instability, financial and geopolitical turmoil, investors invest in gold to protect their investments from risks and maintain stability
  • Portfolio diversification. Adding gold onto a portfolio reduces the overall risk level for the investment portfolio, as gold prices are characterised by a low correlation with the value of stocks, bonds, and other assets. Conditions are being created to mitigate portfolio volatility
The main drivers of gold prices in 2023

Central bank purchases

According to the World Gold Council (WGC), demand for gold from central banks hit an all-time high in 2022, amounting to 1136 tonnes. This is the highest reading over the entire history of monitoring since 1950. Already in the first quarter of 2023, the demand from central banks reached a level of 228 tonnes, which is 176% higher than in the first quarter of the previous year.

According to the data obtained, experts expect an upward trend in demand to persist throughout the year. The WGC survey showed that 24% of central banks are ready to increase their gold reserves in the near future, which can lead to a rise in gold prices.

Jewellery demand

According to the WGC, the fourth quarter of 2022 saw heavy demand for gold jewellery – over 630 tonnes. In the first quarter of 2023, the demand increased by 1% to 448 tonnes compared to the Q1 2022 statistics.

Despite the overall aggravation of the global economic environment, jewellery production and consumption remain at a high level, with the demand over the past ten years ranging between 840 and 2,100 tonnes a year.

Read more at R Blog - RoboForex

Sincerely,
RoboForex team
 
How to Use EIA Oil Report in Trading

Author : Victor Gryazin


Dear Clients and Partners,

This overview is devoted to the weekly EIA report about the situation in the oil market that influences the quotations of black gold quite a lot. Many traders keep a close eye on this publication and use the information in trading.

What is the EIA report

Energy Information Administration (that EIA stands for) is a department of the US Ministry of Energy created in 1977. It is responsible for objective collection of energy data, analysis, and economic forecasts. The department regularly publishes various reports on the topics around energy. Among them, there are reports on energy carriers reserves, demand for them, and prices.

The United States are not only the largest consumer of oil (consuming about 20% of global oil) but also the leading oil producer. The supply and demand balance in the USA gives a rough idea of the oil market on the whole. Traders, investors, and other market participants follow attentively oil statistics from the USA. Publication of these data is quite often followed by serious market volatility.

One of the most popular EIA reports is the weekly report on the state of the oil market called This Week In Petroleum. This report is published every Wednesday and contains comments on changes in oil reserves, demand, and other parameters of crude oil and oil products. If there are some unexpected major changes about crude oil and petroleum in the report, the market might react dramatically.

Which info is there in the report?

Investors and oil traders study the EIA report very carefully to use the data for forecasting the behaviour of prices for energy carriers. Analysts from energy companies also use the report to collect data that help them develop long-term business strategies.

The information published in the EIA report:
  • Domestic Production: production level of the previous week in the US. This is prelim estimation that can be mended later.
  • Percent Operable Utilization: if refineries work at their most, this might indicate increased demand for oil products.
  • Crude Oil Inventories: this is the most important part of the report that represents the changes in oil reserves in the US.
  • Total Motor Gasoline Stocks: obviously, this represents changes in gasoline stocks. This parameter is seasonal: in summer, demand for gasoline grows, which might be reflected in a decrease in the stocks.
  • Distillate Fuel Oil Stocks: represents changes in the stocks of crude oil products.
  • Crude Oil Import: represents – obviously – changes in the import of oil in the US. An increase in the import can sometimes lead to the growth of oil inventories.
  • Crude Oil Export: represents the dynamics of oil export from the US. This parameter has been growing since a couple of years ago.
The key parameter is Crude Oil Inventories. If the report represents a higher parameter than had been expected, this means the demand is weak, and oil quotations become stressed out. A decrease in oil inventories means that the demand has got higher than the supply and helps oil prices grow. Crude Oil Inventories in the US are published weekly on the Economic Calendar.


How to use the report in trading

Oil quotations are influenced by a whole bunch of data, including the EIA report. And as long as the report influences the quotations, investors and traders use it in their work. Investors prefer long-term strategies and traders – short-term ones.

Long-term trading

For planning long-term trading which means holding an open position for weeks or months, traders analyse the reports over a certain period.

For example, they can check for a downtrend or uptrend in oil inventories over several weeks or serious deviations from the average over several years.

Though weekly EIA reports provide data important for understanding oil supply and demand balance in the US, investors also have to be attentive to the international situation.

Short-term trading

Trading strategies used for short-term trading on changes in oil reserves in the US have little differences to the general principles of trading news. When the data is published, short-term momentum movements of the quotations emerge, and they can be used for trading.

The direction of trading is chosen based on the current market situation, the technical picture, and data published in the report. Use tech analysis to detect the trend and draw the nearest support and resistance levels.

Read more at R Blog - RoboForex

Sincerely,
RoboForex team
 
What is Market Sentiment in Forex, and How It is Used in Trading

Author : Victor Gryazin


Dear Clients and Partners,

In this overview, I will get you acquainted with such a notion as market sentiment in Forex. It helps confirm the current trend and warns you of its probable end.

What is market sentiment?

The market sentiment means the prevailing mood of most market participants at a certain moment. The word “sentiment” is of French origin and means “feeling, mood”. Market sentiment shows what market participants are currently keen on – buying a financial instrument (a group of assets) or selling it.

In other words, market sentiment is the current balance of traders’, investors’, and other market players’ optimism and pessimism about a certain financial market or asset. This is some sort of collective emotion based on certain expectations. The expectations are formed, as a rule, by the news and various fundamental factors.

For example, if market participants are sure that the stock market will be growing, they start buying shares actively and thus support the bullish trend. On the contrary, if most players are sure that the stock price will be falling, and a bearish trend will appear – they will start selling assets that they expect to decline soon. As a result, market supply will become excessive, making the price drop.

Forex market sentiment shows what most market participants prefer to do now: buy or sell currencies. Traders use such expressions as “buy bucks” - this means traders are ready to buy the USD against other currencies, or “sell bucks” - which means traders are ready to sell the USD against other currencies.

Market sentiment and expectations are influenced by several factors. Factors that support the currency rate form positive sentiment (moods to buy). Factors that drive the currency down form negative market sentiment (moods to sell). Check below the factors that influence Forex market sentiment.

What factors influence Forex market sentiment?

Market sentiment is mostly influenced by so-called fundamental factors. They include various financial, economic, and political events that influence directly currency rates. Such factors are studied by fundamental analysis. Here are the most important of such factors:
  • Monetary policy of Central banks: cycles of increasing and decreasing the main interest rate can form long-term uptrends and downtrends in the national currency. If market players expect the rate to grow, the market sentiment will be bullish: market players will be ready to buy. If a decrease in the interest rate is expected, things go vice versa.
  • Economic factors: if the news about the country’s economy is positive (GDP, employment, production, etc.), market sentiment about the currency improves.
  • Political factors: elections, government resignations, scandals, sanctions, etc. can form negative market sentiment towards a currency.
  • Rumors and expectations: they include political and economic factors but in the form of rumors and expectations.
  • Force majeure: natural disasters, man-made disasters, terror acts, epidemics. All this can form serious negative sentiment towards a currency.
The influence of fundamental factors on Forex market sentiment can be short-term (several minutes to several days) or long-term (several weeks, months, years). For example, information about the growth of unemployment last month can have a short-term negative effect on market sentiment, while an announcement of the CB head about the necessity to increase interest rates can form a long-term positive sentiment to a currency.

Indicators for assessing Forex market sentiment

To detect the current market sentiment, various indicators can be used. They try to evaluate market sentiment and express it in digits or graphically. By them, one can conclude on the current positions and opinions of traders and how they can influence price moves.
Here are three popular indicators for assessing Forex sentiment.

DXY

The DXY (US dollar index) is the main index that shows the current market sentiment towards the leading world’s currency. The direction in which the index goes (the current trend) reflects the actual market balance. The growth of the index means positive market sentiment and the growth of the USD against major currencies, while the decline of the index means negative sentiment and weakening of the major currency.

The DXY is traded in exchanges as futures and options. By tech analysis, you can analyze the chart of the index and detect the current sentiment towards the USD: positive, negative, or neutral. You can find the DXY chart on various informational resources such as tradingview.com.


COT reports on currency futures

A COT (Commitments of Traders) report is a weekly publication showing aggregate positions of various players of futures markets. The COT is published every Friday by the US CFTC. Though this data refers to futures, they correlate strongly with the Forex market.

Read more at R Blog - RoboForex

Sincerely,
RoboForex team
 
RoboForex adds additional MT4 trading servers for its clients


Dear Clients and Partners,

RoboForex launched three new dedicated servers (RoboForex-Pro-5, RoboForex-ECN-3, and RoboForex-ProCent-8) for the MetaTrader 4 platform. This improvement will help to enhance the stability and performance of our trading servers.

The new servers are available for clients with Pro, ECN, and Cent Affiliate account types.

Pro

The most popular account type at RoboForex with optimal trading conditions for traders with different experience levels.
  • Floating spread - from 1.3 pips
  • Leverage - up to 1:2000
  • Trading instruments - more than 100
  • No commission for the trading volume
ECN

An account type for experienced traders which combines the tightest spreads, high execution speed, and competitive trading conditions.
  • Tight spreads - from 0 pips
  • Leverage - up to 1:500
  • Trading instruments - more than 100
  • Commission for the trading volume - from 5 USD
Cent Affiliate is a special type of account which is suitable for partners who provide their clients with certain services. More information is available here.

Open an account
and start trading with competitive conditions


Full details of accounts >​

Sincerely,
The RoboForex team
 
How to Make Money on Stocks Decline?

Author : Andrey Goilov


Dear Clients and Partners,

It is widely thought that any trader can make money on the growing market but if the market is falling, only a few can make use of it. Indeed, falling of the stock price of large companies is interpreted as a good opportunity to buy the stocks and earn money later, on their increase.

At the beginning of 2019, one Apple stock cost about $142 but by the end of the year, it has reached $169. As we can see, even buys on a falling market can yield a good profit in a year or less.

However, if the trader wants to take everything from the market and make money on the falling of stock prices as well, it is worth figuring out how and at what risk we can do so: if we buy, we do not care how much the price grows, be it 100% or 200%; but if we sell, our potential loss may be substantial if the company grows well.

How to sell stocks?

Of course, a question emerges: how do we sell what we do not own? Here, the broker company comes to the scene, helping the trader make such operations. By the way, we have a nice article with guidelines for choosing a broker.

The idea is that you loan a certain number of stocks from the broker. Then you sell them at the current market price; thus your debt to the broker appears. This is the first part of the operation: opening the position.

To complete the operation, we need to give back the loaned stocks to the broker, buying them at the market price. To make money, you need this price to be lower than the initial one. This is the second part of the transaction — closing the position.

In October 2018, the Apple stocks were testing $230 per stock and then fell to $142. Let us see how we can calculate the profit on this falling.

Imagine we have forecast this decline and realize that we can earn $85 on one stock. We decide to open a position selling 25 Apple stocks at $230, the aggregate sum being $5,750. To close the position, we need to give back to the broker 25 stocks but at the price of $145. In other words, instead of $5,750, we give back $3,625. Our profit may be $2,125. We should remember that this is a historical example that represents the idea, real trading requires a risk assessment.

Why does the broker give this opportunity?

For such a specific service as loaning stocks to a physical person, the broker charges a certain fee. The price is normally represented in the trading conditions: normally, it is a commission fee for opening and closing the position. Thus, the broker will make money on loaning the stocks, while the trader will have an opportunity to make money on the expected decline.

Will I have dividends for such a transaction?

Experienced traders do not recommend to sell stocks before the payment of dividends. The thing is that loaned stocks will not bring dividends: they will be received by the real owner holding a long position on them. The trader who sells the stocks pays dividends to the owner.

It turns out that we cannot count on additional income in the form of dividends during such an operation, we make money only in the case of a serious falling.

Is there any risk?

Of course, speculative trading always involves risks. It is thought that the risk of a loss on a short position is always much higher than when buying stocks.

If we have bought a stock at $5 per stock, when the price falls to 0, we only lose $5. If we sell a stock at $5, the price may grow not only to $10 but to $50, to $100 or higher. In this case, we may lose much more than just $5.

Here, the risk is, indeed, high at the moment of opening a selling position. However, as with Apple, fallings happen, and we can make money on them, and risk management is an important part of trading.

Read more at R Blog - RoboForex

Sincerely,
RoboForex team
 
Drawdown: What is It and How to Escape It?

Author : Dmitriy Gurkovskiy


Dear Clients and Partners,

Such sonorous terms as Margin Call and Stop Out must be known to anyone who deals with trading. Each person has come to know it in their way: some got acquainted with them practically, forcefully closing their losing positions, some - theoretically, studying the basics of trading.

If you have not heard these terms yet, a short lecture will, perhaps, make you think well about the consequences of unreasonable and excessively emotional trading.

Margin Call is a notification from your broker, in which they require to additionally replenish your security deposit.

If after a Margin call the trader does not deposit heir account, and the losses keep growing, then after the price reaches a certain level, the Stop Out procedure will be launched. This means the broker will close some or all open positions on the account. However, Margin Call and Stop Out are not as disastrous as the trader's actions that lead to them.

One such action might be connected to unthoughtful trading operations based on no strategy or tactics, without risk and money management. An example of such actions can be trading the whole capital both in periods of high volatility and a calm market. In such times, the trader is more of a gambler, hoping for a quick gain.

What is a drawdown?


A drawdown is a decrease in the balance and equity on the trading account; to put it simpler, a drawdown is a loss. Drawdowns can be of two types: floating and fixed.

Floating and fixed drawdown
Floating drawdown is an aggregate loss of all open positions. Here, we highlight that the trades we are talking about are still open.

For example, the trader opened a position, and then the market situation started developing counter the forecasts, so the trade yielded a loss. This loss will constitute the floating drawdown.

Also, such a drawdown is called floating or temporary because a day or two later the situation might change either for better or for worse.

Reasons for drawdowns

I will keep repeating that bad trading can be explained by the wrong choice of a strategy and a lack of risk management and money management. However, even if the trader has all these elements of trading, they might be betrayed by their psychology and/or personal discipline.

The mistakes will be revealed by increases in the trading volume, unreasonable and chaotic buying and selling, locking and using the Martingale. Of course, all this might work, but it will not be systematic.

If you have drawdowns too often, you should think something like: "Am I trading the right way?". I mean, you can plan your profit and losses if your trading system is in harmony with the market and your money management helps you escape drawdowns quickly and accumulate profit.

If your trading account does get in a drawdown, first and foremost, you have to accept it. Any trader has got a drawdown sometime, and its presence on the account is virtually normal, the question is in its size.

How to escape a drawdown?

So, we are now nearing the part which is the reason for you to have started reading this. Again, a drawdown of an account is a natural situation you will hardly avoid. However, it can always be optimized, and its influence on the account - minimized. All this is rather easy to do: you need to follow the rules of money and risk management and your strategy. For most people, my words will seem banal. This is because not all readers have a strict financial plan, a trading strategy, risk and money management systems. So, the first step out of the drawdown will be adding the aforementioned to your trading.

There is a law: the deeper the drawdown, the longer it will take you to get out of it. If the trader was unlucky to lose 50% of the deposit in 2-3 trades, it is unlikely they will restore the capital in an equally short time.

On the Internet, you can find lots of information counter averaging, locking, and using the Martingale; however, advocates of these methods are also there. Not wishing to start an argument, I will say that both averaging and locking may do the trader lots of good if they know the tricks.

Read more at R Blog - RoboForex

Sincerely,
RoboForex team
 
What Is PPI and How to Use It?

Author : Igor Sayadov


Dear Clients and Partners,

One of the previous articles was devoted to the CPI – Consumer Price Index. Today’s article is about its nearest relative – the PPI (Producer Price Index).

What are they different in? What do they show? How to use the PPI in the currency market? This article tries to answer these questions.

Some history

The necessity to track indices appeared as early as the 20th century. In 1925, at the International Conference of Labor Statisticians, certain rules of data collection, processing, generalizing, and presenting were adopted. The importance of such information was acknowledged by all the participants of the conference.

Also, at the Conference, a universal approach to planning and regulating price policies of countries was worked out. Practically, these were the first steps towards globalizing international markets.

The standards created that time were revised three times later: in 1947, 1962, and 1987. In 1962, at the tenth Conference, the term PPI was finally adopted. This is exactly the term used today.

PPI vs CPI

The CPI (Consumer Price Index) is an instrument representing changes for goods and services prices at the final consumer’s side over a certain period. These data is normally used by Central Banks to make interest rate decisions.

When inflation grows, interest rates on loans start being increased in cycles, and when inflation slows down – they start being decreased the same way.

The PPI (Producer Price Index), in turn, reflects changes in goods prices at the wholesale stage, i.e. at the manufacturer’s end. The producer price practically demonstrates the whole range of spending, from buying crude materials through its processing, expenses on energy carriers, expenses on logistics, and to the final product.

As a result, producer prices start changing a bit earlier than at the consumer’s end. This allows calling this index a leading one, signaling about the future inflation level

Where to find the PPI?

PPI values are calculated and published monthly. Every country has a national institution that cares for it.

For example, in the USA, the index is calculated by the Bureau of Labor Statistics, and in Britain – by the Office for National Statistics.

You can find the current, previous, and forecast PPI values in the RoboForex Economic calendar.

How to use the PPI in trading

Take a look at some examples of using the index for trading in the currency market.

Example 1

On September 10th, 2021, the USA published the new PPI value. It turned out to be 8.3% instead of 8.2% expected.

In the USA, the PPI touches upon three sectors: industry, goods and commodities, and recycling.

If the index values exceed expectations, the market goes up (the USD is bullish); if otherwise, the USD becomes bearish.

As a rule, waiting for such news, the market consolidates in narrow ranges. Try using M15 and M30.

Choose the instrument in which it is easier to see the borders of the range, and place pending orders for breakaways of these borders.

For example, let us look at the reaction of the euro to this news. Check the chart below:


A pending selling order for a breakaway of 1.1818 downwards would have brought you a profit at 1.1777. This is the goal of the first wave of decline by the trend.

A pending buying order was to be placed at a breakaway of 1.1855 upwards. But as soon as a selling order is triggered, cancel the buying one.

Read more at R Blog - RoboForex

Sincerely,
RoboForex team
 
How to Use Personal Income and Personal Spending in Forex

Author : Victor Gryazin


Dear Clients and Partners,

This overview is devoted to two macroeconomic indicators — Personal Income and Personal Spending —and their influence on the currency market.

What is Personal Income

Personal Income represents monthly changes in the income of physical persons. This indicator assesses in percent the changes of the aggregate income of people in the country over a reporting month compared to the previous month. For calculations, income from several sources is used:
  • Wage/salary
  • Bonuses
  • Income from owning real estate
  • Income from holding financial assets
  • Income from enterprises
In the USA, Personal Income is calculated and published by the Bureau of Economic Analysis (BEA), alongside Personal Spending.

Monthly changes of personal income is one of the key macroeconomic indicators that the BEA uses for assessing business activity in the country. Personal Income changes are published monthly in the Economic Calendar.

What is Personal Spending

Personal Spending demonstrates monthly changes in expenses of physical persons. It assesses in percent how aggregate expenses of people in the country have changed over the reporting month compared to the previous one. This includes all main expenses of the population:
  • Spending on services
  • Spending on durable and not goods
  • Spending on banking transactions, commission fees, etc.
This indicator is also calculated monthly and published by the BEA alongside Personal Income. Consumer expenses are part of the GDP, hence, PS helps forecast its growth. Also, it is one of inflation growth indicators. Changing Personal Spending is published monthly in the Economic Calendar.

How do these indicators influence the currency market?

For analyzing the influence on the economy of a country, Personal Income and Personal Spending are used together. If the actual data turn out to be dramatically different from the forecast, volatility in the currency market can increase.

On average, these indicators change within 1-2%. Unexpected growth or decline by 3% or more can influence the rate of the US dollar against other currencies.

Both indicators normally have a moderate influence on currency rates. The influence will be most prominent if they grow or fall simultaneously.

If the price dynamics are of different directions — one indicator grows, the second one falls — market reaction can be ambiguous. Let us see how the market can react to simultaneous growth or falling of the indicators.

Growth

Confident growth of Personal Income and Personal Spending makes the USD become stronger. Such growth can heat up consumer market, support the growth of the GDP and speeding up of inflation.

As a result, to hold back overheating of the economy and decrease inflation, the Fed can raise the interest rate. Expectations of this possible increase in the interest rate attracts investors who buy the dollar.

Falling

Steep falling of both indices can make the USD fall against other currencies as well. Decreasing Personal Income and Spending demonstrates some unfortunate trends in the economy, which result in a decline of the GDP and inflation.

Later on, the Fed can liven up and support the economy by various stimulation measures and a decrease in the interest rate (if possible). On these expectations, investors will be selling the dollar.

Read more at R Blog - RoboForex

Sincerely,
RoboForex team
 
Explaining the Meaning of a Swap on Forex: Examples of Use

Author : Victor Gryazin


Dear Clients and Partners,

In this article, we will discuss the use of swap on Forex. Swaps can influence the dynamics of currency pairs significantly and form long-term trends on the market.

What is a swap and how it works?

A swap on Forex is an operation of money depositing or withdrawal for moving an open position to the next day. On Forex, a marginal system of trading is used, which allows using loaned money in the form of large leverage. Thus, when a position is moved to the next day, the rules of interbank crediting come into force.

Swaps on Forex directly depend on the interest rates of Central banks for each currency. In might be said that the currency in the pair that is bought is deposited while the currency that is sold is loaned. The bigger the difference between the rates of the currencies in the pair - the bigger the swap. Depending on whether we are buying or selling a currency pair, a swap will be deposited on or withdrawn from our account:
  • A positive swap is a swap that is deposited on the trader's account for each transfer of an open position. It emerges from buying a currency with a high interest rate against a currency with a low rate. For example, for selling USD/MXN, a positive swap will be deposited on your account. We sell the dollar with a low rate (of 0.25%) and buy the Mexican peso with a high rate (of 6.5%).
  • A negative swap is a swap withdrawn from the trader's account for each transfer of an open position. It emerges from buying a currency with a low interest rate against one with a high interest rate. For example, for buying USD/ZAR, a negative swap will be withdrawn daily. We buy the dollar with a low rate (of 0.25%) and sell the African (RSA) rand with a high rate (of 5.25%).
The size of swaps depends on the difference between the rates of the currencies and the conditions on which your broker works with crediting organizations. Thus, the size of swaps for the same pairs may differ significantly depending on the broker. In the case of currency pairs having more or less equal interest rates, both the swaps for buys and sells may be negative.

The swap for a currency pair is deposited/withdrawn every day (normally, at midnight server time). There is one peculiarity: Wednesday night, the swap is tripled, while Friday night, when the position is transferred to Monday, the swap remains single. This is since the position opened on Wednesday the valuation date (the date when the trade conditions are fulfilled) is Friday.

If you plan to hold your position for a rather long time, it will be wise to evaluate the influence of swaps on your position. Study the information on the website of your broker company carefully. In a popular trading terminal MetaTrader 4, to see the size of swaps, right-click the currency pair in the MarketReview window and choose the menu line "Contract specification".


How to make money on swaps?

Thanks to the difference between the interest rates, swaps allow receiving extra profit and can even form long-term trends on the market. The strategy based on using positive swaps is called Carry trade. The idea of the strategy is in holding positions with a positive swap for as long as possible.

To get maximal swaps, we choose a currency pair with a large difference between the interest rates of the currencies it contains. Buying the currency with a high interest rate against the one with a low interest rate, you can every day receive a good positive swap for holding this position.

Carry trade works well when things go smoothly on the market, stock indices grow stably. Investors have no reason for worrying, so the enjoy the opportunity to make money investing in the high-yielding currencies of developing markets. Investing in profitable currencies may form a long-term market trend.

There was a time (before the crisis of 2008) when it was popular to buy GBP/JPY as an instrument of carry trade. The British pound is one of the leading world currencies and had quite a high interest rate of 5.0% at that time. The Japanese yen is a low-yielding currency and has had an interest rate of 0.0% for a long time.

Read more at R Blog - RoboForex

Sincerely,
RoboForex team
 
USD Forecast: Analysing the Trends of 2023 and Future Prospects

Author : Victor Gryazin


Dear Clients and Partners,

At present, the United States Dollar (USD) stands as the most highly sought-after currency in the global economy, also serving as a reserve asset for international trade and finance. In this article, we will examine the key factors influencing USD trends, analyse growth prospects in the current environment, and delve into expert projections for the immediate future.

Understanding the USD

The USD (United States Dollar) is the official currency of the United States of America and functions as a global reserve currency in international trade and financial markets. The US dollar is represented by the symbol $ or US$ to distinguish it from other currencies with similar names. The Federal Reserve System, functioning as the central bank of the US, holds the authority to issue currency.

The USD's status as the world reserve currency was officially established at the United Nations Monetary and Financial Conference in 1944. In the same year, the Bretton Woods currency system was approved, which was based on equating USD to gold and limiting the emission of money within the bounds of its own international reserves. A fixed rate of 35 USD per troy ounce of gold was set.

However, the rapid expansion of the dollar supply exceeded the capacity of its own gold and foreign currency reserves, leading the US to abandon the Bretton Woods agreement. In 1976, developed countries adopted the Jamaican Monetary System, under which currency exchange rates are determined by the market rather than governments. The new rules allowed the Fed to print as many dollars as necessary. At present, the dollar's value is governed by market mechanisms.

Today, the US stands as a leader in the global economy, with the US dollar regarded as the benchmark currency and the most widely used asset in transactions worldwide. It also functions as the official currency in many territories beyond the US, while numerous other countries use it alongside their own as an unofficial currency.

Key factors influencing the USD

The US dollar, as the most traded currency in the world, is influenced by several factors, including economic and political ones. Among the most significant is the current monetary policy of the US Federal Reserve System (FRS), the central bank of the US. Decisions regarding interest rate changes significantly influence the value of the US dollar.

The Bureau of Labour Statistics publishes data on unemployment and nonfarm payrolls (Nonfarm Payrolls), typically on the first Friday of each month. Traders closely monitor this data, as it can dramatically increase the volatility of the US dollar and, of course, affect currency pairs in which it takes part.

Recent trends impacting the USD

The US Federal Reserve has recently been actively combating inflation by tightening its monetary policy. Since 2022, the interest rate has been gradually raised from 0.25% to 5.5% – the highest in 22 years. The rate hike cycle has had a noticeable impact on USD quotes, which have managed to significantly strengthen against numerous global currencies during this time.

Recent statements from Jerome Powell, the head of the regulator, suggest that the Fed is preparing to conclude the interest rate hike cycle. Experts are forecasting a maximum of two more rate hikes in 2023. Subsequently, the rate is expected to remain steady for a specific duration, and there is even the possibility of a decline if economic conditions call for it.

The policy of raising rates is putting significant pressure on the US economy. High inflation and slowing economic growth, combined with concerns about the sustainability of the banking sector, could contribute to the conditions for the onset of a recession – a significant and prolonged economic growth slowdown.

Read more at R Blog - RoboForex

Sincerely,
RoboForex team
 
Top 3 Stocks From the S&P 500 List with the Highest Dividend Yields in 2023

Author : Eugene Savitsky


Dear Clients and Partners,

In June 2022, the annual inflation in the US reached 9.1%, a level not witnessed by Americans since the 1980s. The Federal Reserve System (Fed) began swiftly increasing the interest rate, leading to a reduction in inflation to 3% by August 2023. While this value still exceeds the regulator's target by 1%, it can be acknowledged that the efforts of Jerome Powell, the head of the Fed, have proven effective.

Nevertheless, it is crucial to note that even a 3% inflation rate will yearly erode the purchasing power of money. One of the tools capable of generating returns equal to or surpassing the inflation rate is stocks. There are two ways to profit from this asset class: firstly, through the appreciation in the stock value, and secondly, through dividend payments.

Identifying a company whose stock value will significantly increase is notably more challenging than finding a company that offers substantial dividends. Today, we will delve into three issuers that are part of the S&P 500 list and pay dividends exceeding the inflation rate, namely Pioneer Natural Resources Company (NYSE: PXD), Coterra Energy Inc. (NYSE: CTRA), and Diamondback Energy Inc. (NYSE: FANG).

Criteria for selecting companies with the highest dividend yields

1. Dividend Yield: This signifies the ratio of the annual dividend per share to its cost, expressed as a percentage. It serves to assess the attractiveness of a security in terms of receiving passive income from owning it – higher percentage values denote enhanced attractiveness.

2. Debt Load: A minimal or absent debt load indicates that the company's profits are ample both for business development investments and dividend disbursements. This can be gauged through the Long-Term Debt/Equity ratio.

This ratio mirrors the issuer's financial risk and leverage degree, revealing its reliance on borrowed funds. A lower ratio indicates a better scenario, as it implies the company relies more on its equity capital rather than borrowed funds. The optimal Long-Term Debt/Equity ratio varies by industry and business specifics, but a ratio of 0.5 generally indicates financial stability.

[SIZE=51. Pioneer Natural Resources Company[/SIZE]
  • Dividend yield – 10.18% per annum
  • LT Debt/Eq ratio – 0.23
  • Founded in – 1997
  • Included in the S&P 500 – 2008
  • Registered in – the US
  • Headquarters – Irving, Texas
  • Market capitalisation – 54.5 billion USD
Pioneer Natural Resources Company is engaged in hydrocarbon exploration and production and is one of the largest independent oil and gas companies in the US in terms of reserves and production.

Due to the decline in oil prices, Pioneer Natural Resources Company’s net profit for Q2 2023 decreased by 53% to 1.1 billion USD compared to the corresponding period last year, and earnings per share dropped 47% to 4.42 USD.

Pioneer Natural Resources Company pays two types of dividends: fixed and variable. Based on the Q2 results, the fixed dividend amounted to 1.25 USD per share, and the variable one was 0.59 USD.

Read more at R Blog - RoboForex

Sincerely,
RoboForex team
 
Demonstration and Real Accounts: Psychological Differences

Author : Timofey Zuev


Dear Clients and Partners,

It is no secret that trading results on real and demo accounts always differ, the former results usually being worse. In other words, if you succeed in trading on a demo account, you should always make allowance for the real situation. Some details of the execution of real trade orders, which were not visible on the demo accounts, may lead to this difference; however, such details are not significant enough to lead to serious deviations of the results.

Working on a demo account, the trader has already chosen the timeframe, the instruments, the volume of the opening positions, the instruments of analysis, the levels of entrance and exit — all trading principles and approaches. Yes, the trader is ready to start working with real money, as, in essence, trading on a demo account is in no way different to the real one. However, the one exception here is the real psychological readiness of the trader. The devil is in the different attitude to trading demo money and the trader's own money.

Difference between real and demo trading

1. The trader treats their demo account with ease because they know that they can open another one with new starting capital any moment. As usual, there are lots of explanations to the failures on the previous account, among which one of the most popular one is: the price made a reversal when I was absent from the computer, so I could do nothing.

There is yet another category of traders who open a new account upon receiving a loss on the previous one — they just like it to begin trading from a profitable trade, and no other way. However weird it is, but they do not even realize that it will not be possible on a real account, as they will not be forgetting losses there with such ease.

It would be much wiser to allow for a limited number of paid demo accounts. In this case it is unlikely that traders were so light-minded.

2. Trading strategy is better visible on a demo account. Why? Because there is nothing easier than receive a planned Stop Loss so long that the money is not real. And nothing easier than wait for a Take Profit with the whirlpool of ideas of what you could buy on that money if you closed the position now. There is no need to change the volume of the position during trading on a demo account, as there is no fear of another loss or a decrease of the profit. That is why the trader can execute their trading plan without altering and impulsive correcting.

Reasons for losing the deposit

The reasons for losing the deposit are mostly psychological, including:

Greed. Upon reaching their goal, the trader cannot brace themselves and keeps trading, willing to earn more or make the sum tidy. They may go even further and try to make enough profit for both life and trading

Proceeding to the next goal without reaching the first one. If the trader starts receiving stable profit, their vigilance fades, and they relaxes, believing in their professionalism. Their appetite grows accordingly, so the trader thinks: what do I need a bike for if I can earn for a car? However, they are likely to get none: goals are to be chosen and reached subsequently.

Reinvesting. Reinvesting itself is good for it helps increase the working capital and the profit by increasing the volume of trades. However, this method should be used with much care. Just a part of the profit should be left for growing the deposit, no the whole of it. Why? Because a series of losses or an unstable profit may follow, and the trader, willing to increase the deposit (if it is small) or get more profit (if the deposit is large), is likely to lose all that they have earned. As a result, they will get back to the starting point.

Summary

I would like to mention that, working on a demo account, the trader will not feel the influence of these factors. Call it the charm of money.

Real and demo accounts have a too big difference, and the transition requires psychological adapting. One way to make the transition to real trading easier is using cent accounts. It is advised to have the same volume on the cent account as it is planned to open the main account with.

Read more at R Blog - RoboForex

Sincerely,
RoboForex team
 
Economic Indicators - The Basis for Forex Trading Strategy

Author : Timofey Zuev


Dear Clients and Partners,

Let us have a look at the main economic indicators and their influence at the currency rates. The knowledge and understanding of these indicators are the basics of fundamental analysis and forecasting of price movements.

Interest Rate

Interest rate is an efficient instrument of credit and monetary policy of the state. Increasing interest rates, Central banks regulate demand for loans, reducing it, which decreases the expenses of people and impedes economic development. This measure is meant, first and foremost, for reducing the inflation rate and for prevention of overproduction of goods.
Decreasing interest rates leads to an increase in demand for loans, enhancing economic development.

The size of the interest rate is the basis for other economic parameters — rates of state and corporate bonds, credit rates for individuals and legal entities, etc. Central banks do not frequently change interest rates: this is a major market event, and all market players track such changes very carefully.

Gross Domestic Product (GDP)

The GDP is generalized data about the sum of the added value, produced by all producers in the country during a set period of time. The GDP surplus demonstrates the economic development of the country, its speed. Stable growth of the GDP is characteristic of stable economic development and also strengthening of the national currency, while a slowdown of the GDP growth means problems with the country's economy. The market reaction on the news about the GDP, the initial as well as corrected, is rather active and usually leads to serious movements of currency rates.

A report on the GDP is a wide analysis of all sectors of a country's economy. That is why different market players pick up the paragraphs that are of interest to them and make conclusions about the state of development of this or that country.

Consumer Price Index (CPI)

Consumer price index (CPI) is the main indicator of inflation in the country. For its calculation, the prices of the consumer goods basket during a certain period of time are used. In each country, the set of goods in the basket is different and is formed on the basis of statistical data. Such goods may be food, everyday objects, services, etc.

The prices for food and energy sources are the most volatile, so along with the CPI a so-called Core CPI is calculated, the latter including this category of goods from the consumer goods basket.

The CPI data is normally published on the tenth workday of each month as the percentage of the changes that have happened. In other words, what is published is the information by how many percent the current values have changed in comparison with the previous ones. The news about a change of a CPI value by just 0.2% leads to rather strong fluctuations of currency rates.

Producer Price Index (PPI)

Producer price index (or PPI) is an indicator of the price changes for the goods produced by national producers. The index includes the price for the raw materials, produced in the country and imported, on the intermediate products, on the finished products. The index includes all stages of goods production, as well as all spheres of production and agriculture. The difference from the CPI is that it does not include services and provides the analysis of price changes only at the level of primary wholesale trade.

Along with the PPI, the Core PPI data is also published; it does not include the prices for the goods of food and energy industries due to their high volatility. The PPI is published monthly on the tenth workday simultaneously with the CPI.

Trade Balance

Trade Balance, or International Trade, is the difference between the sum of export of goods and services and the sum of the import.

It influences exchange rates directly and reveals the competitiveness of the goods and serves, produced in the county, on the international market. Favorable trade balance (the situation when export surpluses import) signifies inflow of capital into the country, production development and, on the whole, has a positive influence on the economy.

Conversely, a deficit of trade balance, i.e. the situation when import surpluses export, signals low development of production, a lack of competitiveness of the national goods and is a generally negative factor for the country. This leads to the growth of the national debt as well as has a negative influence upon the exchange rate of the national currency, because its supply increases due to the necessity to buy more currency of the exporting state.

Read more at R Blog - RoboForex

Sincerely,
RoboForex team
 

Create an account or login to comment

You must be a member in order to leave a comment

Create account

Create an account on our community. It's easy!

Log in

Already have an account? Log in here.

Similar threads

Users Who Are Viewing This Thread (Total: 1, Members: 0, Guests: 1)

Top
AdBlock Detected

We get it, advertisements are annoying!

Sure, ad-blocking software does a great job at blocking ads, but it also blocks useful features of our website. For the best site experience please disable your AdBlocker.

I've Disabled AdBlock    No Thanks