FXGlory Ltd
Member
BTCUSD H4 Technical and Fundamental Analysis for 06.16.2025
Time Zone: GMT +3
Time Frame: 4 Hours (H4)
Fundamental Analysis:
The BTCUSD (Bitcoin vs US Dollar) pair may experience increased volatility today due to USD-related macroeconomic data. Specifically, attention is focused on the New York Manufacturing Index released by the Federal Reserve Bank of New York. As a forward-looking indicator of economic health, stronger-than-forecast results would support the USD, potentially putting short-term downward pressure on BTC/USD. However, broader crypto sentiment remains influenced by institutional accumulation and anticipation of regulatory developments. With Bitcoin's long-term bullish fundamentals intact—bolstered by growing adoption and inflation hedging—the market reaction to USD strength may be limited or short-lived unless the data shows a strong divergence from expectations.
Price Action:
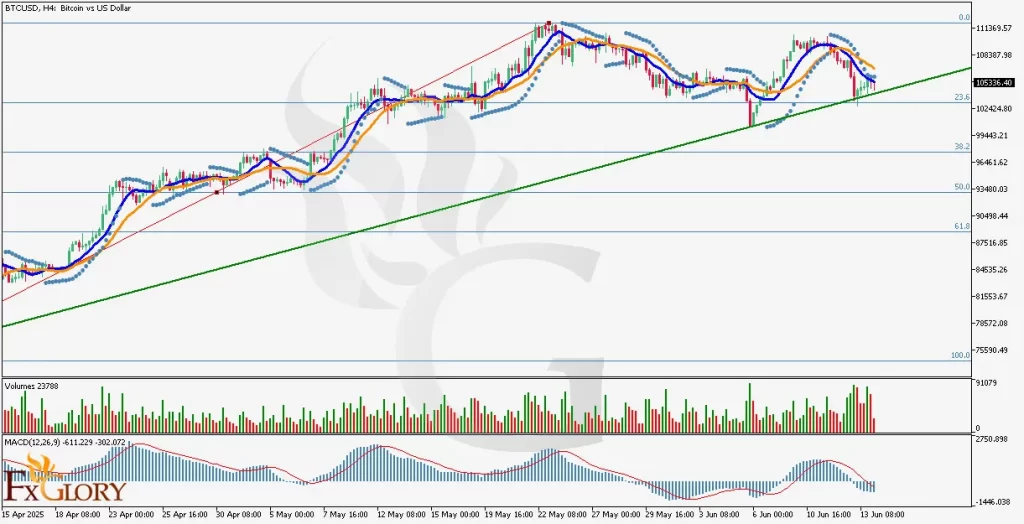
The BTCUSD H4 chart exhibits ongoing consolidation just above the $100,000 psychological level, with price currently at $105,336. After reaching highs near $111,389, the market has retraced toward the 23.6% Fibonacci level, where it found support on the long-term upward trendline (green). Price action is compressing within this critical confluence zone, suggesting indecision. A series of lower highs indicate minor bearish momentum, but the long-term structure remains bullish unless the trendline support is broken with volume. The candlesticks show diminishing bearish bodies near support, hinting at a possible reversal or breakout above the local resistance area.
Key Technical Indicators:
Moving Averages (EMA 9 & EMA 17): The Bitcoin price is currently below both the short-term (blue, EMA 9) and long-term (orange, EMA 17) exponential moving averages. The short-term EMA has crossed below the long-term EMA, signaling bearish short-term momentum. However, this crossover occurs close to a major support level, indicating a possible upcoming bounce or reversal if bulls defend the trendline.
Parabolic SAR: The Parabolic SAR dots are positioned above the candles, confirming the current bearish sentiment. However, the dots are very close to the candlesticks, suggesting weakening selling pressure and potential for a bullish shift if price closes above the EMAs in the next few sessions.
Volume: Volume has increased slightly near the recent support touch, suggesting accumulation interest at the $100K–$105K zone. No significant spikes indicate panic selling; instead, volume patterns align with a potential base-building process at key support.
MACD (12,26,9): The MACD histogram remains below zero, and the MACD line is below the signal line, indicating bearish momentum. However, the histogram bars are shortening, implying a reduction in bearish momentum. A bullish crossover may soon occur if the trendline holds and upward momentum builds.
Support and Resistance:
Support: Strong support is established around $100,000, aligned with the 23.6% Fibonacci retracement level and the long-term upward trendline, creating a critical demand zone for BTC USD in this H4 analysis.
Resistance: Immediate resistance lies near $108,387, the recent swing high, with the next major barrier at $111,389, corresponding to the peak and 0.0 Fibonacci retracement level.
Conclusion and Consideration:
BTCUSD on the H4 chart remains within a long-term bullish trend, currently testing a key support zone around $100,000–$105,000. While short-term indicators like the EMA crossover, MACD, and Parabolic SAR suggest bearish pressure, the proximity to structural support and declining bearish momentum may lead to a bullish reversal. A confirmed close above the EMAs and increased volume could signal a fresh move toward the $108K–$111K resistance zone. Traders should closely monitor today’s USD news release, especially the New York Manufacturing Index, as stronger-than-expected data could bolster the USD and apply pressure to BTC. This BTC-USD H4 chart analysis recommends a cautious approach, waiting for clear price action confirmation before entering new positions.
Disclaimer: The analysis provided for BTC/USD is for informational purposes only and does not constitute investment advice. Traders are encouraged to perform their own analysis and research before making any trading decisions on BTCUSD. Market conditions can change quickly, so staying informed with the latest data is essential.
FXGlory
06.16.2025
Time Zone: GMT +3
Time Frame: 4 Hours (H4)
Fundamental Analysis:
The BTCUSD (Bitcoin vs US Dollar) pair may experience increased volatility today due to USD-related macroeconomic data. Specifically, attention is focused on the New York Manufacturing Index released by the Federal Reserve Bank of New York. As a forward-looking indicator of economic health, stronger-than-forecast results would support the USD, potentially putting short-term downward pressure on BTC/USD. However, broader crypto sentiment remains influenced by institutional accumulation and anticipation of regulatory developments. With Bitcoin's long-term bullish fundamentals intact—bolstered by growing adoption and inflation hedging—the market reaction to USD strength may be limited or short-lived unless the data shows a strong divergence from expectations.
Price Action:
The BTCUSD H4 chart exhibits ongoing consolidation just above the $100,000 psychological level, with price currently at $105,336. After reaching highs near $111,389, the market has retraced toward the 23.6% Fibonacci level, where it found support on the long-term upward trendline (green). Price action is compressing within this critical confluence zone, suggesting indecision. A series of lower highs indicate minor bearish momentum, but the long-term structure remains bullish unless the trendline support is broken with volume. The candlesticks show diminishing bearish bodies near support, hinting at a possible reversal or breakout above the local resistance area.
Key Technical Indicators:
Moving Averages (EMA 9 & EMA 17): The Bitcoin price is currently below both the short-term (blue, EMA 9) and long-term (orange, EMA 17) exponential moving averages. The short-term EMA has crossed below the long-term EMA, signaling bearish short-term momentum. However, this crossover occurs close to a major support level, indicating a possible upcoming bounce or reversal if bulls defend the trendline.
Parabolic SAR: The Parabolic SAR dots are positioned above the candles, confirming the current bearish sentiment. However, the dots are very close to the candlesticks, suggesting weakening selling pressure and potential for a bullish shift if price closes above the EMAs in the next few sessions.
Volume: Volume has increased slightly near the recent support touch, suggesting accumulation interest at the $100K–$105K zone. No significant spikes indicate panic selling; instead, volume patterns align with a potential base-building process at key support.
MACD (12,26,9): The MACD histogram remains below zero, and the MACD line is below the signal line, indicating bearish momentum. However, the histogram bars are shortening, implying a reduction in bearish momentum. A bullish crossover may soon occur if the trendline holds and upward momentum builds.
Support and Resistance:
Support: Strong support is established around $100,000, aligned with the 23.6% Fibonacci retracement level and the long-term upward trendline, creating a critical demand zone for BTC USD in this H4 analysis.
Resistance: Immediate resistance lies near $108,387, the recent swing high, with the next major barrier at $111,389, corresponding to the peak and 0.0 Fibonacci retracement level.
Conclusion and Consideration:
BTCUSD on the H4 chart remains within a long-term bullish trend, currently testing a key support zone around $100,000–$105,000. While short-term indicators like the EMA crossover, MACD, and Parabolic SAR suggest bearish pressure, the proximity to structural support and declining bearish momentum may lead to a bullish reversal. A confirmed close above the EMAs and increased volume could signal a fresh move toward the $108K–$111K resistance zone. Traders should closely monitor today’s USD news release, especially the New York Manufacturing Index, as stronger-than-expected data could bolster the USD and apply pressure to BTC. This BTC-USD H4 chart analysis recommends a cautious approach, waiting for clear price action confirmation before entering new positions.
Disclaimer: The analysis provided for BTC/USD is for informational purposes only and does not constitute investment advice. Traders are encouraged to perform their own analysis and research before making any trading decisions on BTCUSD. Market conditions can change quickly, so staying informed with the latest data is essential.
FXGlory
06.16.2025