What's new
Top Forex Forum | Get Forex Trading Strategies & Feeds | Forex Forum

This is a sample guest message. Register a free account today to become a member! Once signed in, you'll be able to participate on this site by adding your own topics and posts, as well as connect with other members through your own private inbox!

Forex News Daily Analysis By FXGlory

4.80 star(s) 4 Votes
USDJPY H4 Technical and Fundamental Analysis for 10.30.2025


USDJPY H4 Technical and Fundamental Analysis for 10.30.2025.jpg


Time Zone: GMT +2
Time Frame: 4 Hours (H4)


Fundamental Analysis:

The USDJPY currency pair is expected to exhibit significant volatility today, primarily influenced by events surrounding the Japanese Yen (JPY). Traders should closely monitor announcements from the Bank of Japan (BOJ), specifically regarding interest rate decisions, statements, and the subsequent press conference by the BOJ Governor. Given the typical impact of these events on currency valuation—especially concerning the BOJ's stance on inflation and economic outlook—JPY could experience sharp fluctuations. Meanwhile, no major USD events today suggest that the focus remains predominantly on JPY-driven news.


Price Action:
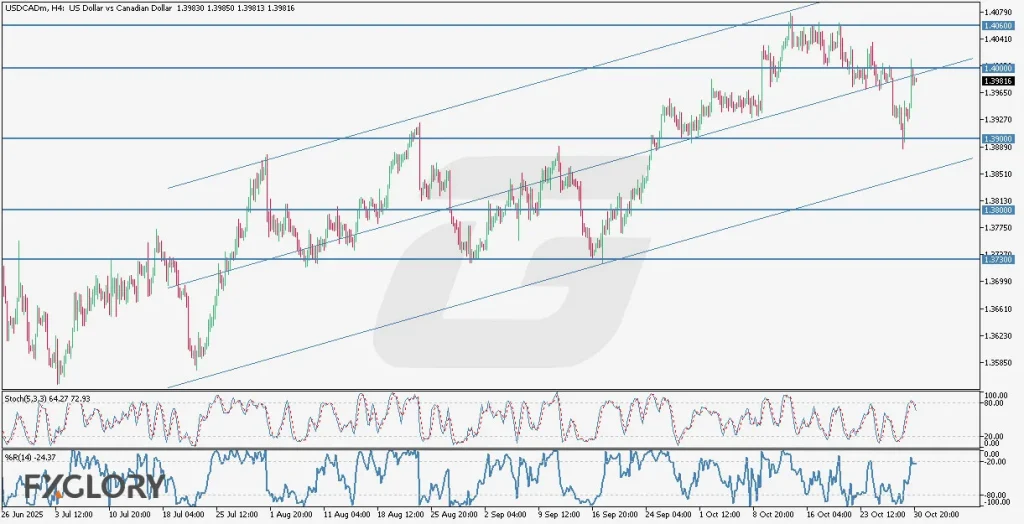
USDJPY on the H4 chart continues moving within a bullish ascending channel, reflecting steady bullish momentum. Currently, the price is at the upper band of the bullish channel, potentially indicating a forthcoming sideways or consolidative market behavior. Recent candle formations have shown consistent bullish intent, though encountering resistance near the channel’s upper line, suggesting traders remain cautious for a possible pullback or consolidation.


Key Technical Indicators:
Bollinger Bands:
Bollinger Bands on USDJPY indicate bullish sentiment as the price continues to remain above the middle band. However, the upper band proximity may lead to short-term consolidation. Traders should remain alert for price reactions near the upper band, indicating possible resistance and volatility expansions.
Stochastic (5,3,3): Currently reading at 70.58 and 65.16, the stochastic oscillator signals a mild bullish momentum, nearing overbought territory. This indicates potential slowing momentum and traders should monitor closely for potential bearish divergence signaling reversal risks.
Williams %R (14): With a current value of -22.36, Williams %R supports bullish bias but similarly hints at a potential pullback or consolidation. This aligns with stochastic signals, further reinforcing the need for caution at current price levels.


Support and Resistance:
Support:
Immediate support is situated around the channel’s midline near 151.500, which previously served as a critical price reaction point.
Resistance: Immediate resistance is established at the upper channel boundary near 153.100, marking recent highs and potential price exhaustion points.


Conclusion and Consideration:
The USDJPY pair’s bullish channel indicates sustained bullish potential, supported by current technical indicators. Yet, the proximity to resistance levels and mild overbought conditions signals caution for possible consolidation or mild corrections. Traders should closely follow BOJ communications today, given their significant potential to alter short-term price action.


Disclaimer: The analysis provided for USD/JPY is for informational purposes only and does not constitute investment advice. Traders are encouraged to perform their own analysis and research before making any trading decisions on USDJPY. Market conditions can change quickly, so staying informed with the latest data is essential.


FXGlory
10.30.2025
 
USDCAD H4 Technical and Fundamental Analysis for 10.31.2025


USDCAD_H4_Technical_and_Fundamental_Analysis_For_10.31.2025--1024x524.webp


Time Zone: GMT +2
Time Frame: 4 Hours (H4)


Fundamental Analysis:

The USD/CAD currency pair today is influenced primarily by a series of key U.S. Federal Reserve events, with several FOMC members including Lorie Logan, Raphael Bostic, and Beth Hammack scheduled to speak at the Evolving Landscape of Bank Funding Conference. Traders are closely monitoring their remarks for hints about future interest rate policy and potential shifts in the Fed’s stance toward inflation and economic growth. A more hawkish tone could strengthen the U.S. Dollar. Meanwhile, from the Canadian side, GDP data from Statistics Canada remains a key focus, with markets anticipating its next release later in November. Stronger-than-expected growth would support the Canadian Dollar, but today’s sentiment is likely to be dominated by U.S. policy commentary, keeping the USD/CAD exchange rate sensitive to Fed-related remarks and risk sentiment.


Price Action:
The USDCAD H4 chart shows that the pair continues to trade within a clear ascending channel, maintaining a bullish trend overall. Recently, the price bounced from the 1.39000 support level and rallied upward toward 1.40000, which acts as the first resistance near the regression channel’s midline. The market structure suggests steady bullish momentum, though short-term corrections are visible. A breakout above 1.40000 could pave the way toward 1.40600 resistance, while a failure to hold above the channel midpoint may lead to a retest of 1.39000 or deeper supports at 1.38000 and 1.37300.


Key Technical Indicators:
Stochastic (5,3,3):
The Stochastic Oscillator is currently at 64.27 and 72.93, signaling that bullish momentum is still active but approaching overbought territory. This suggests possible short-term consolidation or mild retracement before the next upward move, especially if the pair fails to break the 1.40000 resistance cleanly.
Williams %R (14): The %R indicator stands at -24.37, which places it near the overbought zone. This reflects that buyers are in control but the pair may experience short-term exhaustion. If the indicator turns downward, a brief correction could follow, offering new entry opportunities near support levels within the channel.


Support and Resistance:
Support:
The immediate support zone is around 1.39000, followed by deeper levels at 1.38000 and 1.37300, which historically have acted as strong demand areas.
Resistance: The nearest resistance is located at 1.40000, aligning with the channel’s midline. The next resistance stands at 1.40600, representing the upper boundary of the bullish channel and a potential breakout target.


Conclusion and Consideration:
The USDCAD H4 analysis indicates that the pair is trading in a bullish trend, supported by both price action and technical indicators. However, short-term caution is advised as the Stochastic and Williams %R approach overbought levels, which may lead to minor pullbacks before further gains. The overall bias remains bullish while the price stays above 1.39000. Traders should monitor today’s U.S. Fed speeches and market sentiment closely, as any hawkish commentary could reinforce USD strength and support a breakout above 1.40000.


Disclaimer: The analysis provided for USD/CAD is for informational purposes only and does not constitute investment advice. Traders are encouraged to perform their own analysis and research before making any trading decisions on USDCAD. Market conditions can change quickly, so staying informed with the latest data is essential.


FXGlory
10.31.2025
 
EURUSD H4 Technical and Fundamental Analysis for 11.04.2025


EURUSD-H4-Technical-and-Fundamental-Analysis-for-11.04.2025-.jpg


Time Zone: GMT +2
Time Frame: 4 Hours (H4)


Fundamental Analysis:

The EURUSD pair, representing the exchange rate between the Euro and the US Dollar, faces potential volatility today due to high-impact economic news. ECB President Christine Lagarde's speech at the Bulgarian National Bank and Bundesbank President Joachim Nagel's address in Berlin could induce significant movements in the euro, especially if their commentary hints at future monetary policy decisions. Meanwhile, the USD could react positively to Federal Reserve Governor Michelle Bowman's insights on the Fed's policy stance during the Santander International Banking Conference, as well as the RCM/TIPP Consumer Confidence data, shaping traders’ expectations for upcoming interest rate decisions and economic outlook.


Price Action:
Analyzing EUR/USD price action on the H4 chart reveals a clear bearish trend, underpinned by a long-term descending red trend line. The price is struggling to surpass the 23.6% Fibonacci retracement level, indicating significant bearish pressure. Despite the current green candle suggesting minor bullish momentum, the overall market sentiment remains bearish, reinforced by sustained price action below major moving averages.


Key Technical Indicators:
Moving Averages (MA):
The short-term blue 9 MA has crossed below the long-term orange 21 MA, clearly signaling bearish sentiment. Both averages are sloping downward, reinforcing the negative momentum in the pair, highlighting sellers' dominance in the short-to-medium term.
Parabolic SAR: Currently positioned above the candles with parameters of 0.05/0.2, the Parabolic SAR dots confirm continued bearish momentum, providing strong technical validation for potential further downward movement.
MACD (Moving Average Convergence Divergence): The MACD histogram remains in negative territory, with both MACD and signal lines below the zero level, underscoring ongoing bearish momentum despite recent minor bullish fluctuations.
RSI (Relative Strength Index) 28: The RSI indicator at 38.66 reflects bearish market sentiment, though it's not yet oversold, suggesting there remains additional downside potential before buyers may step in more decisively.


Support and Resistance:
Support:
Immediate support appears firm near the current 23.6% Fibonacci retracement level, approximately at 1.1513, which has halted further bearish moves.
Resistance: Key resistance lies near the dynamic descending trendline, approximately around 1.1580, closely aligning with the 38.2% Fibonacci retracement level.


Conclusion and Consideration:
EUR-USD remains predominantly bearish on the H4 chart, supported by multiple technical indicators including moving averages, Parabolic SAR, MACD, and RSI. Traders should exercise caution and closely monitor the upcoming speeches from the ECB and Fed, as they hold the potential to significantly shift market dynamics and alter the current bearish trajectory. Due diligence and careful risk management are advised given today's high-impact news environment.


Disclaimer: The analysis provided for EUR/USD is for informational purposes only and does not constitute investment advice. Traders are encouraged to perform their own analysis and research before making any trading decisions on EURUSD. Market conditions can change quickly, so staying informed with the latest data is essential.


FXGlory
11.04.2025
 
NZDUSD H4 Technical and Fundamental Analysis for 11.05.2025


NZDUSD-H4-Technical-and-Fundamental-Analysis-for-11.05.2025-1024x524.webp


Time Zone: GMT +2
Time Frame: 4 Hours (H4)


Fundamental Analysis:

The NZDUSD currency pair is influenced today by several key macroeconomic events from both New Zealand and the United States. On the New Zealand side, upcoming reports from Statistics New Zealand on employment change, unemployment rate, and private sector labor costs—alongside the Reserve Bank of New Zealand (RBNZ) Financial Stability Report press conference with Governor Christian Hawkesby—are expected to bring notable market volatility. Traders will watch for any hawkish tone from the RBNZ that might strengthen the NZD, especially if employment data reveals job growth or stable labor costs. For the USD, focus turns to the ADP Non-Farm Employment Change, S&P Global Services PMI, ISM Non-Manufacturing PMI, and EIA Crude Oil Inventories. Strong labor and services data from the US could further bolster the dollar, maintaining pressure on the NZDUSD pair.


Price Action:
The NZDUSD pair on the H4 chart continues to trade within a well-defined bearish descending channel, showing consistent lower highs and lower lows. The candles have been moving along the channel with several breakout failures from both the upper and lower bands, confirming the prevailing downtrend. Given the recent sharp descent in price, the pair has now approached the lower boundary of the channel, suggesting the possibility of a minor corrective rebound before resuming its downward movement. However, a confirmed breakout below this lower band could signal further bearish extension, especially if US economic data outperforms expectations.


Key Technical Indicators:
Parabolic SAR:
The dots are currently positioned above the candles, confirming ongoing bearish momentum. This alignment indicates that sellers remain dominant in the market, and the trend could persist unless a reversal signal occurs with dots flipping below the price.
RSI (28): The Relative Strength Index reads 30.98, hovering near the oversold territory. This suggests that the pair is approaching an area where buying interest could emerge, signaling a potential short-term correction or consolidation phase before the next directional move.
Stochastic (5,3,3): The Stochastic oscillator shows values of 2.90 (K) and 3.26 (D), both deep in oversold territory. This indicates extreme selling pressure, and although the downtrend remains strong, a technical rebound might occur soon if the indicator crosses upward, hinting at temporary bullish correction.


Support and Resistance:
Support:
The nearest support level lies around 0.5630, aligning with the lower boundary of the descending channel and a recent swing low.
Resistance: The initial resistance is seen near 0.5740, coinciding with the upper band of the bearish channel and previous consolidation highs.


Conclusion and Consideration:
The NZDUSD H4 technical analysis suggests that the pair remains entrenched in a strong bearish trend, with price action confined within a downward channel. Although both RSI and Stochastic indicate oversold conditions, the Parabolic SAR supports continued bearish sentiment. Traders should watch for corrective pullbacks toward resistance levels, which may offer renewed selling opportunities if the overall bearish channel structure holds. From a fundamental perspective, upcoming New Zealand labor data and the RBNZ Governor’s remarks could inject volatility, while stronger-than-expected US employment and PMI data may further weigh on the NZD.


Disclaimer: The analysis provided for NZD/USD is for informational purposes only and does not constitute investment advice. Traders are encouraged to perform their own analysis and research before making any trading decisions on NZDUSD. Market conditions can change quickly, so staying informed with the latest data is essential.


FXGlory
11.05.2025
 
GBPUSD H4 Technical and Fundamental Analysis for 11.06.2025


GBPUSD H4 Technical and Fundamental Analysis for 11.06.2025.jpg


Time Zone: GMT +2
Time Frame: 4 Hours (H4)


Fundamental Analysis:

The GBP/USD currency pair continues to reflect ongoing market uncertainty as key economic events unfold today. For the USD, traders should closely monitor the Challenger Job Cut Announcements and the EIA Natural Gas Stocks data, as these reports can influence short-term volatility in the market. Additionally, speeches from prominent FOMC members, including Federal Reserve Governor Michael Barr and President John Williams, could inject significant volatility into USD trading, especially if their remarks imply potential shifts in monetary policy. On the GBP side, today's release of the Construction PMI and the Bank of England's Monetary Policy Report, along with Governor Andrew Bailey's press conference, may significantly impact market sentiment and the GBP’s valuation.


Price Action:
The GBP/USD H4 chart analysis highlights a distinct bearish channel, confirming strong downward momentum. Recently, price action has sharply breached the lower boundary of this bearish channel, indicating an aggressive selling pressure. While a brief corrective phase is expected given the oversold conditions, current price action strongly suggests bears are in control, forecasting a potential continuation of the bearish trend.


Key Technical Indicators:
Moving Average (100):
Current candles are positioned significantly below the 100-period moving average, suggesting a strong bearish sentiment. However, the distance from the average is substantial, indicating that a corrective movement towards the moving average could occur in the short term.
RSI (28): The RSI stands at 34.79, reflecting oversold conditions and indicating potential exhaustion of the bearish momentum. Traders should remain alert for a possible bullish divergence or correction from current levels.
Williams %R: The Williams %R indicator is currently at -71.74, also denoting oversold conditions. This reinforces the possibility of a corrective rally but maintains the bearish sentiment overall as long as it remains below -50.


Support and Resistance:
Support
: Immediate support is observed near the recent lows around 1.3020, a critical level for the bears to maintain momentum.
Resistance: Resistance is identified at 1.3150, coinciding with the lower boundary of the previously broken bearish channel, now serving as dynamic resistance.


Conclusion and Consideration:
The GBP/USD H4 technical analysis suggests continued bearish momentum, supported by price action and key technical indicators including the Moving Average, RSI, and Williams %R. However, oversold conditions on these indicators imply a potential short-term correction or consolidation phase. Traders must stay vigilant due to significant fundamental events today, notably the central bank communications from both the Federal Reserve and Bank of England, which could substantially alter current market dynamics.


Disclaimer: The analysis provided for GBP/USD is for informational purposes only and does not constitute investment advice. Traders are encouraged to perform their own analysis and research before making any trading decisions on GBPUSD. Market conditions can change quickly, so staying informed with the latest data is essential.


FXGlory
11.06.2025
 
USDCAD H4 Technical and Fundamental Analysis for 11.07.2025


USDCAD-H4-Technical-and-Fundamental-Analysis-for-.2025-FXGLORY-1024x524.webp


Time Zone: GMT +2
Time Frame: 4 Hours (H4)


Fundamental Analysis:

Today, USD will likely face notable volatility as Federal Reserve officials, including Governor Christopher Waller, Philadelphia President Anna Paulson, St. Louis President Alberto Musalem, New York President John Williams, and Governor Philip Jefferson, are set to speak. Hawkish commentary from these FOMC members could strengthen the USD by signaling tighter monetary policy. Concurrently, the Canadian Dollar (CAD) is also expected to experience volatility due to employment data and unemployment rates from Statistics Canada, which directly influences the economic outlook for Canada, potentially impacting CAD significantly.


Price Action:
USD/CAD H4 price action analysis illustrates a bullish trend, correcting the bearish momentum faced earlier in 2025. The pair currently trades in the upper half of the regression channel, demonstrating continued upward strength. The short MA (9, blue) recently crossed above the longer MA (21, orange), confirming bullish momentum. Recent candles are supported by Parabolic SAR dots appearing beneath the price action, further validating the bullish scenario.


Key Technical Indicators:
Moving Averages (MA9 & MA21):
The short-term MA9 (blue) has recently crossed above the long-term MA21 (orange), signaling a strong bullish entry indication. The price continues to trade comfortably above both MAs, providing confidence in the current bullish outlook.
Parabolic SAR: The last three dots from the Parabolic SAR indicator are located beneath the candles, touching the long-term MA. This alignment confirms bullish momentum, suggesting ongoing upward potential in the USD CAD currency pair.
Average True Range (ATR): The ATR (14) currently stands at 0.00172, indicating relatively moderate volatility. This implies that significant price movements may still occur, but drastic swings are less likely in the immediate term, aiding traders in managing their stop-loss and take-profit strategies.


Support and Resistance:
Support:
Immediate psychological support is identified at the 1.40500 level, with subsequent key supports at 1.40000 and deeper at 1.39000.
Resistance: The initial resistance level is at 1.41400, functioning as a significant psychological and technical barrier.


Conclusion and Consideration:
The technical analysis for the USD-CAD H4 chart maintains a bullish bias, supported by MAs and Parabolic SAR. However, today's key speeches from FOMC members and employment data from Canada introduce potential volatility. Traders should remain cautious and consider tightening their risk management approaches in response to fundamental news.


Disclaimer: The analysis provided for USD/CAD is for informational purposes only and does not constitute investment advice. Traders are encouraged to perform their own analysis and research before making any trading decisions on USDCAD. Market conditions can change quickly, so staying informed with the latest data is essential.


FXGlory
11.07.2025
 

Create an account or login to comment

You must be a member in order to leave a comment

Create account

Create an account on our community. It's easy!

Log in

Already have an account? Log in here.

Similar threads

Users Who Are Viewing This Thread (Total: 0, Members: 0, Guests: 0)

Back
Top
AdBlock Detected

We get it, advertisements are annoying!

Sure, ad-blocking software does a great job at blocking ads, but it also blocks useful features of our website. For the best site experience please disable your AdBlocker.

I've Disabled AdBlock    No Thanks