What's new

Permission errors

  • Permission 'viewOthers' unknown for content type 'node' (src/XF/Entity/User.php:1278)
  • Permission 'viewOthers' unknown for content type 'node' (src/XF/Entity/User.php:1278)
  • Permission 'viewOthers' unknown for content type 'node' (src/XF/Entity/User.php:1278)
  • Permission 'viewOthers' unknown for content type 'node' (src/XF/Entity/User.php:1278)
  • Permission 'viewOthers' unknown for content type 'node' (src/XF/Entity/User.php:1278)
  • Permission 'viewOthers' unknown for content type 'node' (src/XF/Entity/User.php:1278)
Top Forex Forum | Get Forex Trading Strategies & Feeds | Forex Forum

This is a sample guest message. Register a free account today to become a member! Once signed in, you'll be able to participate on this site by adding your own topics and posts, as well as connect with other members through your own private inbox!

Forex News Daily Analysis By FXGlory

4.80 star(s) 4 Votes
EURUSD H4 Technical and Fundamental Analysis for 03.04.2026


EURUSD_H4_Technical_and_Fundamental_Analysis_For_02.04.2026-1024x524.webp


Time Zone: GMT +2
Time Frame: 4 Hours (H4)


Fundamental Analysis:

In this EURUSD H4 technical and fundamental analysis, the pair is likely to experience heightened volatility due to several high-impact economic releases from both the Eurozone and the United States. Key data for the Euro includes the S&P Global Services PMI, Eurozone Unemployment Rate, and PPI, which provide insight into economic growth, labor market conditions, and inflationary pressures. On the US side, the ADP Non-Farm Employment Change, ISM Non-Manufacturing PMI, US Services PMI, and the Federal Reserve’s Beige Book are major drivers that may influence USD strength and monetary policy expectations. The overall direction in this EURUSD daily analysis and price action for EURUSD H4 will largely depend on whether actual results exceed or miss forecasts, potentially triggering either a corrective rebound or further downside continuation.


Price Action:
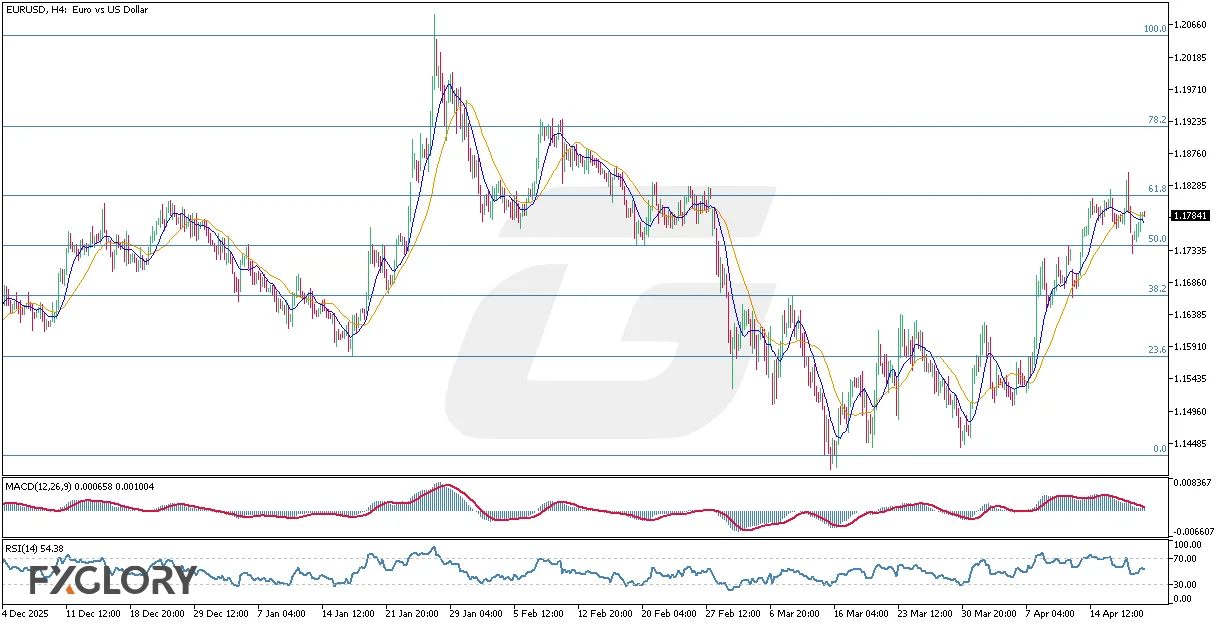
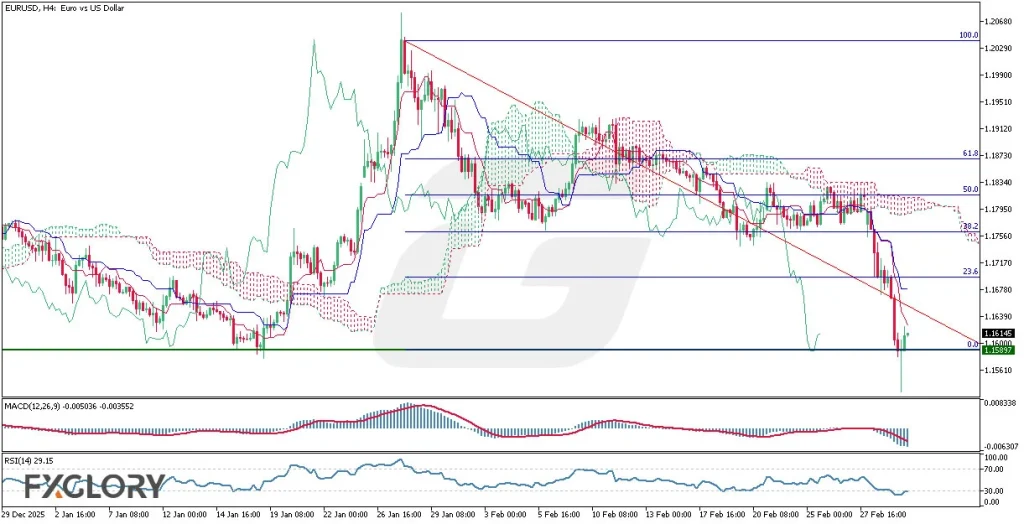
The EURUSD H4 chart analysis shows that the pair has entered a strong and accelerated bearish trend, with intensified selling pressure driving price down to the critical support level at 1.15897. The decline was marked by strong bearish candles and a clear break below prior consolidation zones and a descending trendline. After reaching this key support, a doji candle formed, signaling temporary market indecision and possible short-term seller exhaustion. A corrective rebound toward the 23.6% Fibonacci retracement level near 1.16780 is technically possible; however, the broader structure in this technical and fundamental chart daily analysis for EURUSD H4 remains bearish as long as price continues trading below key resistance levels and the descending trendline.


Key Technical Indicators:
Ichimoku Cloud:
Price is trading below the Kumo, confirming a dominant bearish trend on the EURUSD H4 chart. The Tenkan-sen remains below the Kijun-sen, and the cloud acts as dynamic resistance, reinforcing downside pressure.
MACD (12,26,9): The MACD remains in negative territory with the MACD line below the signal line, indicating sustained bearish momentum. The negative histogram supports continued selling pressure despite the possibility of a short-term correction.
RSI (14): The RSI is at 29.15, signaling oversold conditions and potential for a temporary rebound. However, in strong downtrends, RSI can remain oversold, keeping the broader bearish bias intact.


Support and Resistance:
Support:
Immediate support is located at 1.15897, the recent swing low and a significant demand zone on the EURUSD H4 chart.
Resistance: Nearest resistance is positioned around 1.16780 (23.6% Fibonacci retracement), followed by stronger resistance near 1.17560, aligning with previous consolidation and Ichimoku cloud resistance.


Conclusion and Consideration:
The EURUSD H4 technical and fundamental analysis indicates that the pair remains under strong bearish pressure despite signs of short-term exhaustion near 1.15897. Ichimoku and MACD confirm the dominant downtrend, while RSI suggests a possible corrective bounce toward the 23.6% Fibonacci level. With high-impact EUR and USD economic data scheduled, volatility is expected to increase, potentially accelerating price movement in either direction. Traders following this EURUSD daily analysis and price action for EURUSD H4 should closely monitor price behavior around key resistance levels and remain cautious during major economic releases.


Disclaimer: The analysis provided for EUR/USD is for informational purposes only and does not constitute investment advice. Traders are encouraged to perform their own analysis and research before making any trading decisions on EURUSD. Market conditions can change quickly, so staying informed with the latest data is essential.


FXGlory
03.04.2025
 
USDJPY H4 Technical and Fundamental Analysis for 03.10.2026


FXGlory-Daily-Analysis_USDJPY__H4_Technical_and_Fundamental_Analysis_For_03.10.2026--1024x524.webp


Time Zone: GMT +2
Time Frame: 4 Hours (H4)


Fundamental Analysis:

The USDJPY fundamental analysis today is influenced by both geopolitical developments and economic indicators from the United States and Japan. Market participants are closely monitoring statements from US President Donald Trump, who is scheduled to hold a press conference in Miami, as political comments and geopolitical discussions regarding Ukraine and Iran could influence market sentiment and safe-haven flows. Additionally, traders are watching US economic indicators such as the NFIB Small Business Optimism Index, ADP employment data (NER Pulse), and Existing Home Sales, which provide insights into the strength of the US economy and labor market conditions. Meanwhile, the Japanese Yen may react to domestic indicators including Household Spending, Machine Tool Orders, and the Bank of Japan Monetary Base report, all of which reflect economic demand and liquidity conditions in Japan. These events may generate volatility in the USD-JPY H4 fundamental and technical daily analysis, especially if data surprises shift expectations about economic growth or monetary policy.


Price Action:
The USD/JPY H4 price action analysis shows that the pair has maintained a bullish recovery over the past month. The USDJPY H4 price has moved upward from around 151, rebounding from the lower Bollinger Band and gradually climbing toward the 157–158 region. Throughout the last month, the price has mostly traded within the upper half of the Bollinger Bands, indicating sustained bullish momentum. Currently, the pair is trading close to the 100% Fibonacci level, fluctuating between the 61.8%, 78.2%, and 100% Fibonacci retracement levels, suggesting a consolidation phase near resistance in this USD JPY technical chart analysis.


Key Technical Indicators:
Bollinger Bands:
In this USDJPY H4 technical analysis, the price has mostly remained in the upper half of the Bollinger Bands during the past month, reflecting consistent bullish pressure. The earlier rebound from the lower band near 151 toward the 157–158 region indicates strengthening upward momentum, though the price is currently stabilizing near the upper band.
MACD (12,26,9): The MACD indicator currently shows values around 0.2722 and 0.3272, remaining above the zero line, which signals that bullish momentum still dominates the trend. However, the histogram appears relatively stable, suggesting that upward momentum is continuing but without strong acceleration.
RSI (14): The RSI is currently at 51.80, placing it in the neutral zone and indicating balanced market momentum. This level suggests the pair is neither overbought nor oversold, leaving room for further movement depending on upcoming market catalysts.


Support and Resistance:
Support:
The nearest support is located around 156.30, which aligns with the 61.8% Fibonacci retracement level and recent consolidation within the Bollinger Bands structure.
Resistance:
The main resistance level appears near 158.00, corresponding with the 100% Fibonacci level and recent highs in the USDJPY H4 chart analysis.


Conclusion and Consideration:
The USDJPY H4 technical and fundamental daily analysis indicates that the pair remains in a moderately bullish structure after recovering from the 151 area. Price action near the 100% Fibonacci level suggests the market is currently consolidating before a potential breakout or pullback. The MACD remains positive, while the RSI neutral reading reflects balanced momentum, indicating that traders should watch for confirmation of the next directional move. Upcoming US economic releases and geopolitical headlines could influence short-term volatility in the USDJPY price action forecast.


Disclaimer: The analysis provided for USD/JPY is for informational purposes only and does not constitute investment advice. Traders are encouraged to perform their own analysis and research before making any trading decisions on USDJPY. Market conditions can change quickly, so staying informed with the latest data is essential.


FXGlory
03.10.2025
 
Silver H4 Technical and Fundamental Analysis for 03.11.2026


Silver_H4_Technical_and_Fundamental_Analysis_For_03.11.2026-1024x524.webp


Time Zone: GMT +2
Time Frame: 4 Hours (H4)


Fundamental Analysis:

Silver H4 remains highly sensitive to today’s USD-related fundamentals, especially the upcoming CPI and Core CPI releases, which are key indicators for inflation and future Federal Reserve policy expectations. Stronger-than-forecast inflation data could support the US Dollar and Treasury yields, which may limit upside momentum in XAG/USD and pressure Silver prices. In addition, any hawkish remarks from Fed Governor Michelle Bowman could further strengthen the Dollar and weigh on precious metals. For today’s Silver technical and fundamental analysis, inflation data and Fed commentary are the main drivers likely to shape short-term price action on the H4 chart.


Price Action:
Looking at the Silver H4 chart analysis, ever since the Silver chart went through a major bearish move, the candles have been struggling to recover from that damage, showing signs of a sideways market trend moving between 70.676 and 95.286. The previously prolonged bullish momentum is now clashing with the market’s current struggle to recover from the strong bearish impulse, and that has left the chart in an undecided structure. Recent candles show a moderate rebound toward the mid-to-upper part of the range, but price is still trading below the major resistance zone, which keeps the broader XAG/USD H4 forecast neutral rather than fully bullish. In this technical analysis for Silver H4, the current price behavior suggests consolidation with recovery attempts, not yet a confirmed breakout trend.


Key Technical Indicators:
Bollinger Bands (60):
The Bollinger Bands are narrowing, signaling reduced volatility and the possibility of an upcoming expansion move. Price remains range-bound, so the next breakout or rejection will be important.
MACD (12,26,9): The MACD is still in positive territory, showing mild bullish momentum in Silver H4. However, the recovery remains limited and not strong enough to confirm a clear trend reversal.
Williams %R (14): Williams %R is near the overbought zone, indicating recent buying strength in the short term. Still, in a sideways market, this can also signal slowing momentum near resistance.


Support and Resistance:
Support:
The nearest support is at 83.690, which has recently acted as a short-term stabilization zone. Below that, 70.676 remains the major H4 support level.
Resistance: The immediate resistance is at 95.286, which continues to cap bullish recovery attempts. A break above it could improve the Silver H4 bullish outlook.


Conclusion and Consideration:
This Silver H4 chart technical analysis suggests that XAG/USD is still trapped inside a broad sideways structure after a severe bearish shock, with recovery attempts visible but not yet decisive. The narrowing Bollinger Bands, positive yet modest MACD structure, and near-overbought Williams %R reading all point to a market that is rebuilding bullish pressure while still facing clear resistance and uncertainty. From a fundamental analysis perspective, upcoming USD inflation data and Fed commentary could become the trigger that decides whether Silver breaks above 95.286 or rotates back into its range. Traders following this Silver daily analysis, technical analysis, and price action forecast should watch for a confirmed H4 breakout or rejection before assuming directional continuation.


Disclaimer: The analysis provided for XAG/USD is for informational purposes only and does not constitute investment advice. Traders are encouraged to perform their own analysis and research before making any trading decisions on XAGUSD. Market conditions can change quickly, so staying informed with the latest data is essential.


FXGlory
03.11.2026
 
GOLD H4 Technical and Fundamental Analysis for 03.13.2026


FXGlory-Daily-Analysis-GOLD_H4_Technical_and_Fundamental_Analysis_For_03.13.2026--1024x524.webp


Time Zone: GMT +2
Time Frame: 4 Hours (H4)


Fundamental Analysis:

This XAUUSD / GOLDUSD H4 technical and fundamental analysis shows gold trading in a cautious environment as the US Dollar remains sensitive to inflation, growth, and labor-market expectations. Today’s USD-related backdrop includes PCE, GDP, Durable Goods, Personal Income, Personal Spending, JOLTS, and University of Michigan data references, although several releases are delayed because of the US government shutdown. For gold price today and XAUUSD daily analysis, stronger US data would normally support the USD and weigh on gold, while softer data or delayed releases may reduce momentum in the Dollar and help gold stay supported. This keeps the market focused on safe-haven demand, Fed expectations, and interest-rate direction. Overall, the fundamental analysis for XAUUSD H4 remains mixed, with macro uncertainty helping gold hold value while USD strength still limits bullish expansion.


Price Action:
The price action analysis for GOLD H4 shows that gold is still moving between the strong 5,000 support and the ATH at 5,597.61, with price staying near the middle of this broader range. Although the market has shown a slight upward movement recently, it is still struggling to build enough strength above the 5,000 zone. The latest candles are red, reflecting bearish pressure during the last few H4 sessions, while buyers remain unable to push through the first important resistance near 5,250. This area is technically important because it aligns with recent price hesitation and nearby indicator resistance. In this gold H4 chart forecast, the current candle structure suggests consolidation with a short-term bearish bias unless buyers reclaim 5,250 with stronger momentum.


Key Technical Indicators:
Bollinger Bands:
In this XAU-USD H4 technical analysis, price is trading below the upper Bollinger Band and struggling to expand upward. The 5,250 resistance is reinforced by the upper band, making it the first technical barrier for bullish continuation.
Parabolic SAR: The Parabolic SAR dots are currently above the candles, which signals short-term bearish pressure on the H4 chart. This indicates that recent upside attempts remain weak unless the dots flip below price again.
MACD (12,26,9): The MACD reading at -7.640 and 5.385 shows fading bullish momentum and a weak short-term structure. In this GOLD/USD H4 chart analysis, the indicator supports the recent bearish candles and the loss of upside strength.
RSI (14): The RSI is at 38.38, which is below the neutral 50 level and reflects soft bearish momentum. It is not yet deeply oversold, so price may still remain under pressure before a stronger rebound appears.
Volume: Volume stands at 94,185, showing that the market is active but not yet in breakout mode. This supports the view that the current XAU USD price action is still consolidative rather than strongly trending.


Support and Resistance:
Support:
The key support is at 5,000, which has acted as a strong psychological and technical floor in the recent gold H4 price action analysis. A clear break below this level may open the way for deeper downside movement.
Resistance: The first resistance is at 5,250, where price meets the upper Bollinger Band and nearby Parabolic SAR pressure in this XAUUSD technical chart analysis. The major resistance remains the all-time high at 5,597.61.


Conclusion and Consideration:
This technical and fundamental daily analysis for GOLD H4 suggests that gold is still holding above a critical support zone, but short-term momentum remains bearish. The red candles, bearish Parabolic SAR placement, negative MACD structure, and RSI below 50 all point to weak near-term sentiment. At the same time, the broader market has not broken below 5,000, which keeps the larger structure stable for now. For gold price action and chart analysis, the market remains range-bound between 5,000 and 5,250, while a break outside this zone may define the next directional move. Traders should also watch USD-related macro sentiment closely, as it can quickly shift momentum in the gold market.


Disclaimer: The analysis provided for XAU/USD is for informational purposes only and does not constitute investment advice. Traders are encouraged to perform their own analysis and research before making any trading decisions on XAUUSD. Market conditions can change quickly, so staying informed with the latest data is essential.


FXGlory
03.13.2026
 

Create an account or login to comment

You must be a member in order to leave a comment

Create account

Create an account on our community. It's easy!

Log in

Already have an account? Log in here.

Similar threads

Users Who Are Viewing This Thread (Total: 0, Members: 0, Guests: 0)

Back
Top