FXOpen Trader
Active Member
Gold Price Corrects Lower, Crude Oil Price Aims Fresh Increase

Gold price gained bullish momentum above $1,825 before correcting lower. Crude oil price is holding the $87.50 support and might start a fresh increase.
Important Takeaways for Gold and Oil
Gold Price Technical Analysis
Gold price formed a support base near $1,788 and started a fresh increase against the US Dollar. The price gained pace for a move above the $1,800 level to move into a positive zone.
There was a clear move above the $1,820 level and the 50 hourly simple moving average. The price even climbed above the $1,835 resistance level. A high was formed near $1,841 on FXOpen before the price started a downside correction.
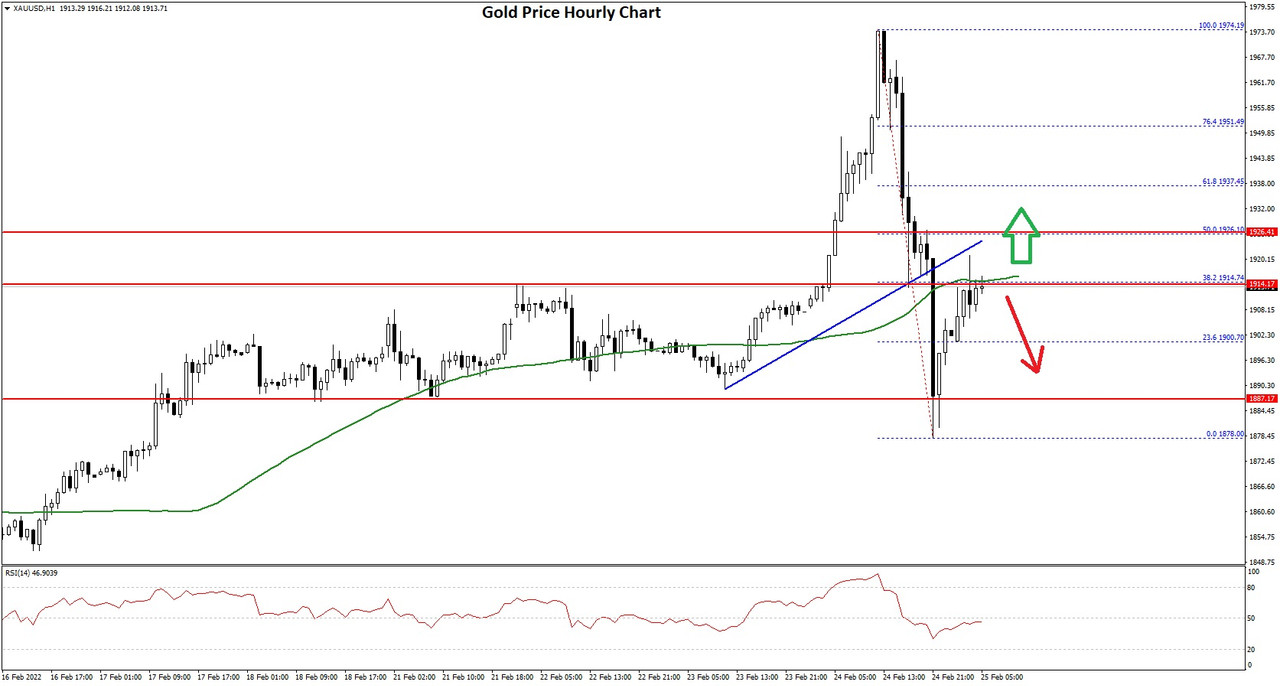
Gold Price Hourly Chart
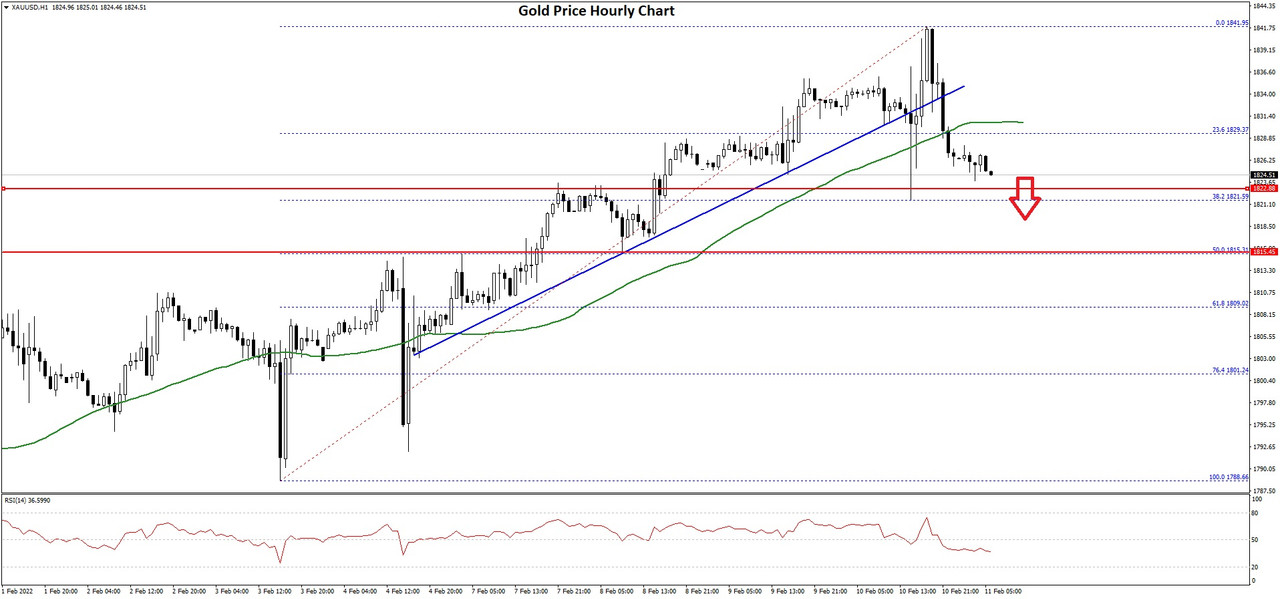
There was a break below the $1,835 level. Besides, there was a break below a key bullish trend line with support near $1,835 on the hourly chart of gold.
The price traded below the 23.6% Fib retracement level of the upward move from the $1,788 swing low to $1,841 high. On the downside, an initial support is near the $1,820 level. The first major support is near the $1,815 level.
It is near the 50% Fib retracement level of the upward move from the $1,788 swing low to $1,841 high. If there is a downside break below the $1,815 level, the price could decline to $1,800.
On the upside, the price is facing resistance near the $1,830 level. The main resistance is now forming near the $1,840 level. A close above the $1,840 level could open the doors for a steady increase towards $1,850. The next major resistance sits near the $1,865 level.
Read Full on FXOpen Company Blog...
Gold price gained bullish momentum above $1,825 before correcting lower. Crude oil price is holding the $87.50 support and might start a fresh increase.
Important Takeaways for Gold and Oil
- Gold price started a major increase above the $1,800 and $1,820 levels against the US Dollar.
- There was a break below a key bullish trend line with support near $1,835 on the hourly chart of gold.
- Crude oil price corrected lower, but it found support near $87.50.
- There was a break above a major bearish trend line with resistance near $88.85 on the hourly chart of XTI/USD.
Gold Price Technical Analysis
Gold price formed a support base near $1,788 and started a fresh increase against the US Dollar. The price gained pace for a move above the $1,800 level to move into a positive zone.
There was a clear move above the $1,820 level and the 50 hourly simple moving average. The price even climbed above the $1,835 resistance level. A high was formed near $1,841 on FXOpen before the price started a downside correction.
Gold Price Hourly Chart
There was a break below the $1,835 level. Besides, there was a break below a key bullish trend line with support near $1,835 on the hourly chart of gold.
The price traded below the 23.6% Fib retracement level of the upward move from the $1,788 swing low to $1,841 high. On the downside, an initial support is near the $1,820 level. The first major support is near the $1,815 level.
It is near the 50% Fib retracement level of the upward move from the $1,788 swing low to $1,841 high. If there is a downside break below the $1,815 level, the price could decline to $1,800.
On the upside, the price is facing resistance near the $1,830 level. The main resistance is now forming near the $1,840 level. A close above the $1,840 level could open the doors for a steady increase towards $1,850. The next major resistance sits near the $1,865 level.
Read Full on FXOpen Company Blog...


")

 .....................