What's new

Forex News Daily Market Analysis By FXOpen

4.00 star(s) 11 Votes
Gold approaching record high as instability fuels switch to physical assets


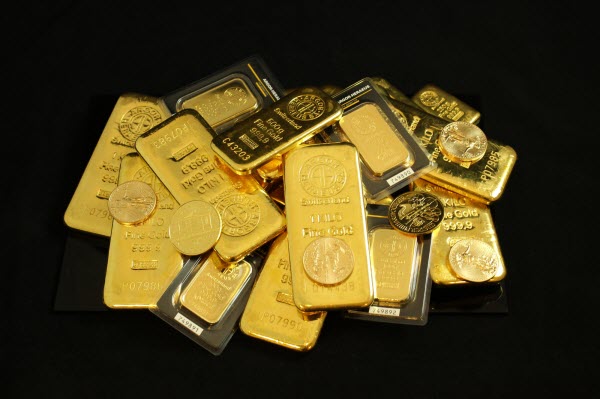
Ever since the very first items were made from gold over 3,500 years ago in the ancient Egyptian period, this particular precious metal has been held in high esteem as a means of storing a potentially appreciating physical asset.

Throughout the ages, whenever an ancient kingdom came under siege, its population would attempt to accumulate gold.

As time developed, and the industrialization of the world began, gold became a benchmark for investment, and has been constantly regarded as one of the most reliable physical commodities available on the global markets. Even in modern times, when a war occurs, or a political catastrophe, people buy gold.

These past few days have been no exception.

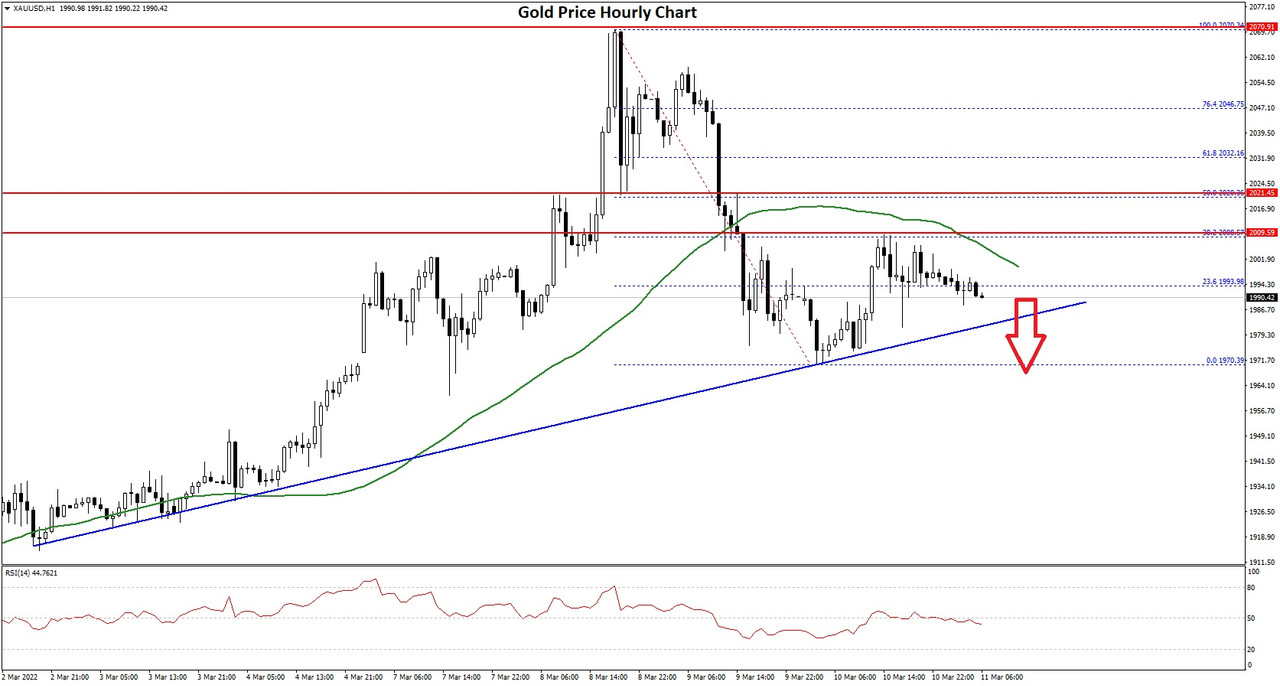
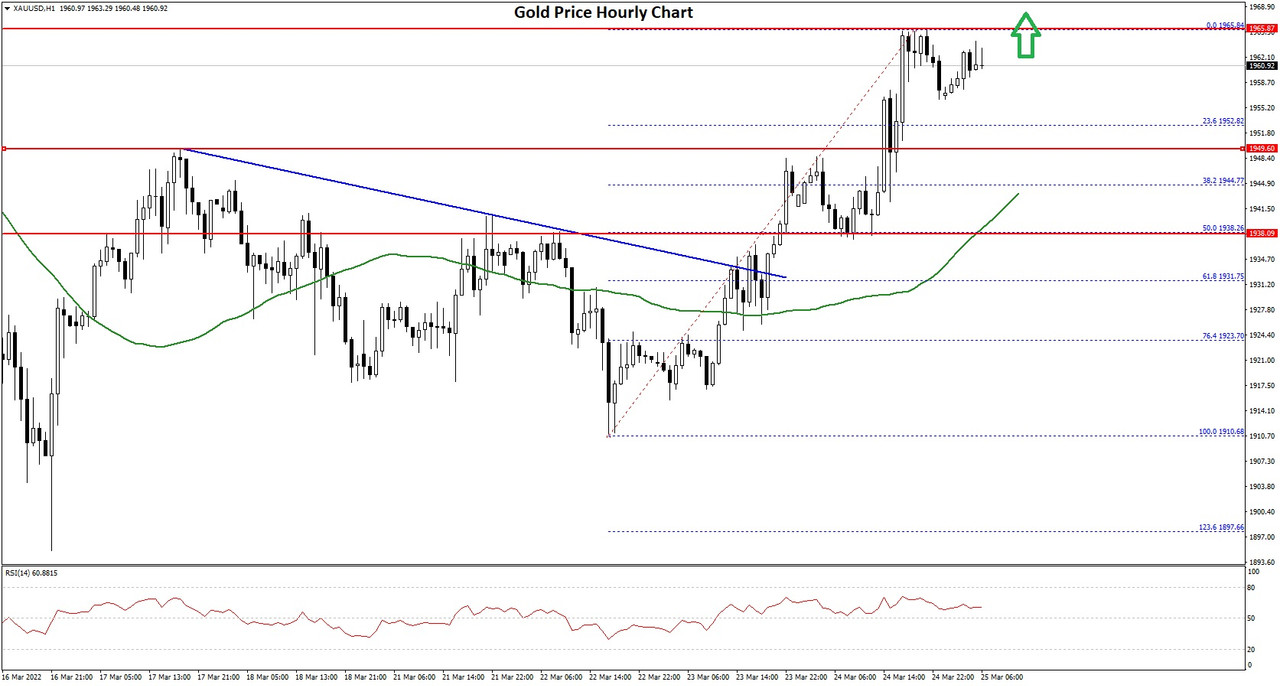
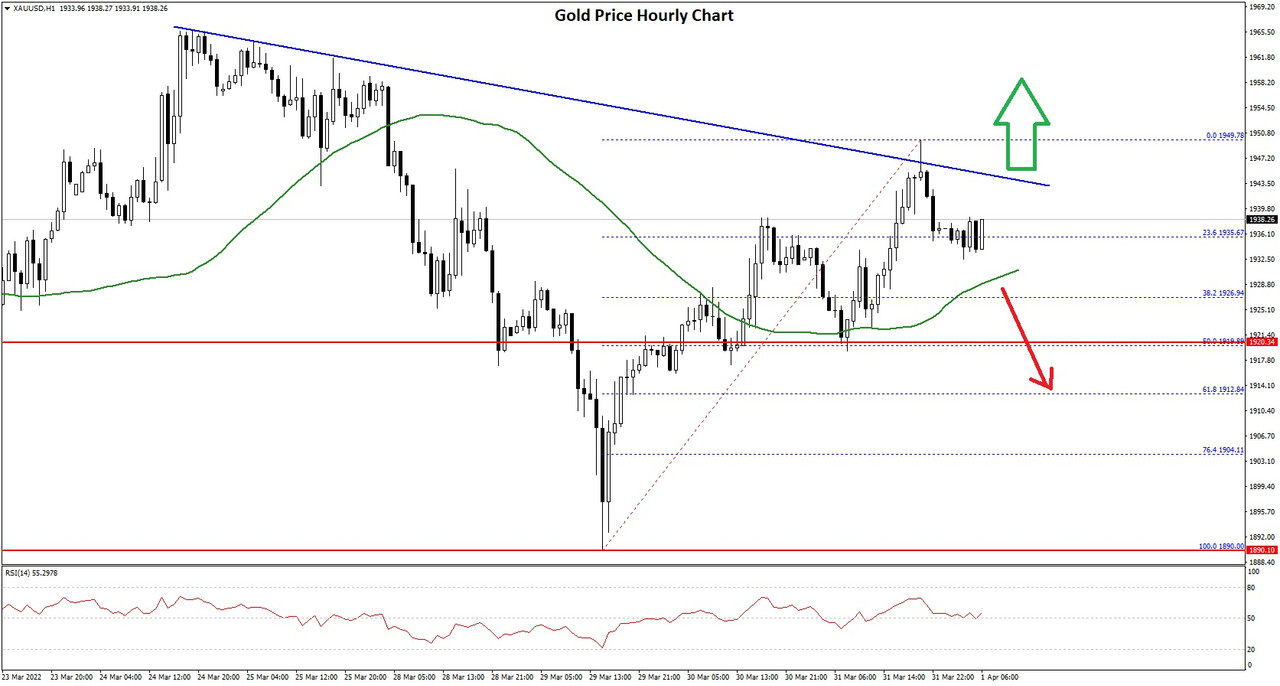
During the course of yesterday (March 8, 2022), gold prices rallied and headed toward an all-time high.

In the United States, by 12.10pm Eastern Standard Time (New York), the trading price of gold had risen by a remarkable 3.5% to $2,068.07 an ounce, which brought it near to its record trading value of $2072.50 which was set in the summer of 2020 during the period in which lockdowns were omnipresent across Europe and America, and fears of losing jobs and private property were widespread.

Those fears are here again, this time fueled by heavy-handed sanctions which are decimating the markets across America and Europe. The US stock market is suffering a tech stock obliteration which is beginning to cause analysts to compare it to the 'dot com' collapse of the early 2000s.

This is a very sudden new direction. Tech stocks were the solid, relatively low-risk investment for most investors and traders all the way from those trading part-time from home, to large hedge funds and wealth managers.

Now, with these in decline, the mainstay of the US economy is being measured and global investors are heading for the hard collateral that is precious metal.

Even nickel, which is used in engineering across most heavy industrial applications worldwide from car manufacturing to construction, has been soaring in price to the extent where pricing has become so difficult in the live market that the London Metal Exchange (LME) has suspended its trading.

One report this morning stated that a Chinese investor is facing losses running into the multi-billion-pound range as a result of the volatility in which nickel soared by as much as 111% to a record $101,365, followed by a two-day increase of up to 250% before falling back to $82,250 a tonne.

The London Metal Exchange has been pricing nickel for over 145 years, and yesterday's volatility was an all time record in the entire trading history of the venue.

Precious metals are therefore in huge demand, and gold is unique in that it is primarily used as a store of value, compared to other high-demand metals like copper and nickel whose primary use is in manufacturing and engineering.

Today, Reuters has explained that one particular futures trader had cited the combination of extremely inflationary energy prices, grain prices and base metal prices has contributed the major underlying support behind gold having increased so much in value.

Certainly investors are hanging onto physical assets, and those metals with an engineering use are rocketing due to the difficulties in obtaining them for factories to be able to meet the demand for their products or remain in business without having to halt production, leaving gold as an outright store of value which is heading for all time highs.

Fascinating market moves brought on by highly well analyzed circumstances.

FXOpen Blog
 
ETHUSD and LTCUSD Technical Analysis – 10th MAR, 2022


ETHUSD: Head and Shoulders Pattern Below $2,700

Ethereum continued to move in a bearish phase last week, having touched a low of $2,448 on March 7th, after which the prices started to consolidate above the level of $2,500.

We can see ETHUSD moving in a bearish momentum because of the Russia-Ukraine war and its effects on the global investor sentiments.

Despite the fact that some correction was seen in the USD, the medium-term outlook for Ethereum remains bearish with a downside projection of $2,200.

We can clearly see a head-and-shoulders pattern below the $2,700 handle which is a bearish pattern signifying the end of a bullish phase and the start of a bearish phase in the markets.

ETH is now trading just below its pivot level of $2,588 and is moving in a bearish channel. The price of ETHUSD is now testing its classic support level of $2,558, and Fibonacci support level of $2,580 after which the path towards $2,300 will get cleared.

The relative strength index is at 34 indicating a WEAKER demand for Ethereum, as well as the continuation of the selling pressure in the markets.

All of the technical indicators are giving a STRONG SELL market signal.

All of the moving averages are giving a STRONG SELL signal, and we are now looking at the levels of $2300 to $2200 in the short-term range.

ETH is now trading below both its 100 hourly and 200 hourly simple moving averages.

  • A bearish reversal seen below the $2700 mark in Eth
  • Short-term range appears to be strongly BEARISH
  • The daily RSI is below 50 at 44 indicating a BEARISH market
  • The average true range is indicating LESSER market volatility

Ether: Bearish Momentum Continues Below $2,700


ETHUSD is now moving in a strongly bearish momentum, with the prices trading below the $2,600 handle in the European trading session today.

Both the Stoch and StochRSI are indicating an OVERSOLD market, which means that a pullback in the levels of Ethereum is expected soon.

The Ethereum bulls have retracted, and we can see that the selling pressure has resumed which is expected to push down the prices below the $2,500 handle.

The prices of ETHUSD need to remain above $2,200 for any bullish reversal in the markets.

At present, we are looking for the immediate target of $2,300 after which it is expected to enter into a consolidation and correction phase.

This week, the key support level to watch is $2,200, and the key resistance level is $2,700.

ETH has declined -5.24% with a price change of -143.26$ in the past 24hrs, and has a trading volume of 13.621 billion USD.

We can see an Increase of 16.69% in the total trading volume in the last 24 hrs, which appears to be normal.

The Week Ahead

Ethereum has already exhausted its consolidation channel and is now moving into its next bearish phase towards the level of $2,300.

The ongoing Russia-Ukraine war crisis is continuing to affect the prices of Ethereum, as new investors are not willing to enter into the market because of the global crisis scenario and the waning demand in the global cryptocurrency markets.

If the prices of ETHUSD continue to remain above $2,200 this week, we can expect a bullish reversal next week.

The immediate short-term outlook for Ether has turned strongly BEARISH; the medium-term outlook has turned bearish; and the long-term outlook for Ether is NEUTRAL in present market conditions.

This week. Ether is expected to move in a range between $2,200 and $2,700, and next week, it is expected to enter into a consolidation phase above $2,500.

Technical Indicators:

The moving averages convergence divergence (12,26): at -16.78 indicating a SELL

The commodity channel index (14-day): at -117.12 indicating a SELL

The rate of price change: at -4.37 indicating a SELL

The average directional change (14-day): at 45.85 indicating a SELL

Read Full on FXOpen Company Blog...
 
Gold Price and Crude Oil Price At Risk of Downside Break


Gold price is correcting lower and trading below $2,000. Crude oil price is facing an increase in selling pressure below $105.

Important Takeaways for Gold and Oil


  • Gold price started a downside correction after a strong rally to $2,070 against the US Dollar.
  • There is a key bullish trend line forming with support near $1,985 on the hourly chart of gold.
  • Crude oil price corrected lower, but it found support near $100.00.
  • There was a break below a short-term ascending channel with support near $108.10 on the hourly chart of XTI/USD.

Gold Price Technical Analysis

Gold price formed a support base near $1,950 and started a fresh increase against the US Dollar. The price gained pace for a move above the $2,000 level to move into a positive zone.

There was a clear move above the $2,020 level and the 50 hourly simple moving average. The price even climbed above the $2,050 resistance level. A high was formed near $2,070 on FXOpen before the price started a downside correction.

Gold Price Hourly Chart


There was a break below the $2,000 level. The price even spiked below the $1,980 level, but it found support near $1,970. A low is formed near $1,970 and the price is now consolidating.

There was a move above the 23.6% Fib retracement level of the recent decline from the $2,070 swing high to $1,970 low. On the upside, the price is facing resistance near the $2,000 level and the 50 hourly simple moving average.

The main resistance is now forming near the $2,020 level. The 50% Fib retracement level of the recent decline from the $2,070 swing high to $1,970 low is also near $2,020. A close above the $2,020 level could open the doors for a steady increase towards $2,050. The next major resistance sits near the $2,070 level.

On the downside, an initial support is near the $1,985 level. There is also key bullish trend line forming with support near $1,985 on the hourly chart of gold. If there is a downside break below the $1,985 level, the price could decline to $1,920.

Read Full on FXOpen Company Blog...
 
GBP/USD Turns Red, USD/CAD Faces Key Resistance


GBP/USD started a major decline below 1.3200. USD/CAD is rising, but facing a major resistance near the 1.2800 zone.

Important Takeaways for GBP/USD and USD/CAD


  • The British Pound started a fresh decline from the 1.3300 resistance zone.
  • There is a key bearish trend line forming with resistance near 1.3055 on the hourly chart of GBP/USD.
  • USD/CAD is rising and showing positive signs above the 1.2750 level.
  • There are two key bearish trend lines forming with resistance near 1.2790 and 1.2820 on the hourly chart.

GBP/USD Technical Analysis

The British Pound started a strong decline from well above 1.3300 against the US Dollar. The GBP/USD pair gained bearish momentum after there was a break below the 1.3200 support.

The pair even broke the 1.3120 support level and the 50 hourly simple moving average. Finally, there was a move below the 1.3050 support. A low is formed near 1.3011 on FXOpen and the pair is now consolidating losses.

GBP/USD Hourly Chart


On the upside, an initial resistance is near the 1.3050 level. There is also a key bearish trend line forming with resistance near 1.3055 on the hourly chart of GBP/USD. The trend line is close to the 23.6% Fib retracement level of the recent decline from the 1.3194 swing high to 1.3011 low.

The next major resistance is near the 1.3100 level. It is near the 50% Fib retracement level of the recent decline from the 1.3194 swing high to 1.3011 low.

Any more gains could lead the pair towards the 1.3200 barrier in the near term. If not, the pair could continue to move down and might even break the 1.3000 support. If there is a downside break, GBP/USD might test the 1.2950 support. The next major support sits at 1.2880.

Read Full on FXOpen Company Blog...
 
BTCUSD and XRPUSD Technical Analysis – 15th MAR 2022


BTCUSD: Double Top Pattern Below $39,800

Bitcoin was unable to continue its bullish momentum last week, and after touching a high of $42,566 on March 9th, started its decline against the US dollar.

The downward phase continues today, and we can see BTCUSD touching $37,500 this week.

Today’s bearish momentum is the result of increased selling by long-term investors due to the continuing war between Russia and Ukraine and its global impact on the safe haven currencies like the US dollar and the yen.

The propagation of the bearish trend continues with bitcoin price trading below the $39,000 mark in today’s European trading session.

We can clearly see a double top pattern below the $39,800 handle which is a Bearish reversal pattern because it signifies the end of an uptrend and a shift towards a downtrend.

The StochRSI is indicating an OVERSOLD level which means that in the immediate short-term, an upwards correction in the prices is expected.

The relative strength index is at 39 indicating a WEAK demand for bitcoin at the current market levels.

Bitcoin is now moving below its 100 hourly simple moving average and below its 200 hourly exponential moving averages.

All of the major technical indicators are giving a STRONG SELL signal, which means that in the immediate short-term we are expecting targets of $37,000 and $36,500.

The average true range is indicating HIGH market volatility with a strong bearish momentum.

  • A bearish reversal is seen in bitcoin below $39,900
  • The Williams percent range is indicating an OVERBOUGHT level
  • The price is now trading just below its pivot level of $38,490
  • All of the moving averages are giving a STRONG SELL market signal

Bitcoin: Bearish Momentum Seen Below $39,900


In today’s European trading session, bitcoin continues to move in a strongly bearish momentum with a downside projection towards the level of $36,000.

In the immediate term we are expecting a continuation of this bearish trend, with the prices of bitcoin ranging between the levels of $35,000 and $38,000 as it is due to enter into a consolidation phase now.

The short-term risks have increased for bitcoin, and the selling pressure is expected to continue pushing down the prices below $38,000 today.

The immediate short-term outlook for bitcoin is strongly bearish, the medium-term outlook is bearish, and the long-term outlook remains neutral under present market conditions.

The price of BTCUSD is now facing its classic support level of $37,591 and Fibonacci support level of $38,265 after which the path towards $36,000 will get cleared.

We can see that the daily RSI is also printing at 45 which indicates that in the medium-term prices are expected to fall further.

In the last 24hrs BTCUSD has gone down by -1.49% with a price change of 582$ and has a 24hr trading volume of USD 23.987 billion. We can see an increase of 5.93% in the trading volume as compared to yesterday, which appears to be normal.

The Week Ahead

The prices of bitcoin are due to enter into a consolidation phase below $38,000. We can see some range-bounded movements between $35,000 to $38,000.

We can see that market volatility is increasing due to the global war crisis between Russia and Ukraine and its ripple effects on the major currencies and oil sector.

In the immediate short-term, bitcoin’s bearish momentum is expected to continue pushing below the $36,000 handle this week.

The prices of BTCUSD will need to remain above the important support levels of $35,000 this week.

Weekly outlook is projected at $36,000 with a consolidation zone of $37,500.

Technical Indicators:

The relative strength index (14-day): at 39.91 indicating a SELL

The average directional change (14-day): at 24.86 indicating a SELL

The rate of price change: at -0.937 indicating a SELL

The moving averages convergence divergence (12,26): at -45.00 indicating a SELL

Read Full on FXOpen Company Blog...
 
EUR/USD and EUR/JPY Eye Steady Increase


EUR/USD started a recovery wave from the 1.0850 zone. EUR/JPY climbed higher steadily and might rise further above 130.00.

Important Takeaways for EUR/USD and EUR/JPY


  • The Euro is attempting an upside correction above the 1.0950 level.
  • There is a key bullish trend line forming with support near 1.0940 on the hourly chart.
  • EUR/JPY gained bullish momentum after it broke the 127.50 resistance zone.
  • There is a major bullish trend line forming with support near 129.55 on the hourly chart.

EUR/USD Technical Analysis

The Euro found support near the 1.0850 zone against the US Dollar. The EUR/USD pair started a recovery wave and was able to climb above the 1.0900 level.

The pair even cleared the 1.0950 level and the 50 hourly simple moving average. Finally, the pair traded spiked to 1.1019 before it corrected gains. A low is formed near 1.0926 on FXOpen and the pair is now moving higher.

EUR/USD Hourly Chart


It moved above the 1.0950 level and tested the 50% Fib retracement level of the recent decline from the 1.1016 high to 1.0926 low.

On the upside, the pair is facing resistance near the 1.1000 level. It is near the 76.4% Fib retracement level of the recent decline from the 1.1016 high to 1.0926 low. The next major resistance is near the 1.1020 level.

A clear break above the 1.1020 resistance could push EUR/USD towards 1.1050. If the bulls remain in action, the pair could rise above the 1.1100 resistance zone in the near term.

On the downside, the pair might find support near the 1.0950 level. There is also a key bullish trend line forming with support near 1.0940 on the hourly chart. If there is a downside break below the 1.0940 support, the pair might accelerate lower. The next major support sits near the 1.0925 level, below which there is a risk of a larger decline.

Read Full on FXOpen Company Blog...
 
ETHUSD and LTCUSD Technical Analysis – 17th MAR, 2022


ETHUSD: Bullish Engulfing Pattern Above $2,400

Ethereum ended its bearish phase after touching a low of $2,498 on March 14 and moved into a consolidation channel.

On March 15, ETHUSD entered into a bullish phase which pushed its prices above the $2,700 handle in today’s European trading session.

We can clearly see a bullish engulfing pattern above the $2,400 handle which signifies the end of a bearish phase and the start of a bullish phase in the markets.

ETH is now trading just below its pivot level of $2,755 and moving in a bullish channel. The price of ETHUSD is now testing its classic resistance level of $2,763 and Fibonacci resistance level of $2,773, after which the path towards $2,900 will get cleared.

The relative strength index is at 59 indicating a STRONG demand for Ethereum and the continuation of the buying pressure in the markets.

All of the technical indicators are giving a STRONG BUY market signal.

All of the MAs are giving a BUY signal, and we are now looking at the level of $2,800 to $2,900 in the short-term range.

ETH is now trading above both the 100 Hourly and 200 Hourly SMAs.

  • A bullish reversal is seen in ETH above the $2,400 mark
  • The short-term range appears to be strongly BULLISH
  • The daily RSI is above 50 at 52, indicating a NEUTRAL market
  • The average true range is indicating LESSER market volatility

Ether: Bullish Reversal Seen Above $2,400


ETHUSD has gained a strong bullish momentum with the prices trading above the $2,700 handle in the European trading session today.

The StochRSI is indicating an OVERSOLD market, which means that a pullback in the levels of Ethereum can be expected soon.

Ethereum is now moving in a bullish continuation pattern, meaning further appreciation in the prices of ETHUSD.

ETHUSD is now facing its immediate resistance level of $2,775, after which we will see a linear progression towards $2,900.

The key support level to watch is $2,300, and this week’s key resistance level is $2,900.

ETH has gained 4.11% with a price change of 108.62$ in the past 24hrs and has a trading volume of 15.881 billion USD.

We can see a 5.84% increase in the total trading volume in the last 24 hrs. which appears to be normal.

The Week Ahead

Ethereum has entered a consolidation channel above the $2,400 handle and is now moving in a bullish momentum towards $3,000.

For the first time in 3 years, the US Federal Reserve hiked its interest rate by 0.25% which has weakened the US dollar and sparked a rally in some crypto currencies, including Ethereum, which had been weighed down by the Russia-Ukraine war.

The immediate short-term outlook for Ether has turned strongly BULLISH, the medium-term outlook has turned bullish, and the long-term outlook for Ether is NEUTRAL in present market conditions.

This week, Ether is expected to move in a range between $2,500 and $2,900, and to enter a consolidation phase above $2,900 next week.

Technical Indicators:

The moving averages convergence divergence (12,26): at 30.92 indicating a BUY

The ultimate oscillator: at 52.02 indicating a BUY

The rate of price change: at 1.712 indicating a BUY

The Williams percent range: at -25.91 indicating a BUY

Read Full on FXOpen Company Blog...
 
AUD/USD and NZD/USD Eye Additional Upsides


AUD/USD started a fresh increase above the 0.7300 zone. NZD/USD is also showing positive signs and there was a clear move above the 0.6850 resistance.

Important Takeaways for AUD/USD and NZD/USD


  • The Aussie Dollar started a fresh increase after it cleared 0.7250 against the US Dollar.
  • There was a break above a key bearish trend line with resistance near 0.7235 on the hourly chart of AUD/USD.
  • NZD/USD also climbed higher after forming a base above the 0.6720 level.
  • There was a move above a major bearish trend line with resistance near 0.6775 on the hourly chart of NZD/USD.

AUD/USD Technical Analysis

The Aussie Dollar found support near the 0.7180 zone against the US Dollar. The AUD/USD pair traded as low as 0.71654 on FXOpen before it started a fresh increase.

There was a clear move above the 0.7220 and 0.7250 resistance levels. The pair surged above the 0.7320 level and the 50 hourly simple moving average. Besides, there was a break above a key bearish trend line with resistance near 0.7235 on the hourly chart of AUD/USD.

AUD/USD Hourly Chart


The pair even broke the 0.7380 resistance zone and traded as high as 0.7393. It is now consolidating gains below 0.7350. On the downside, an initial support is near the 0.7345 level. The 23.6% Fib retracement level of the upward move from the 0.7205 swing low to 0.7393 high is also near the 0.7245 level.

The next support could be the 50 hourly simple moving average or 0.7300. It is near the 50% Fib retracement level of the upward move from the 0.7205 swing low to 0.7393 high.

If there is a downside break below the 0.7300 support, the pair could extend its decline towards the 0.7250 level. Any more downsides might send the pair toward the 0.7200 level.

On the upside, the AUD/USD pair is facing resistance near the 0.7395 level. The next major resistance is near the 0.7400 level. A close above the 0.7400 level could start a steady increase in the near term. The next major resistance could be 0.7450.

Read Full on FXOpen Company Blog...
 
GBP/USD and GBP/JPY Remain Well Supported


GBP/USD started a fresh increase from the 1.3000 support zone. GBP/JPY is also rising and might gain pace above the 157.20 resistance zone.

Important Takeaways for GBP/USD and GBP/JPY


  • The British Pound started a fresh increase from the 1.3000 support zone against the US Dollar.
  • There is a key bullish trend line forming with support near 1.3145 on the hourly chart of GBP/USD.
  • GBP/JPY also started a fresh increase after it cleared the 155.00 resistance zone.
  • There is a short-term rising channel forming with support near 156.65 on the hourly chart.

GBP/USD Technical Analysis

After forming a base above the 1.3000 support zone, the British Pound found started a fresh increase against the US Dollar. The GBP/USD pair gained pace above the 1.3120 resistance zone to move into a positive zone.

There was also a break above the 1.3150 zone and the 50 hourly simple moving average. It even spiked above the 1.3200 level, but failed to continue higher. The recent high was formed near 1.3196 on FXOpen and the pair is now correcting lower.

GBP/JPY Hourly Chart


There was a move below the 1.3175 level. The pair even traded below the 38.2% Fib retracement level of the upward move from the 1.3110 low to 1.3196 high.

It is now approaching the 1.3150 support zone. There is also a key bullish trend line forming with support near 1.3145 on the hourly chart of GBP/USD. It is near the 50% Fib retracement level of the upward move from the 1.3110 low to 1.3196 high.

The next major support is near the 1.3110 level. If there is a break below the 1.3110 support, the pair could test the 1.3050 support. If there are additional losses, the pair could decline towards the 1.3000 level.

If there is a fresh increase, the pair could test the 1.3190 level. The next major hurdle is near 1.3200, above which the pair could surge towards 1.3250 in the near term.

Read Full on FXOpen Company Blog...
 
BTCUSD and XRPUSD Technical Analysis – 22nd MAR 2022


BTCUSD: Bullish Engulfing Pattern Above $38,000

Bitcoin’s bearish phase has ended after touching a low of $37,649 on March 14th. As of now, the price of BTCUSD is moving in a bullish momentum above the $40,000 handle.

A renewed interest in bitcoin is observed as an alternative means of currency in Russia after the global bans imposed against Russian banks. This is one of the reasons why many investors are now buying bitcoin at present market levels.

In today’s European trading session, the propagation of the bullish trend continues with bitcoin trading above $42,000.

We can clearly see a bullish engulfing pattern above the $38,000 handle which is a bullish reversal pattern because it signifies the end of a downtrend and a shift towards an uptrend.

The Stoch and Williams percent range are indicating an overbought level which means that in the immediate short term, a decline in the prices is expected.

The relative strength index is at 60 indicating a STRONG demand for bitcoin at the current market levels.

Bitcoin is now moving above its 100 hourly simple moving average and its 200 hourly EMA.

All of the major technical indicators are giving a STRONG BUY signal, which means that in the immediate short term we are expecting targets of $43,000 and $45,000.

The average true range is indicating HIGH market volatility with a strong bullish momentum.

  • A bullish reversal is seen in bitcoin above $38,000
  • The Williams percent range is indicating an OVERBOUGHT level
  • The price is now trading just below its pivot level of $42,357
  • All of the MAs are giving a STRONG BUY market signal

Bitcoin: Bullish Reversal Seen Above $38,000


Bitcoin continues its strong bullish momentum with an upwards projection towards the level of $43,000 in the European trading session today.

In the immediate term, we are expecting a continuation of this bullish trend with the price of bitcoin ranging between $41,000 and $44,000 as it is due to enter into a consolidation phase.

The surge in the prices of bitcoin can also be explained by the optimism around the widespread usage of bitcoin in international cross border transactions between Russia and its trade partners.

The immediate short-term outlook for bitcoin is strongly bullish; the medium-term outlook is neutral; and the long-term outlook remains neutral under present market conditions.

The price of BTCUSD is now facing its classic resistance level of $42,703 and Fibonacci resistance level of $43,197, after which the path towards $44,000 will get cleared.

We can see that the daily RSI is also printing at 56 which indicates that in the medium-term prices are expected to appreciate further.

In the last 24hrs, BTCUSD has gone UP by 2.45% with a price change of $1,009, and has a 24hr trading volume of 33.989 billion USD. We can see an increase of 53.18% in the trading volume as compared to yesterday, which is due to its increased global demands.

The Week Ahead

The price of bitcoin is due to enter a consolidation phase below $43,000. We can see some range-bound movements in its levels between $41,000 and $44,000.

The on-chain metrics are also indicating a bullish outlook for bitcoin in the short-term range.

In the immediate short term this week, bitcoin’s bullish momentum is expected to continue pushing its levels above the $44,000. Also this week, the price of BTCUSD will need to remain above the important support level of $40,000.

The weekly outlook is projected at $44,000 with a consolidation zone of $42,500.

Technical Indicators:

The relative strength index (14-day): at 56.28 indicating a BUY

The average directional change (14-day): at 20.49 indicating a BUY

The rate of price change: at 9.16 indicating a BUY

The MA convergence divergence (12,26): at 420.80 indicating a BUY

Read Full on FXOpen Company Blog...
 
EUR/USD Faces Hurdle, USD/CHF Could Gain Pace


EUR/USD is facing resistance near the 1.1050 and 1.1080 levels. USD/CHF could gain pace if there is a move above the 0.9375 resistance.

Important Takeaways for EUR/USD and USD/CHF


  • The Euro started a downside correction from the 1.1140 resistance zone against the US Dollar.
  • There is a key bearish trend line with resistance near 1.1040 on the hourly chart of EUR/USD.
  • USD/CHF formed a base above the 0.9300 support zone and corrected higher.
  • There was a break above a major bearish trend line with resistance near 0.9330 on the hourly chart.

EUR/USD Technical Analysis

The Euro gained pace above the 1.1000 resistance level against the US Dollar. The EUR/USD pair even gained pace above the 1.1100 resistance level.

It traded as high as 1.1139 on FXOpen before the pair started a downside correction. There was a sharp decline below the 1.1100 and 1.1020 support levels. The pair even spiked below 1.1000 and traded as low as 1.0916.

EUR/USD Hourly Chart


EUR/USD is now rising and trading above 1.1000. There was a break above the 50% Fib retracement level of the recent decline from the 1.1071 swing high to 1.0961 low.

It is now consolidating above the 1.1020 level and the 50 hourly simple moving average. On the upside, an initial resistance is near the 1.1040 level. There is also a key bearish trend line with resistance near 1.1040 on the hourly chart of EUR/USD.

The next major resistance is near the 1.1070 zone. A clear upside break above the 1.1070 zone could open the doors for a steady move. The next major resistance sits near the 1.1140 level.

On the downside, an immediate support is near the 1.1015 level. The next major support is near the 1.0950 level. A downside break below the 1.0950 support could start another decline.

Read Full on FXOpen Company Blog...
 
ETHUSD and LTCUSD Technical Analysis – 24th MAR, 2022


ETHUSD: Double Bottom Pattern Above $2,800

Ethereum continues its upwards momentum from last week and has managed to cross the $3,000 levels in today’s European trading session.

The continued appreciation in the price of ETHUSD is a result of an increased demand for holding ETH amid its transition to ETH 2.0.

In today’s early Asian trading session, Ethereum touched an intraday high of $3,078 and an intraday low of $2,972.

We can clearly see a double bottom pattern above the $2,800 handle, which is bullish, and signifies the end of a bearish phase and the start of a bullish phase in the markets.

ETH is now trading just below its pivot level of $3,055 and moving within a bullish channel. The price of ETHUSD is testing its classic resistance level of $3,067 and Fibonacci resistance level of $3,079 after which the path towards $3,200 will get cleared.

The relative strength index is at 57 indicating a STRONG demand for Ethereum and the continuation of buying pressure in the markets.

All of the technical indicators are giving a STRONG BUY market signal.

All of the moving averages are giving a BUY signal, and we are now looking at the levels of $3,200 to $3,300 in the short-term range.

ETH is now trading above both its 100 hourly and 200 hourly simple moving averages.

  • Ether continues its bullish momentum above the $2,800 mark
  • The short-term range appears to be strongly BULLISH
  • The daily RSI is above 50 at 61, indicating a BULLISH market
  • The average true range is indicating LESSER market volatility

Ether Continues Bullish Momentum Above $2,800


ETHUSD has gained a strong bullish momentum with the price trading above the $3,000 handle in the European trading session today.

We can see continued gains in the prices of Ethereum since it touched a low of $2,171 on January 24th, which translates to a gain of 39% in 2 months.

Ethereum is now moving in a bullish continuation pattern which indicates further appreciation in the prices of ETHUSD this week.

ETHUSD is now facing its immediate resistance level of $3,070, after which we will see a linear progression towards $3,200.

This week’s key support level to watch is $3,000, and key resistance level is $3,100.

ETH has gained 3.06% with a price change of 90.27$ in the past 24hrs, and has a trading volume of 17.442 billion USD.

We can see a 25.59% increase in the total trading volume in the last 24 hrs. as more long-term investors are coming back into the markets.

The Week Ahead

At present, Ethereum bulls have managed to push the prices of ETHUSD above $3,000. If the price of ETHUSD remains above these levels, we may see a linear progression towards $3,200 and $3,300 this week.

The immediate short-term outlook for Ether has turned strongly BULLISH, the medium-term outlook has turned bullish, and the long-term outlook for Ether is NEUTRAL in present market conditions.

This week, Ether is expected to move in a range between $3,000 and $3,200, and next week, Ether is expected to enter a consolidation phase above $3,200.

ETH 2.0

Ethereum is to enter into a proof-of-stake consensus mechanism which will eliminate the high energy mining requirements and also bring down the ETH transaction fees.

This Ethereum 2.0 upgrade will happen in phases. The final transition will reduce the total energy requirements by 99% and at the same time scale the network capacity by increasing the number of transactions to 100,000 transactions per second (TPS). In comparison, at present, the leading payment service network VISA can process up to 65,000 TPS.

Technical Indicators:

The moving averages convergence divergence (12,26): at 15.93 indicating a BUY

The ultimate oscillator: at 54.44 indicating a BUY

Rate of price change: at 2.514 indicating a BUY

The Williams percent range: at -31.74 indicating a BUY

Read Full on FXOpen Company Blog...
 
Gold Price and Crude Oil Price Eye Additional Gains


Gold price started a fresh increase above the $1,950 resistance. Crude oil price could regain traction if it stays above the $105 support zone.

Important Takeaways for Gold and Oil


  • Gold price started a fresh increase above $1,930 and $1,950 against the US Dollar.
  • There was a break above a key bearish trend line with resistance near $1,932 on the hourly chart of gold.
  • Crude oil price also started a fresh increase from the $95 support zone.
  • Recently, there was a break below a major bullish trend line with support near $113.30 on the hourly chart of XTI/USD.

Gold Price Technical Analysis

Gold price formed a support base near $1,910 and started a fresh increase against the US Dollar. The price gained pace for a move above the $1,930 level to move into a positive zone.

There was a clear move above the $1,950 level and the 50 hourly simple moving average. The price even climbed above the $1,960 resistance level. Besides, there was a break above a key bearish trend line with resistance near $1,932 on the hourly chart of gold.

Gold Price Hourly Chart


A high was formed near $1,965 on FXOpen and the price is now consolidating gains. On the downside, an initial support is near the $1,958 level. The first major support is near the $1,952 level. It is near the 23.6% Fib retracement level of the upward move from the $1,910 swing low to $1,965 high.

The next major support is near the $1,950 level. The main support sits near the $1,938 level. It is near the 50% Fib retracement level of the upward move from the $1,910 swing low to $1,965 high.

On the upside, the price is facing resistance near the $1,965 level. The main resistance is now forming near the $1,980 level. A close above the $1,980 level could open the doors for a steady increase towards $2,000. The next major resistance sits near the $2,030 level.

Read Full on FXOpen Company Blog...
 
GBP/USD and EUR/GBP Remain At Risk of More Losses


GBP/USD started a fresh decline from well above the 1.3250 level. EUR/GBP is also declining and trading below the 0.8350 support zone.

Important Takeaways for GBP/USD and EUR/GBP


  • The British Pound started a fresh decline from well above 1.3250 against the US Dollar.
  • There was a break below a key contracting triangle with support near 1.3170 on the hourly chart of GBP/USD.
  • EUR/GBP failed to stay above 0.8380 and started a fresh decline.
  • There was a move below a major rising channel with support near 0.8335 on the hourly chart.

GBP/USD Technical Analysis

The British Pound struggled to settle above the 1.3280 resistance zone against the US Dollar. The GBP/USD pair started a fresh decline below the 1.3250 support zone.

There was a clear move below the 1.3220 level and the 50 hourly simple moving average. The bears pushed the pair below the 1.3200 level. There was a break below the 50% Fib retracement level of the upward move from the 1.3120 swing low to 1.3298 high (formed on FXOpen).

GBP/USD Hourly Chart


Besides, there was a break below a key contracting triangle with support near 1.3170 on the hourly chart of GBP/USD.

The pair is now trading below the 76.4% Fib retracement level of the upward move from the 1.3120 swing low to 1.3298 high. It seems like the pair might continue to move down towards the 1.3130 support zone.

The next major support sits near the 1.3120 level. Any more losses could lead the pair towards the 1.3050 support zone. On the upside, an initial resistance is near the 1.3175 level.

The next main resistance is near the 1.3185 zone (the previous support) or the 50 hourly simple moving average. A clear upside break above the 1.3185 and 1.3200 resistance levels could open the doors for a steady increase in the near term.

Read Full on FXOpen Company Blog...
 
BTCUSD and XRPUSD Technical Analysis – 29th MAR 2022


BTCUSD: Bullish Engulfing Pattern Above $42,000

We can see continuous appreciation in the price of BTCUSD from last week, and today it has managed to cross the $47,000 handle in the European trading session.

Due to increased buying pressure, the price of bitcoin has been rising for 7 consecutive days, and the upwards growth also suggests that we are aiming for the level of $50,000.

The strong wave of this bullish trend continues, with the price of bitcoin trading above the $47,500 mark in the European trading session today.

We can clearly see a bullish engulfing pattern above the $42,000 handle, which is a bullish reversal pattern because it signifies the end of a downtrend and a shift towards an uptrend.

The Stoch and Williams percent range are indicating an overbought level, which means that in the immediate short term, a decline in the prices is expected.

The relative strength index is at 57 indicating a STRONG demand for bitcoin at the current market levels.

Bitcoin is now moving above its 100 hourly simple moving average, and its 200 hourly exponential MA.

All of the major technical indicators are giving a STRONG BUY signal, which means that in the immediate short term, we are expecting targets of 46,000 and 48,000.

The average true range is indicating LESSER market volatility with a strongly bullish momentum.

  • A bullish continuation pattern is seen above $42,000
  • The StochRSI is indicating an OVERSOLD level
  • The price is now trading just below its pivot levels of $47,585
  • All of the moving averages are giving a STRONG BUY market signal

Bitcoin: Bullish Continuation Pattern Seen Above $42,000


Bitcoin continues to move in a strong bullish momentum with an upwards projection towards the level of $48,000 in the European trading session today.

In the immediate short term, we are expecting a continuation of this bullish trend with the price ranging between $46,000 and $49,000 as it is due to enter into a consolidation phase.

We can see optimism among bitcoin traders, as it has managed to continue its upwards trend in the short-term range.

The immediate short-term outlook for bitcoin is strongly bullish, the medium-term outlook is bullish, and the long-term outlook remains neutral under present market conditions.

The price of BTCUSD is now facing its classic resistance level of 47,668 and Fibonacci resistance level of 47,726, after which the path towards 48,000 will get cleared.

We can see that the daily RSI is printing at 70 which indicates that in the medium-term prices are expected to appreciate further.

In the last 24hrs BTCUSD has gone UP by 1.39% with a price change of 653$, and has a 24hr trading volume of USD 35.173 billion. We can see an increase of 2.78% in the trading volume as compared to yesterday, which appears to be normal.

The Week Ahead

The price of bitcoin is due to enter a consolidation phase below the level of $48,000. We can see some range-bound movement in its levels between $46,000 to $48,000.

On January 24th bitcoin touched a low of $32,950, after which it has managed to rise by more than 41% to its current market level of $47,456.

In the immediate short term, bitcoin’s bullish momentum is expected to continue pushing its levels above the $48,000 handle this week. The price of BTCUSD will need to remain above the important support level of $45,000.

The weekly outlook is projected at $49,000 with a consolidation zone of $46,500.

Technical Indicators:

The relative strength index (14-day): at 56.33 indicating a BUY

The average directional change (14-day): at 29.23 indicating a BUY

Bull/Bear power(13-day): at 72.28 indicating a BUY

The moving averages convergence divergence (12,26): at 275.90 indicating a BUY

Read Full on FXOpen Company Blog...
 
EUR/USD Attempts Recovery While USD/JPY Trims Gains


EUR/USD started a fresh increase from the 1.0940 support zone. USD/JPY rallied above 124.50 before it faced sellers near 125.00.

Important Takeaways for EUR/USD and USD/JPY


  • The Euro started an upside correction from the 1.0940 zone.
  • There was a break above a key bearish trend line with resistance near 1.1025 on the hourly chart of EUR/USD.
  • USD/JPY started a strong upward move above the 122.00 and 123.50 resistance levels.
  • Recently, there was a move below a major bullish trend line with support near 123.00 on the hourly chart.

EUR/USD Technical Analysis

This past week, the Euro started saw bearish moves below the 1.1050 level against the US Dollar. The EUR/USD pair declined heavily below the 1.1000 support zone.

The pair even broke the 1.0980 level and settled below the 50 hourly simple moving average. A low was formed near 1.0944 on FXOpen and the pair is now correcting higher. There was a move above the 1.1000 resistance levels.

EUR/USD Hourly Chart


Besides, there was a break above a key bearish trend line with resistance near 1.1025 on the hourly chart of EUR/USD. The pair climbed above the 1.1050 resistance and the 50 hourly simple moving average.

It formed a high near 1.1136 and is currently consolidating gains. It tested the 23.6% Fib retracement level of the recent increase from the 1.0944 swing low to 1.1136 high.

An immediate support is near the 1.1080. The next major support is near 1.1040 or the 50% Fib retracement level of the recent increase from the 1.0944 swing low to 1.1136 high, below which the pair could drop to 1.1000 in the near term.

An immediate resistance on the upside is near the 1.1120 level. The next major resistance is near the 1.1140 level. The main resistance is near the 1.1150 level. An upside break above 1.1150 could set the pace for a steady increase.

Read Full on FXOpen Company Blog...
 
ETHUSD and LTCUSD Technical Analysis – 31st MAR, 2022


ETHUSD: Bullish Engulfing Pattern Above $3,100

Ethereum continues its bullish momentum from last week and has managed to touch the $3,400 handle in the European trading session today.

Ethereum touched an intraday high of 3,423 and an intraday low of 3,372 in the early Asian trading session today.

We can clearly see a Bullish engulfing pattern above the $3,100 handle which is a bullish pattern and signifies the end of a bearish phase and the start of a bullish phase in the markets.

ETH is now trading just above its pivot level of 3,400 and is moving in a strongly bullish channel. The price of ETHUSD is now testing its classic resistance level of 3,407 and Fibonacci resistance level of 3,411, after which the path towards 3,500 will get cleared.

The relative strength index is at 54 indicating a NEUTRAL demand for Ethereum and the move towards the consolidation phase.

Both the Stoch and RSI are indicating a neutral level which means that the prices are due to enter into a consolidation zone.

All of the technical indicators are giving a STRONG BUY market signal.

All of the moving averages are giving a STRONG BUY signal, and we are now looking at the levels of $3,500 to $3,600 in the short-term range.

ETH is now trading above both its 100 and 200 hourly simple moving averages.

  • Ether continues its bullish momentum above the $3,100 mark
  • The short-term range appears to be strongly BULLISH
  • The daily RSI is above 50 at 72 indicating a BULLISH market
  • The average true range is indicating LESSER market volatility

Ether Continues Bullish Momentum Above $3,100


ETHUSD is now moving in a strongly bullish momentum with the prices trading above the $3,300 handle in the European trading session today.

We can see the Ichimoku bullish crossover pattern in the 1-hour timeframe which further validates the bullish momentum.

Ethereum is now moving in a bullish continuation pattern which indicates further appreciation in the prices of ETHUSD this week.

ETHUSD is now facing its immediate resistance level of $3,461 and $3,508, after which we will see a linear progression towards the level of $3,600.

The key support levels to watch are $3,351 and $3,229, and the price of ETHUSD needs to remain above these levels for the continuation of the bullish trend.

ETH has gained 0.08% with a price change of 2.61$ in the past 24hrs, and has a trading volume of 14.183 billion USD.

We can see a decrease of 27.33% in the total trading volume in the last 24 hrs. as Ethereum braces to enter into a consolidation zone.

The Week Ahead

At present, Ethereum bulls have managed to push the prices of ETHUSD above the level of $3,300. If the price of ETHUSD remains above these levels, we may see a linear progression towards the level of $3,500 and $3,600 this week.

The immediate short-term outlook for Ether has turned strongly BULLISH, the medium-term outlook has turned neutral, and the long-term outlook for Ether is NEUTRAL in present market conditions.

This week, Ether is expected to move in a range between $3,300 and $3,500, and next week, Ether is expected to enter in a consolidation phase above $3,300.

Technical Indicators:

The commodity channel index (14-day): at 60.38 indicating a BUY

Bull/Bear power (13-day): at 14.53 indicating a BUY

The rate of price change: at 0.160 indicating a BUY

The Williams percent range: at -41.74 indicating a BUY

Read Full on FXOpen Company Blog...
 
Gold Price Could Rally While Oil Price Extends Decline


Gold price started a fresh increase above the $1,920 resistance. Crude oil price is declining and remains at a risk of more losses below $97.50

Important Takeaways for Gold and Oil


  • Gold price started a fresh increase above $1,910 and $1,920 against the US Dollar.
  • There is a key bearish trend line forming with resistance near $1,942 on the hourly chart of gold.
  • Crude oil price started a fresh declined below the $105 support zone.
  • There is a major bearish trend line forming with resistance near $102.50 on the hourly chart of XTI/USD.

Gold Price Technical Analysis

Gold price formed a support base near $1,890 and started a fresh increase against the US Dollar. The price gained pace for a move above the $1,900 level to move into a positive zone.

There was a clear move above the $1,920 level and the 50 hourly simple moving average. The price even climbed above the $1,932 resistance level. However, it faced resistance near the $1,948 and $1,950 levels.

Gold Price Hourly Chart


There is also a key bearish trend line forming with resistance near $1,942 on the hourly chart of gold. A high is formed near $1,949 and the price is now consolidating gains.

It tested the 23.6% Fib retracement level of the upward move from the $1,890 swing low to $1,949 high. On the downside, an initial support is near the $1,992 level and the 50 hourly simple moving average. The next major support is near the $1,925 level.

The main support sits near the $1,920 level. It is near the 50% Fib retracement level of the upward move from the $1,890 swing low to $1,949 high.

On the upside, the price is facing resistance near the $1,948 level. The main resistance is now forming near the $1,950 level. A close above the $1,950 level could open the doors for a steady increase towards $1.980. The next major resistance sits near the $2,000 level.

Read Full on FXOpen Company Blog...
 
GBP/USD and USD/CAD Face Key Hurdles


GBP/USD is struggling below the 1.3200 resistance. USD/CAD is rising, but it must clear 1.2530 to start a fresh increase in the near term.

Important Takeaways for GBP/USD and USD/CAD


  • The British Pound started a fresh decline from the 1.3240 resistance zone.
  • There is a key bearish trend line forming with resistance near 1.3140 on the hourly chart of GBP/USD.
  • USD/CAD is rising and showing positive signs above the 1.2500 level.
  • There is a major bullish trend line forming with support near 1.2505 on the hourly chart.

GBP/USD Technical Analysis

The British Pound started a strong decline from well above 1.3320 against the US Dollar. The GBP/USD pair gained bearish momentum after there was a break below the 1.3250 support.

The pair even broke the 1.3200 support level and the 50 hourly simple moving average. Finally, there was a move below the 1.3100 support. A low was formed near 1.3051 on FXOpen and the pair is now correcting losses.

GBP/USD Hourly Chart


The recent swing low was near 1.3086 and the pair is now consolidating. It is trading above the 23.6% Fib retracement level of the recent decline from the 1.3175 swing high to 1.3086 low.

An immediate resistance is near the 1.3130 level and the 50 hourly simple moving average. It is near the 50% Fib retracement level of the recent decline from the 1.3175 swing high to 1.3086 low. Besides, there is a key bearish trend line forming with resistance near 1.3140 on the hourly chart of GBP/USD.

The next major resistance is near the 1.3150 level. Any more gains could lead the pair towards the 1.3200 barrier in the near term.

If not, the pair could continue to move down and might even break the 1.3050 support. If there is a downside break, GBP/USD might test the 1.3000 support. The next major support sits at 1.2950.

Read Full on FXOpen Company Blog...
 

Create an account or login to comment

You must be a member in order to leave a comment

Create account

Create an account on our community. It's easy!

Log in

Already have an account? Log in here.

Similar threads

Users Who Are Viewing This Thread (Total: 1, Members: 0, Guests: 1)

Top
AdBlock Detected

We get it, advertisements are annoying!

Sure, ad-blocking software does a great job at blocking ads, but it also blocks useful features of our website. For the best site experience please disable your AdBlocker.

I've Disabled AdBlock    No Thanks