What's new

Forex News Daily Market Analysis By FXOpen

4.00 star(s) 11 Votes
ETHUSD Technical Analysis – 06th APR, 2023


ETHUSD – Hammer Pattern Is Above $1,763


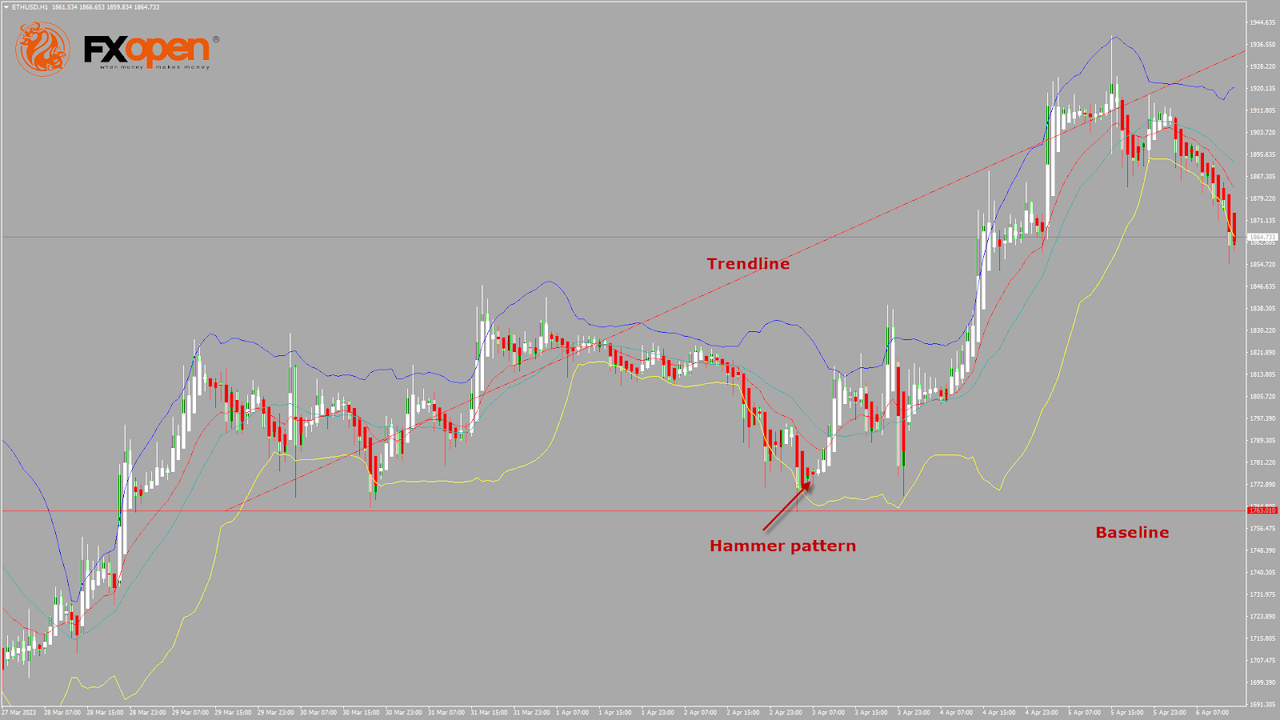
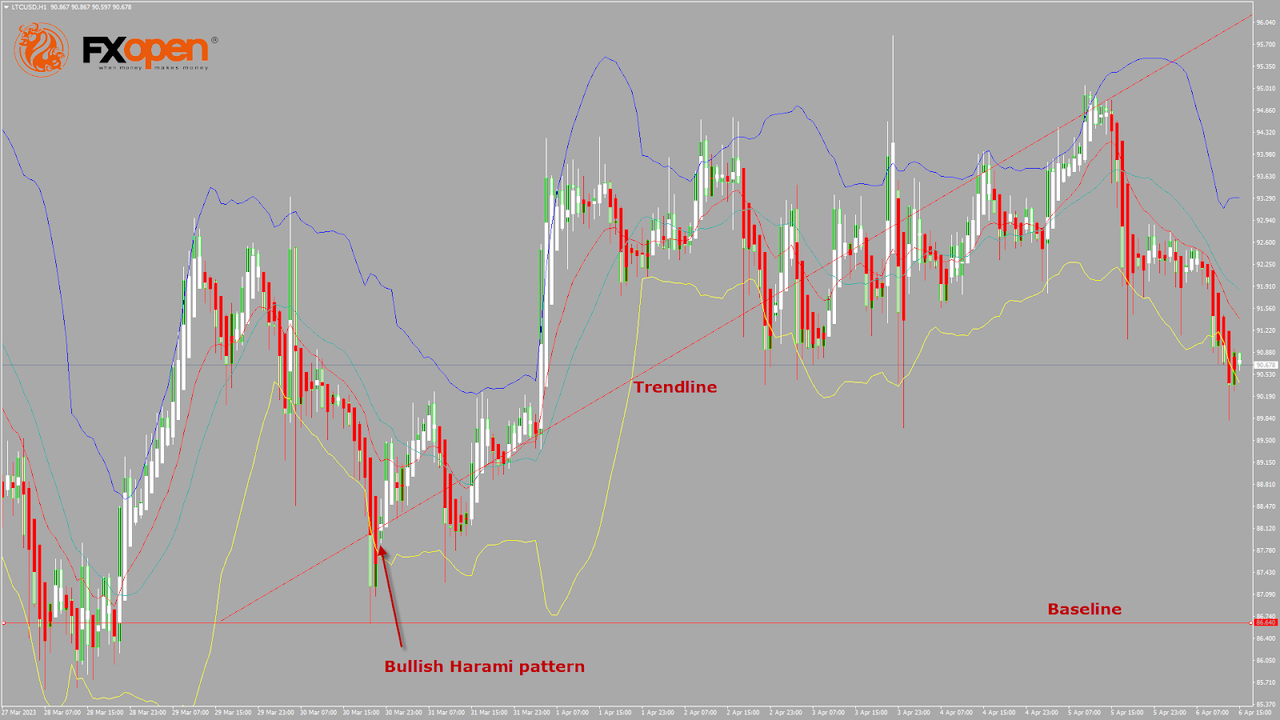
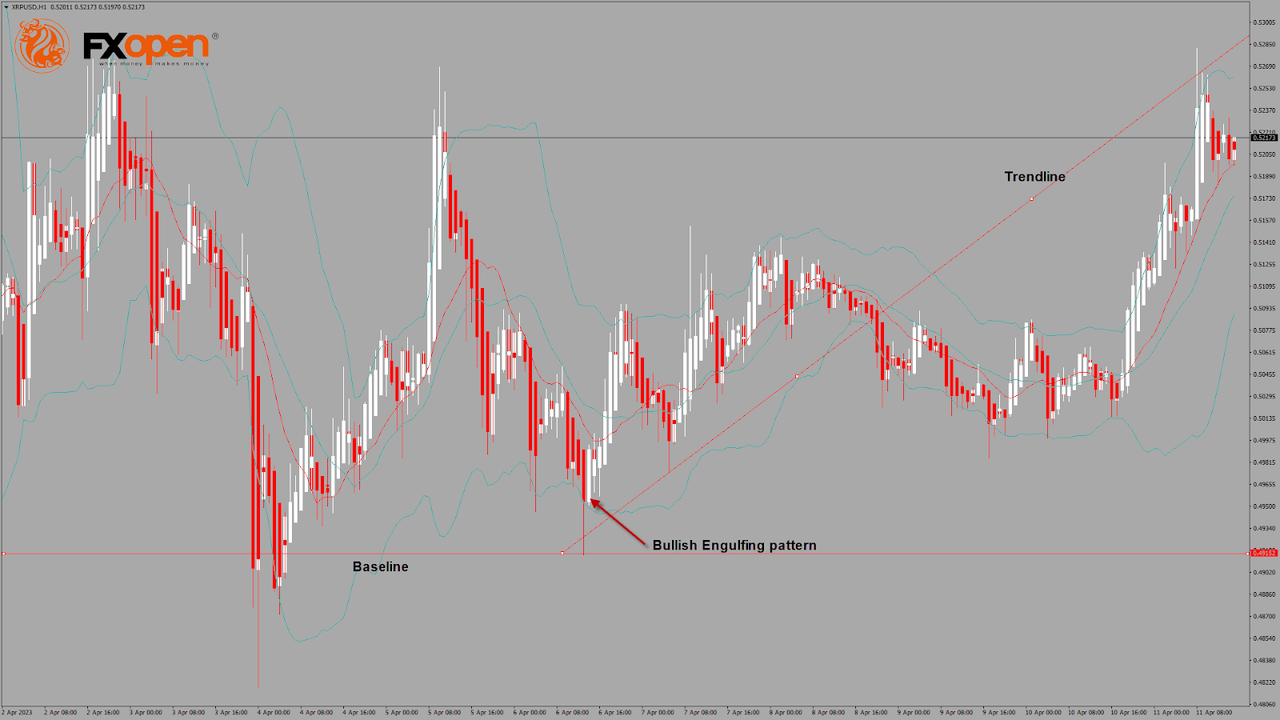
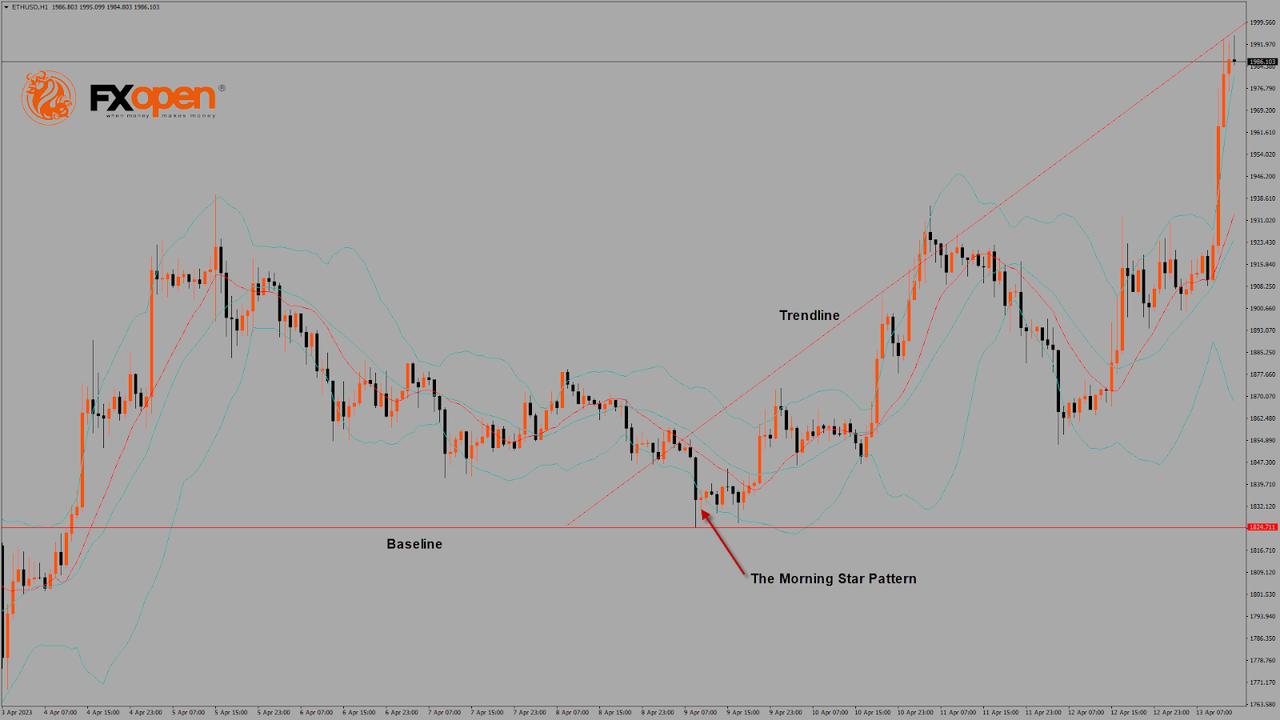
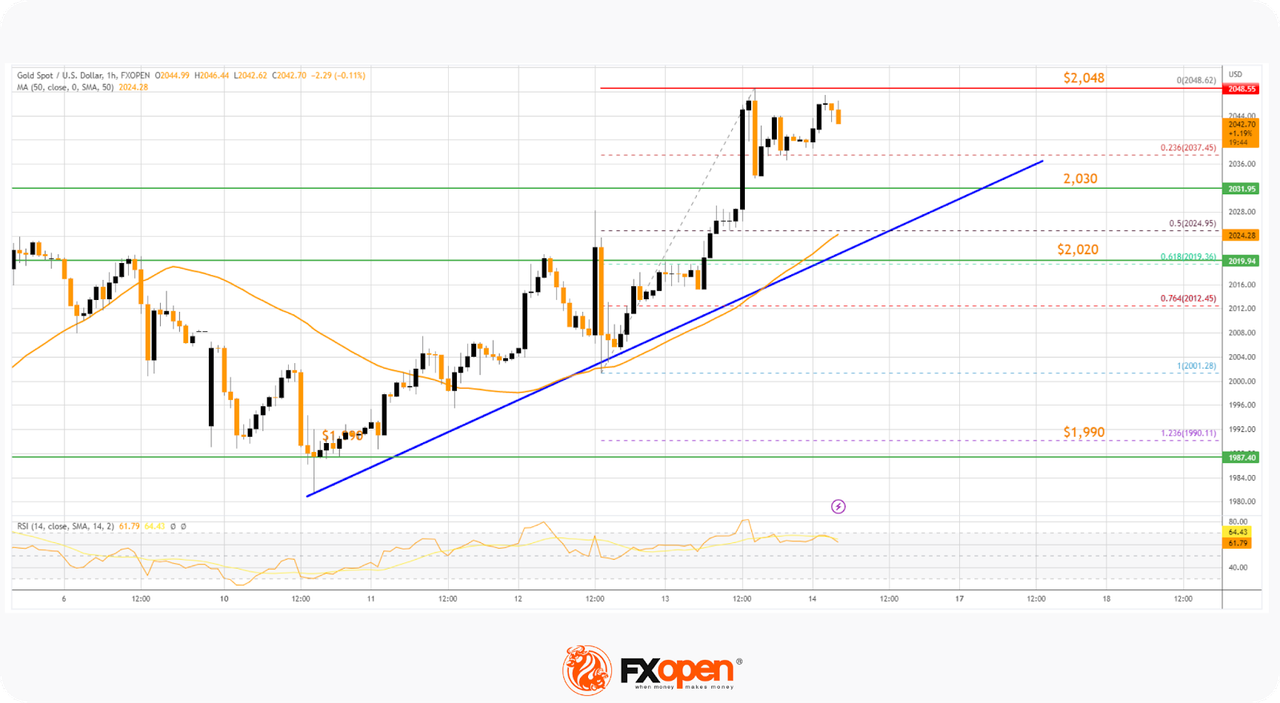
Bears couldn’t keep control of the market, and after touching a low of $1,763 on 03rd April, the ETH/USD pair started to correct upwards, touching a high of $1,939 on 05th April.

ETHUSD is now moving under bearish pressure after touching a high of $1,939 on 05th April. The immediate bearish pressure suggests we will enter a consolidation phase above the $1,850 level.

A hammer pattern is above the $1,763 handle. It’s a bullish pattern, which signifies the end of a bearish phase. Also, we can see the formation of the morning star pattern.

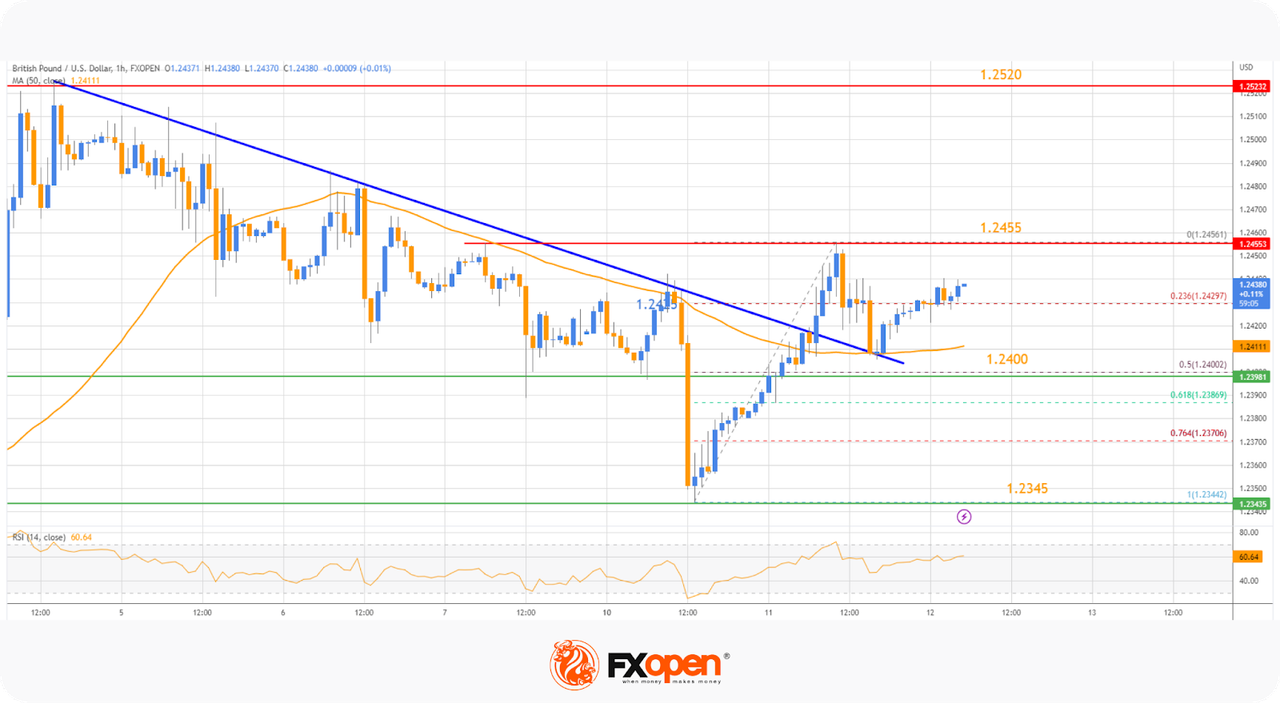
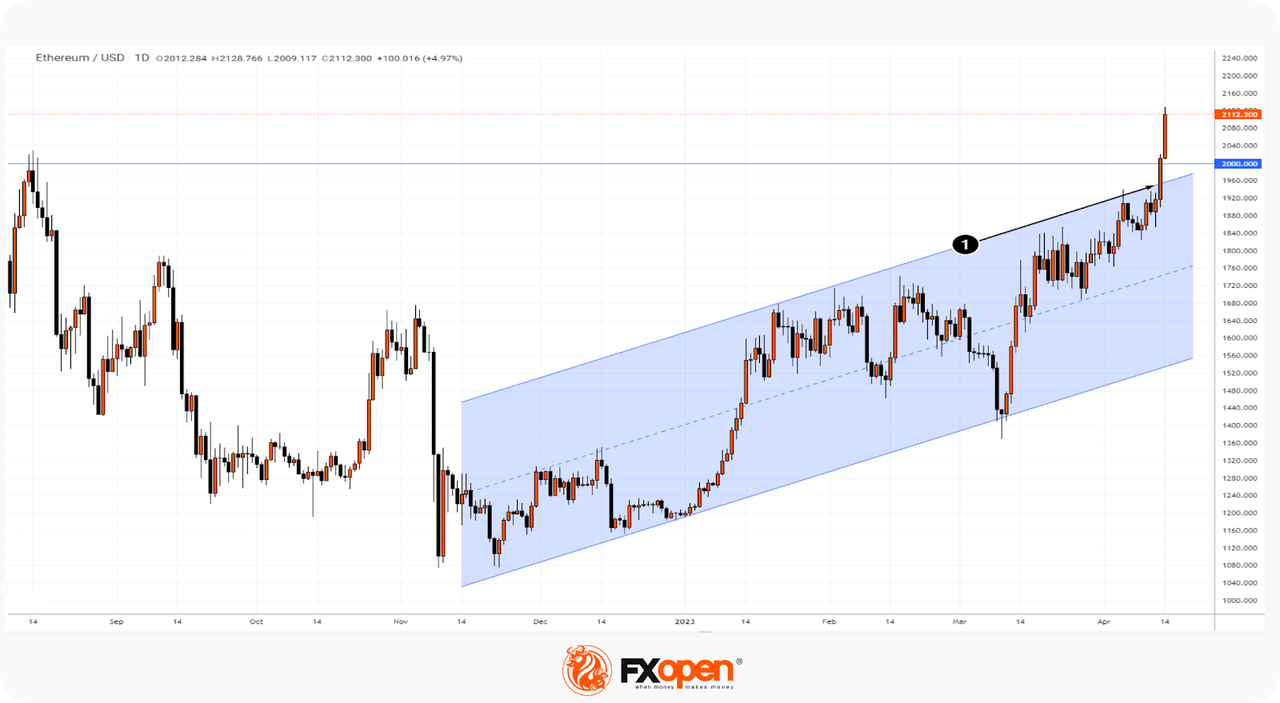
The price is above the Ichimoku cloud, indicating a bullish nature of the market. Moreover, Ethereum is near the support of the channel.

The relative strength index is at 56.91, indicating a strong demand for Ether and a continuation of the buying pressure in the markets.

The average directional index and commodity channel index give a neutral signal, meaning that the price is expected to enter into a consolidation phase in the short-term range.

Some of the technical indicators are giving a bullish market signal. Most moving averages are giving a bullish signal at the current market level of $1,866.

ETH is now trading above the 200-hour simple and 200-hour exponential moving averages.

  • Ether bullish reversal is seen above the $1,763 mark.
  • The short-term range is expected to be mildly bullish.
  • The average true range indicates high market volatility.

VIEW FULL ANALYSIS VISIT - FXOpen Blog...

Disclaimer: This Forecast represents FXOpen Companies opinion only, it should not be construed as an offer, invitation or recommendation in respect to FXOpen Companies products and services or as Financial Advice.
 
LTCUSD Technical Analysis – 06th APR, 2023


LTCUSD – Bullish Harami Pattern Is Above $86.64


Bears couldn't pull the market further down last week, and after touching a low of $86.64 on 30th March, the prices started to correct upwards against the US Dollar, touching a high of $94.91 on 03rd April.

We have seen a bullish opening of the markets this week.

We can see a bullish harami pattern above the $86.64 handle. It signifies the end of a bearish phase and the start of a bullish phase in the market.

The price of Litecoin is near the channel's support, indicating upcoming bullish movement. Also, Litecoin is trading above its 100-hour simple moving average and 100-hour exponential moving average, and it's above the pivot level of $92.93.

The relative strength index is at $52.50, indicating a neutral demand for Litecoin and a shift towards the market consolidation phase.

The prices of Litecoin continue to remain above some of the moving averages, which are giving a bullish signal at current market levels of $90.65

Both the Williams percent range and commodity channel index are signalling neutral market conditions, which means that the price is expected to remain in a consolidation phase in the short-term range.

The short-term outlook for Litecoin has turned mildly bullish.

  • Some of the technical indicators are giving a bullish signal.
  • Litecoin bullish reversal is seen above the $86.64 level.
  • The RSI gives a neutral signal.
  • The average true range indicates low market volatility.

VIEW FULL ANALYSIS VISIT - FXOpen Blog...

Disclaimer: This Forecast represents FXOpen Companies opinion only, it should not be construed as an offer, invitation or recommendation in respect to FXOpen Companies products and services or as Financial Advice.
 
GBP/USD And GBP/JPY Could Aim for Another Increase


GBP/USD started a downside correction from the 1.2520 resistance zone. GBP/JPY is rising and might aim for more upsides above the 164.00 resistance.

Important Takeaways for GBP/USD and GBP/JPY

  • The British Pound failed to break above the 1.2520 resistance and corrected lower against the US Dollar.
  • There is a key bearish trend line forming with resistance near 1.2460 on the hourly chart of GBP/USD.
  • GBP/JPY is slowly moving higher from the 163.00 zone.
  • There is a key rising channel forming with support near 163.75 on the hourly chart.

GBP/USD Technical Analysis


This past week, the British Pound formed a base above the 1.2400 line against the US Dollar. The GBP/USD pair started a steady increase above the 1.2425 resistance.

There was a move above the 50-hour simple moving average at 1.2460. It resulted in a break above the 1.2500 level. However, the bears were active near the 1.2520 resistance zone. A high was formed near 1.2525, and the pair started a downside correction.

There was a break below the 23.6% Fib retracement level of the upward move from the 1.2274 swing low to the 1.2525 high. GBP/USD even settled below the 50-hour simple moving average.

The previous resistance at 1.2425 is now acting as a support. The next major support is near the 1.2400 level, which coincides with the 50% Fib retracement level of the upward move from the 1.2274 swing low to the 1.2525 high.

If there is a break below the 1.2400 support, the pair will substantially decline. In the stated case, there is a risk of a drop toward the 1.2330 level or the 1.2274 low in the coming days.

Conversely, the pair might attempt a fresh increase from the 1.2425 support. Resistance on the upside is near the 50-hour simple moving average at 1.2455. There is also a key bearish trend line forming with resistance near 1.2460 on the hourly chart of GBP/USD.

A close above the trend line resistance could stage a fresh increase. The hourly RSI is also moving higher and approaching 50, above which it might signal a decent increase. The next major resistance is near the 1.2500 level, above which the pair could revisit the 1.2520 resistance region. Any more gains might call for a move toward 1.2600.

VIEW FULL ANALYSIS VISIT - FXOpen Blog...

Disclaimer: This Forecast represents FXOpen Companies opinion only, it should not be construed as an offer, invitation or recommendation in respect to FXOpen Companies products and services or as Financial Advice.
 
EUR/USD Aims Fresh Increase While EUR/JPY Eyes More Upsides


EUR/USD is consolidating above the key 1.0880 support zone. EUR/JPY is rising and might rally further if it clears the 145.40 resistance zone.

Important Takeaways for EUR/USD and EUR/JPY

  • The Euro started a downside correction from the 1.0970 zone.
  • There is a key bearish trend line forming with resistance near 1.0910 on the hourly chart at FXOpen.
  • EUR/JPY started a steady increase after it found support near 142.50.
  • There is a major bullish trend line forming with support near 144.20 on the hourly chart.

EUR/USD Technical Analysis


On the hourly chart of EUR/USD, the Euro remained well-bid above the 1.0880 zone and started a fresh increase against the US Dollar. EUR/USD was able to break above the 1.0920 resistance level.

The pair tested the 1.0970 zone before it started a correction. There was a break below the 1.0920 level, but the bulls were active near the key 1.0880 support. A low is formed at 1.0876, and the pair is now consolidating.

Immediate resistance is near the 1.0910 level. Besides, there is a key bearish trendline forming with resistance near 1.0910. The trendline is close to the 50% Fib retracement level of the downward move from the 1.0937 swing high to the 1.0876 low.

The next major resistance is near the 76.4% Fib retracement level at 1.0925. A clear move above the 1.0925 level might send the pair toward the 1.0970 level. Any more gains could set the pace for a test of 1.1000.

On the downside, the pair might find support near the 1.0880 level. The next major support sits near the 1.0820 level, below which the pair could even test the 1.0790 support zone.

If there is a downside break below the 1.0790 support, the pair might accelerate lower in the coming days. In the stated case, it could even test 1.0720.

VIEW FULL ANALYSIS VISIT - FXOpen Blog...

Disclaimer: This Forecast represents FXOpen Companies opinion only, it should not be construed as an offer, invitation or recommendation in respect to FXOpen Companies products and services or as Financial Advice.
 
USDJPY: Are Bulls Trying to Revive the Long-Term Trend?


The USDJPY yesterday reached its highs of several weeks.

This was facilitated by:

→ a statement by the new head of the Bank of Japan, Kazuo Ueda, who made it clear that there is no need to rush to curtail the stimulus policy;

→ Friday's US employment report, which strengthened expectations of the Fed's interest rate hike in May. Unemployment fell to 3.5%, indicating the strength of the labour market. Trading on Tuesday, futures on the dollar index opened with a bullish gap;

→ US commercial bank deposits rose towards the end of March for the first time in about a month, a sign that the banking crisis is easing and the dollar is regaining confidence.

VIEW FULL ANALYSIS VISIT - FXOpen Blog...

Disclaimer: This Forecast represents FXOpen Companies opinion only, it should not be construed as an offer, invitation or recommendation in respect to FXOpen Companies products and services or as Financial Advice.
 
Tech stocks are back in vogue as a sudden rally grabs the attention


For almost two years, there has been tremendous volatility within stocks of technology companies – mostly those with headquarters in Silicon Valley – which are listed on the NASDAQ exchange in New York and included in the S&P 500 index, which tracks the performance of America’s best performing 500 publicly listed companies.

Since 2021, technology stocks have been suffering, and during the course of last year, a consistent downturn in value was recorded, much to the surprise of many, who considered internet-based e-commerce giants and online firms to have been relatively resilient to the effects of the lockdowns which took place across many Western countries during 2020 and 2021 as the world went online.

Perhaps it would have been more likely that stocks in traditional companies which produce physical products or require quantities of raw materials delivered to factories in order to manufacture which was greatly restricted during those times, and workforces that were not allowed into workplaces in order to produce and deliver items to paying customers or outlets would have suffered more.

Yes, Amazon and Google rocketed in value during the early to the middle part of 2020 while airline and hospitality firms listed on more traditional European exchanges such as London Stock Exchange fell, but that was short-lived.

The tech stock downturn that took place last year was surprising and long-lasting.

Now, however, things are back on track, and there appears to have been something of a rally.

Over the past 30 days, the S&P 500 index has risen from 3,861 to 4,090, with NASDAQ-listed tech stocks contributing to that in droves.

VIEW FULL ANALYSIS VISIT - FXOpen Blog...

Disclaimer: This Forecast represents FXOpen Companies opinion only, it should not be construed as an offer, invitation or recommendation in respect to FXOpen Companies products and services or as Financial Advice.
 
BTCUSD Technical Analysis – 11th APR 2023


Bitcoin continues its bullish momentum from last week, and after touching a low of $27,717 on April 6, we can see a bull run, which managed to push the prices of BTCUSD above the $30,000 handle today in the early European trading session.

The resistance of the channel is broken in the daily timeframe, indicating the strength of the bulls.

We can clearly see a hammer pattern above the $27,717 handle.

Bitcoin continues to move in a range-bound motion between the $29,800 and $30,200 levels, which is indicative of a consolidation phase in the markets.

Both the STOCH and Williams Percent Range indicate overbought levels, which means that in the immediate short term, a decline in the price is expected.

The relative strength index is at 74.02, indicating a strong demand for Bitcoin and the continuation of the buying pressure in the markets.

Bitcoin is now moving above its 100-hour simple moving average and above its 200-hour exponential moving average.

Most of the major technical indicators are giving a bullish signal, which means that in the immediate short term, we are expecting targets of $31,000 and $32,500.

The average true range indicates low market volatility with strong bullish momentum.


  • Bitcoin bullish continuation is seen above $27,717.
  • The RSI remains above 50, indicating a bullish market.
  • The price is now trading above its pivot level of $30,088.
  • The short-term range is strongly bullish.
  • Some major technical indicators signal that the price may move to $30,500 and $31,000 soon.

VIEW FULL ANALYSIS VISIT - FXOpen Blog...

Disclaimer: This Forecast represents FXOpen Companies opinion only, it should not be construed as an offer, invitation or recommendation in respect to FXOpen Companies products and services or as Financial Advice.
 
XRPUSD Technical Analysis – 11th APR 2023


Last week, the market sentiment turned bullish after Ripple touched a low of $0.4915 on April 6 and started to correct. The market opened bullish this week.

On the hourly chart:

The relative strength index is at 60.40, which signifies a strong demand for Ripple at the current market prices and the continuation of the bullish phase in the market.
Moving averages signal an upward price movement at the current market level of 0.5203.
Both the STOCH and CCI are in the neutral zones, which means the price is now resting in the consolidation zone.
Ripple is now trading just below its pivot level of 0.5209 and is now facing its classic resistance at 0.5221 and Fibonacci resistance at 0.5241, after which it will be able to move towards 0.6000.


Some of the major technical indicators are bullish.

  • Ripple bullish reversal is seen above 0.4915.
  • The price is below its pivot level.
  • Average true range indicates HIGH volatility.

We have also detected a bullish price crossover with 20 and 50-period moving averages in the weekly timeframe.

VIEW FULL ANALYSIS VISIT - FXOpen Blog...

Disclaimer: This Forecast represents FXOpen Companies opinion only, it should not be construed as an offer, invitation or recommendation in respect to FXOpen Companies products and services or as Financial Advice.
 
GBP/USD Starts Fresh Increase While EUR/GBP Eyes Upside Break


GBP/USD started a fresh increase above the 1.2400 resistance zone. EUR/GBP is struggling and facing resistance near 0.8790.

Important Takeaways for GBP/USD and EUR/GBP

  • The British Pound started a fresh increase above the 1.2400 barrier against the US Dollar.
  • There was a break above a key bearish trendline with resistance near 1.2410 on the hourly chart of GBP/USD.
  • EUR/GBP is struggling to break the 0.8790 resistance zone.
  • There is a major bullish trendline forming with support near 0.8770 on the EUR/GBP hourly chart.

GBP/USD Technical Analysis


This past week, the British Pound saw a downside correction below the 1.2400 support against the US Dollar. The GBP/USD pair tested the 1.2345 zone before the bulls took a stand.

On the hourly chart at FXOpen, a low was formed near 1.2344, and the pair started a fresh increase. There was a clear move above the 1.2400 resistance zone. More importantly, there was a break above a key bearish trendline with resistance near 1.2410.

The pair traded at 1.2456 and settled above the 50-hour simple moving average. There was a minor downside correction below the 23.6% Fib retracement level of the upward move from the 1.2027 swing low to the 1.2205 high.

However, the pair remained well-bid above the 50% Fib retracement level at 1.2400.

If there is a downside break below the 1.2400 support, there is a risk of a sharp decline. In the stated case, GBP/USD may revisit the 1.2355 support. Any more losses could lead the pair toward 1.2300.

On the upside, resistance is near the 1.2355 level, above which the pair might resume its increase (considering the RSI is above 50). The next major resistance is near the 1.2520 level. A clear move above 1.2520 could trigger a rally toward 1.2600.

VIEW FULL ANALYSIS VISIT - FXOpen Blog...

Disclaimer: This Forecast represents FXOpen Companies opinion only, it should not be construed as an offer, invitation or recommendation in respect to FXOpen Companies products and services or as Financial Advice.
 
British Pound remarkably remains the best performing G10 currency in 2023


The end of last year was a very depressing time for those whose everyday currency is the British Pound.

During the last few months of 2022, the world’s most valuable currency slid and slid in value, causing analysts and investors alike to begin to turn their back on the Pound as the economy in Britain continued to suffer from double-figure inflation and other holdbacks such as the effect of Brexit and the legacy of the lockdowns which took place in 2020 and 2021, whereas the American economy continued to recover from its high inflation, with the US Dollar performing well throughout last year and inflation down to just over 6% by December.

Nowadays, things are somewhat different.

Whilst the United States economy continues to remain steady, and inflation is now under control to the extent that the Federal Reserve has begun to discuss the possibility of not making any further increases to interest rates for the foreseeable future after a long period of rate hikes, the British economy remains dogged by Brexit-related trade issues, double-figure inflation and a now two-year-long cost of living crisis.

Despite these having been among the same factors which caused the Pound to depreciate so much over a long period last year, there is some interesting and perhaps surprising data surrounding the British Pound this week, in that it is the best performing G10 currency of 2023.

It’s almost as if absolutely nothing has changed with regard to the challenges faced by the British public and the national economy, yet the sovereign currency has experienced a turnaround in its directionб representing a total change in fortune.

Whilst more than a degree of caution is being exercised by analysts within the financial markets industry with regard to the Pound, it has risen by a healthy 3% against the US Dollar since the beginning of 2023.

VIEW FULL ANALYSIS VISIT - FXOpen Blog...

Disclaimer: This Forecast represents FXOpen Companies opinion only, it should not be construed as an offer, invitation or recommendation in respect to FXOpen Companies products and services or as Financial Advice.
 
On the Nature Of Breakdown of the Psychological $30K Level


On Tuesday, the price of Bitcoin exceeded $30,000 per coin for the first time since June 2022. The news has become a trend in the media and social networks, community members express opinions that in the future the price of BTC will reach $50,000 and 100,000. How optimistic is the $30,000 breakout?


Judging by its nature (1), buyers are unsure as the length of the candles decreases while the price rises above the psychological level – quite unlike the more aggressive nature of the bullish breakout (2) of the $25k level.

In this regard, the role of resistance levels increases:

3→ is built on the height of the range $26,800-29,000;

4→ is built as the border of the ascending channel.

By the ability to stay on the achieved heights against the backdrop of today's session full of important news, it will be possible to judge the true strength of the bulls.

VIEW FULL ANALYSIS VISIT - FXOpen Blog...

Disclaimer: This Forecast represents FXOpen Companies opinion only, it should not be construed as an offer, invitation or recommendation in respect to FXOpen Companies products and services or as Financial Advice.
 
EURHUF: Central European currencies gaining interest


For those who have travelled to some of the former Eastern Bloc nations within Central and Eastern Europe, many will have noticed a key difference between these fully functioning free market economies and their neighbours within the European Union: Abstinence from adopting the Euro.

Whilst nations such as Poland, Hungary, Czech Republic and Bulgaria have been members of the European Union since the 2000s, none of them have adopted a single currency and have instead maintained their own national sovereign currencies.

In recent years, nations such as Hungary have been regarded as home to economies which are relatively small and in which the national currency is of low value compared to majors such as the Euro, which dominates in business across the continent and when transacting with other continental trading partners such as North America or Japan.

For sure, Hungarian export and import data within the European Parliament will be worked out in Euro, not in the local Forint, and the American and Japanese partners of European trade suppliers look at everything in Dollars and Euros, not Dollars, Euros and Forint.

However, the Forint has been making something of a headway recently.

Whilst the Euro and US Dollar have been relatively steady, and in the case of the Dollar, there has been a strong performance for a long time despite economic challenges and geopolitical woes across the Western world, the Hungarian Forint has been increasing in value quite dramatically.

Ever since October last year, the Forint has been gaining ground on the Euro. In October 2022, the Forint was valued at around 432 to the Euro, whereas today, it is trading at 375 to the Euro.

That is a remarkable movement, and one which is very rarely seen among majors unless there is a massive global disaster, which is even rarer, thankfully.

Looking at the Forint’s performance against the Euro over the past 5 days denotes another interesting pattern which is punctuated by volatility. Such levels of volatility are the lifeblood of the currency markets and have been lacking among majors for a long time.

VIEW FULL ANALYSIS VISIT - FXOpen Blog...

Disclaimer: This Forecast represents FXOpen Companies opinion only, it should not be construed as an offer, invitation or recommendation in respect to FXOpen Companies products and services or as Financial Advice.
 
USDCAD Is Approaching an Important Support Level


A short digest of the fresh and saturated news background:

→ Inflation in the US coincided with analysts' expectations. Core CPI was 5.6% in annual terms. The main problem for suppressing inflation is the rise in prices for energy resources (oil has updated the maximum of the year). According to Bloomberg, the union of Russia and Saudi Arabia in the oil market can create problems in this regard.

→ Minutes of the Fed meeting showed that officials expect a mild recession.

→ The ECB believes that inflation has become more extensive in Europe, but the lion's share of increases is already behind.

→ The Bank of Canada left the rate unchanged at 4.5%, expecting a fall in inflation, but is ready for further increases if necessary.

Reacting to the above and other important news, the US dollar index fell to the lows of the year on the foreign exchange market. Accordingly, the euro, pound and Canadian dollar strengthened. The latter forms a pattern that attracts attention.

On the USDCAD chart, we can observe a narrowing triangle (1-2), indicating the balance of supply and demand. The breakdown of the (3) triangle in March turned out to be false. By its behaviour, the market suggests that the true exit from the triangle will take place in a bearish direction. And this could be the beginning of a long-term downtrend.

VIEW FULL ANALYSIS VISIT - FXOpen Blog...

Disclaimer: This Forecast represents FXOpen Companies opinion only, it should not be construed as an offer, invitation or recommendation in respect to FXOpen Companies products and services or as Financial Advice.
 
ETHUSD Technical Analysis on April 13, 2023

The Morning Star Pattern Is Above $1,824


Bears couldn’t keep control of the market, and ETH/USD started to correct upwards after touching a low of $1,763 on 9 April.

ETHUSD is now moving under a strong bullish momentum after crossing the $2,000 resistance and may touch $2,100 and $2,200 levels.

The morning star pattern is above the $1,824 handle on the H1 timeframe. It’s a bullish pattern, which signifies the end of a bearish phase.

The relative strength index is at 78.57, indicating a strong demand for Ether and a continuation of the buying pressure in the markets.

The STOCHRSI and Williams’s percent range give an overbought signal, meaning that the price is expected to decline in the short-term range.

Most of the technical indicators are bullish. Most moving averages are bullish.

ETH is now trading above the 100-hour simple and 200-hour exponential moving averages.

  • Ether bullish reversal is seen above the $1,824 mark.
  • The short-term range is expected to be strongly bullish.
  • The average true range indicates low market volatility.


VIEW FULL ANALYSIS VISIT - FXOpen Blog...

Disclaimer: This Forecast represents FXOpen Companies opinion only, it should not be construed as an offer, invitation or recommendation in respect to FXOpen Companies products and services or as Financial Advice.
 
LTCUSD Technical Analysis on April 13, 2023


Tweezer Bottom Pattern Is Above $89.15

Bears couldn't pull the market further down last week, and after touching a low of $89.15 on 9 April, LTC started to correct upwards against the US Dollar, touching a high of $96.85 on 11 April.

There is a tweezer bottom pattern above the $89.15 handle on the H1 timeframe. It signifies the end of a bearish phase and the start of a bullish phase in the market.

The price of Litecoin is near the channel's support, indicating upcoming bullish movement. Also, Litecoin is trading above its 100-hour simple moving average and 200-hour exponential moving average, and it's above the pivot level of $93.76.

The relative strength index is at 67.54, reflecting a very strong demand for Litecoin and the continuation of the buying pressure in the markets.

Litecoin remains above all moving averages, so the market is still bullish at the current market level of $94.23.

Both Williams’s percent range and STOCHRSI are signalling overbought market conditions, which means that the price is expected to decline in the short-term range.

The short-term outlook for Litecoin has turned as strongly bullish.

  • Technical indicators are bullish.
  • Litecoin bullish reversal is seen above the $89.15 level.
  • The average true range indicates low market volatility.


VIEW FULL ANALYSIS VISIT - FXOpen Blog...

Disclaimer: This Forecast represents FXOpen Companies opinion only, it should not be construed as an offer, invitation or recommendation in respect to FXOpen Companies products and services or as Financial Advice.
 
ETHUSD Rose by 10% in a Day on the Background of Shanghai Upgrade


Shanghai, an important upgrade to the Ethereum blockchain, has been a success. Against the backdrop of the news, the ETHUSD rate rose by 10% per day, breaking the psychological level of $2,000. As of Friday morning, ETH is trading above $2,100, something that has not happened since May 2022. Since the beginning of the year, ETHUSD has risen in price by about 77% (for comparison, Bitcoin, by about 86%).


In the long run, the Shanghai (also known as Shapella) upgrade has the advantage of providing more freedom to invest. But in the short term, a collapse in the value of ETH could occur, as investors got the opportunity to withdraw funds from staking. According to on-chain metrics, after the update, more than 1 million ETH tokens were requested for withdrawal. “[This] is much lower than what was previously expected,” Matt Maximo, an analyst with Grayscale, told CNBC.

The growth of the ETHUSD rate was also facilitated by the lower US dollar index — it fell to the lows of the current year after the release of March producer price index on Thursday, which showed signs of weakening inflation.

On the daily chart of ETHUSD, there was a bullish breakout (1) of the upper boundary of the rising channel that was active in 2023 – which suggests that the market is overbought, and a technical pullback with a breakout test of the $2k psychological level will be a likely scenario.

VIEW FULL ANALYSIS VISIT - FXOpen Blog...

Disclaimer: This Forecast represents FXOpen Companies opinion only, it should not be construed as an offer, invitation or recommendation in respect to FXOpen Companies products and services or as Financial Advice.
 
Gold Price Inches Higher While WTI Crude Oil Aims Fresh Increase


Gold price is rising and trading above the $2,030 resistance. WTI is consolidating and might aim for a fresh increase above $83.25.

Important Takeaways for Gold and Oil

  • Gold price started a fresh increase above the $2,020 resistance against the US Dollar.
  • A key bullish trend line is forming with support near $2,030 on the hourly chart of gold at FXOpen.
  • Crude oil price also gained pace and was able to climb above the $82.00 resistance.
  • There is a key contracting triangle forming with support near $82.00 on the hourly chart of XTI/USD at FXOpen.

Gold Price Technical Analysis


On the hourly chart of gold at FXOpen, the price formed a base above the $1,990 support zone against the US Dollar. The price started a decent increase and was able to clear the $2,000 resistance zone.

The upward move gained pace above the $2,020 and $2,030 resistance levels. Finally, the bears appeared near $2,050. A high is formed at $2,048, and the price is now consolidating gains.

Initial support on the downside is near the 23.6% Fib retracement level of the recent increase from the $2,001 swing low to the $2,048 high. The first major support is forming near a key bullish trend line at $2,030.

If there is a downside break below the trend line, the price might slide toward the 50-hour simple moving average at $2,025. The next major support is near the 61.8% Fib retracement level of the recent increase from the $2,001 swing low to the $2,048 high at $2,020.

On the upside, the bulls are facing resistance near $2,048. An upside break above the $2,048 resistance could send the price toward $2,060. Any more gains may perhaps set the pace for an increase toward the $2,080 level.

VIEW FULL ANALYSIS VISIT - FXOpen Blog...

Disclaimer: This Forecast represents FXOpen Companies opinion only, it should not be construed as an offer, invitation or recommendation in respect to FXOpen Companies products and services or as Financial Advice.
 
Watch FXOpen's April 10-14 Weekly Market Wrap Video

In this video, FXOpen UK COO Gary Thomson sums up the week’s happenings and discusses the most significant news reports.

  • USD: Q1 results
  • USDJPY: Are the bulls trying to revive the long-term trend?
  • Tech stocks are back in vogue as a sudden rally grabs the attention
  • British pound remarkably remains the best performing G10 currency in 2023

Watch our short and informative video, and stay updated with FXOpen.


FXOpen YouTube


Disclaimer: This forecast represents FXOpen Companies opinion only, it should not be construed as an offer, invitation or recommendation in respect to FXOpen Companies products and services or as financial advice.

#fxopen #fxopenyoutube #fxopenuk #weeklyvideo
 
GBP/USD Corrects Gains While USD/CAD Eyes Recovery


GBP/USD faced resistance near 1.2540 and started a downside correction. USD/CAD is recovering and might gain pace if it clears the 1.3370 resistance.

Important Takeaways for GBP/USD and USD/CAD

  • The British Pound started a downside correction below the 1.2500 zone.
  • There was a break below a key bullish trend line with support at 1.2455 on the hourly chart of GBP/USD at FXOpen.
  • USD/CAD declined below the 1.3450 and 1.3400 support levels.
  • A major bearish trend line is forming with resistance near 1.3370 on the hourly chart at FXOpen.

GBP/USD Technical Analysis


On the hourly chart of GBP/USD at FXOpen, the pair was able to climb above the 1.2455 resistance zone. However, the bears were active near the 1.2540 zone.

As a result, the pair started a downside correction below a key bullish trend line with support at 1.2455. Finally, it spiked below the 1.2400 support. A low is formed near 1.2383 and the pair is now consolidating losses.

Immediate resistance is forming near the 23.6% Fib retracement level of the downward move from the 1.2545 swing high to the 1.2383 low at 1.2425.

The next resistance is near 1.2455 (the recent breakdown zone). With an upside break above the 1.2455 zone, the pair could rise toward the 50-hour simple moving average at 1.2485. It coincides with the 61.8% Fib retracement level of the downward move from the 1.2545 swing high to the 1.2383 low.

An upside break above the 1.2485 resistance might send the pair toward 1.2540. Any more gains might open the doors for a test of 1.2600.

On the downside, initial support is near the 1.2400 area. The next major support is near the 1.2345 level. If there is a break below 1.2345, the pair could extend its decline. The next key support is near the 1.2300 level. Any more losses might call for a test of the 1.2250 support.

VIEW FULL ANALYSIS VISIT - FXOpen Blog...

Disclaimer: This Forecast represents FXOpen Companies opinion only, it should not be construed as an offer, invitation or recommendation in respect to FXOpen Companies products and services or as Financial Advice.
 
Why Is the Czech Koruna So Strong Against the US Dollar?


Two decades ago, it was very much in vogue for the newly administered member states of the European Union to adopt the Euro currency.

Introduced in January 1999, just six years after the formation of the European Union, the Euro currency was a hot property among nations wishing to leverage their position in a continental common market, gain ‘major currency’ status overnight, and remove all borders when doing business with neighbouring countries.

Some nations, for reasons of their own choice or by virtue of their position in that they have been unable to join the single European currency due to admission criteria, have maintained their own sovereign currencies despite being fully subscribed members of the European Union.

Interestingly, whereas twenty years ago, those which did not adopt the Euro were considered outliers, now they have their heyday.

The Czech Republic is one such country. Located in Central Europe, with a strong manufacturing industry and diversified economy, it is a well-respected national economy which ranks well among the European benchmarks.

Whilst the Czech Republic has for some time admitted that it is preparing to adopt the Euro, this has not yet taken place, and there is no set date; therefore, it is still in the balance.

The Czech economy’s stoic resilience has certainly displayed itself through the strength of the country’s sovereign currency, as the Koruna is trading today against the US Dollar at 21.29, which is its highest point in over a year, and one of its highest points over the past five years.

The Czech Koruna is not pegged against any other currency, and despite the Czech Republic’s status as a European Union member state, the Koruna does not have any pegging arrangement with the European Central Bank; therefore, economic conditions within the Czech Republic itself determine the value and demand for the national currency.

The US Dollar has been performing surprisingly well over recent months, but as with most majors, there is not much in the way of volatility and as the United States economy has managed to bring itself out of double-digit inflation some time ago and is now at 5%, which is the lowest it has been since 2021 compared to many European nations which are between 10 and 22%.

Therefore, the Czech Koruna’s performance against a very strong major, which has been further stabilised by the US Federal Reserve, considering no further interest rate rises for the foreseeable future, is of great interest.

Currently, according to Statistica, inflation in the Czech Republic is at around 11% but is forecast to drop to 5.82% in 2024. According to CEIC Data, the national debt was 44.1% of GDP by the end of 2022, whereas the United States had a 123.4% national debt to GDP ratio for the same period.

Thus, the Czech Republic’s steady output of good quality export products and a diversified domestic market with a stable backdrop set the Koruna in good stead.

VIEW FULL ANALYSIS VISIT - FXOpen Blog...

Disclaimer: This Forecast represents FXOpen Companies opinion only, it should not be construed as an offer, invitation or recommendation in respect to FXOpen Companies products and services or as Financial Advice.
 

Create an account or login to comment

You must be a member in order to leave a comment

Create account

Create an account on our community. It's easy!

Log in

Already have an account? Log in here.

Similar threads

Users Who Are Viewing This Thread (Total: 1, Members: 0, Guests: 1)

Top
AdBlock Detected

We get it, advertisements are annoying!

Sure, ad-blocking software does a great job at blocking ads, but it also blocks useful features of our website. For the best site experience please disable your AdBlocker.

I've Disabled AdBlock    No Thanks