What's new

Forex News Daily Market Analysis By FXOpen

4.00 star(s) 11 Votes
Gold Formed an Important Bearish Pattern


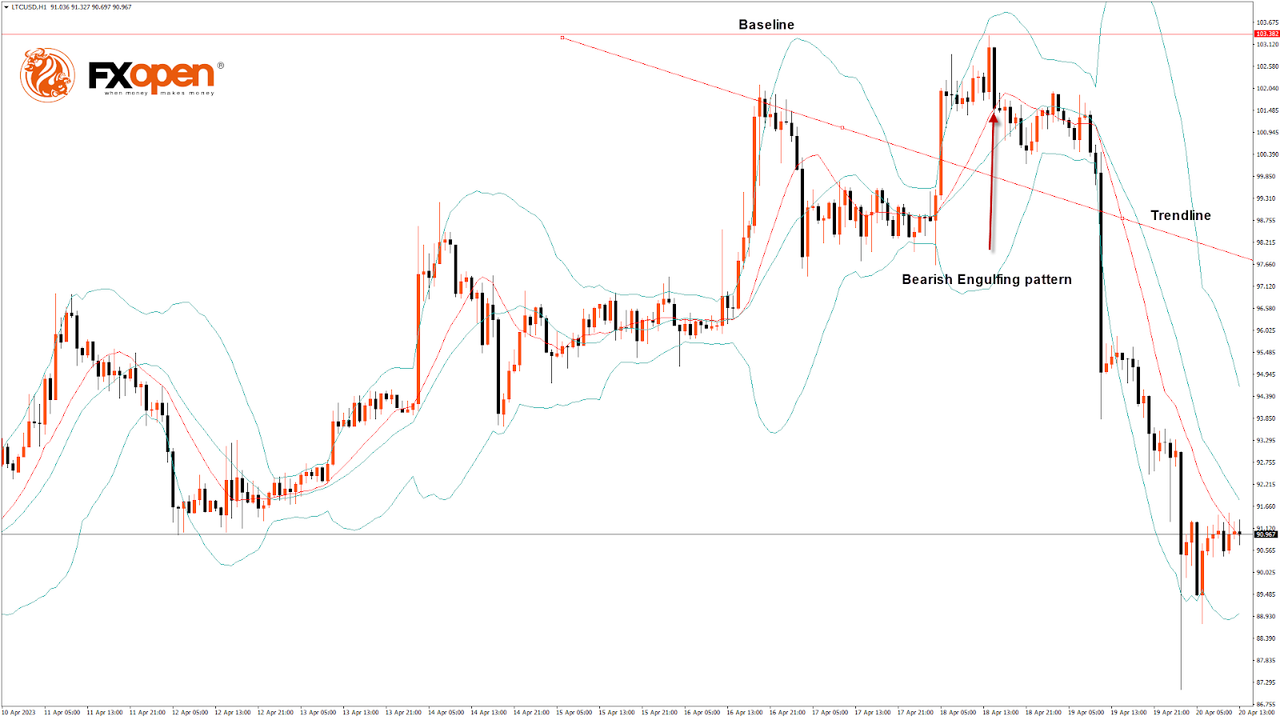
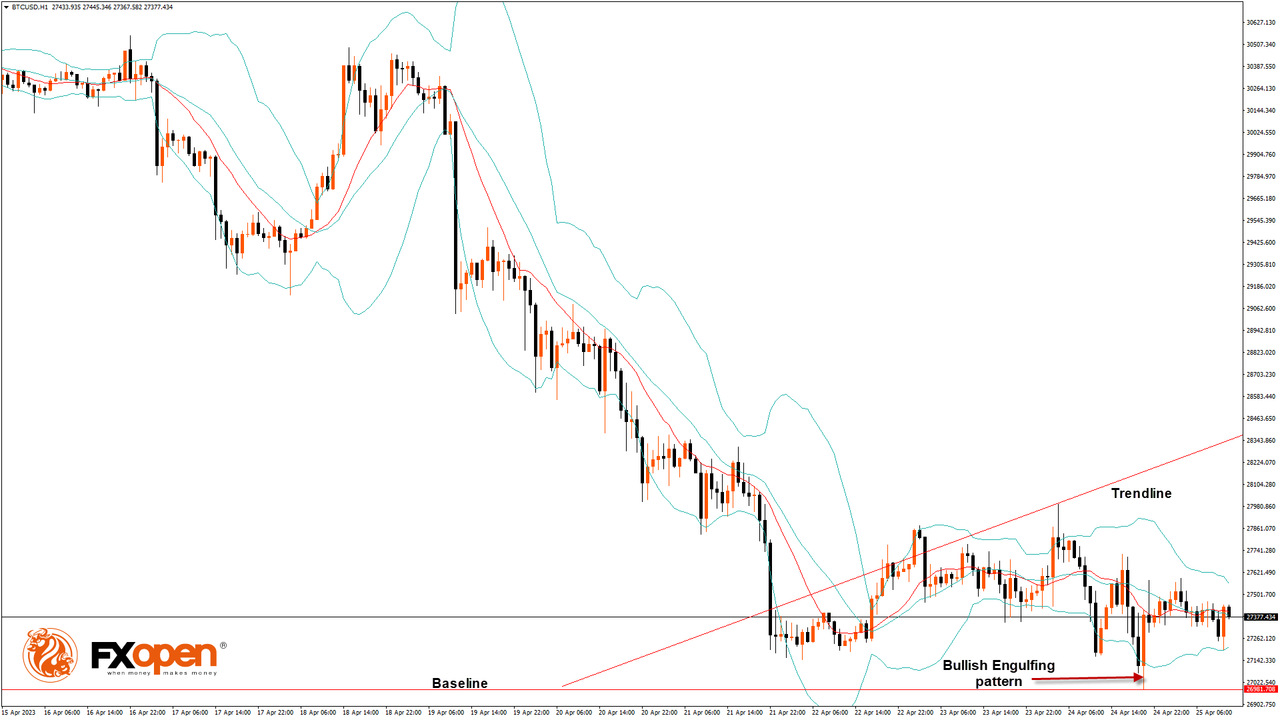
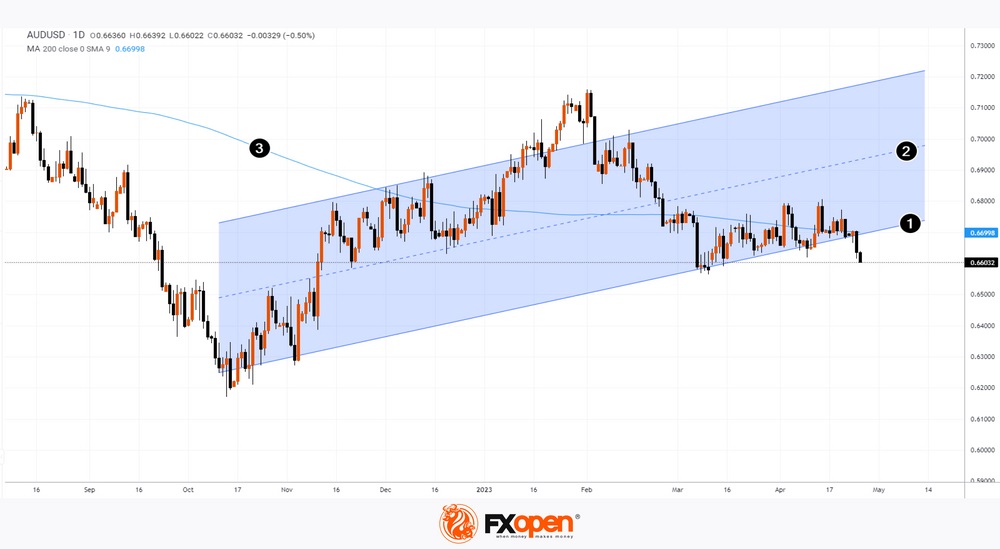
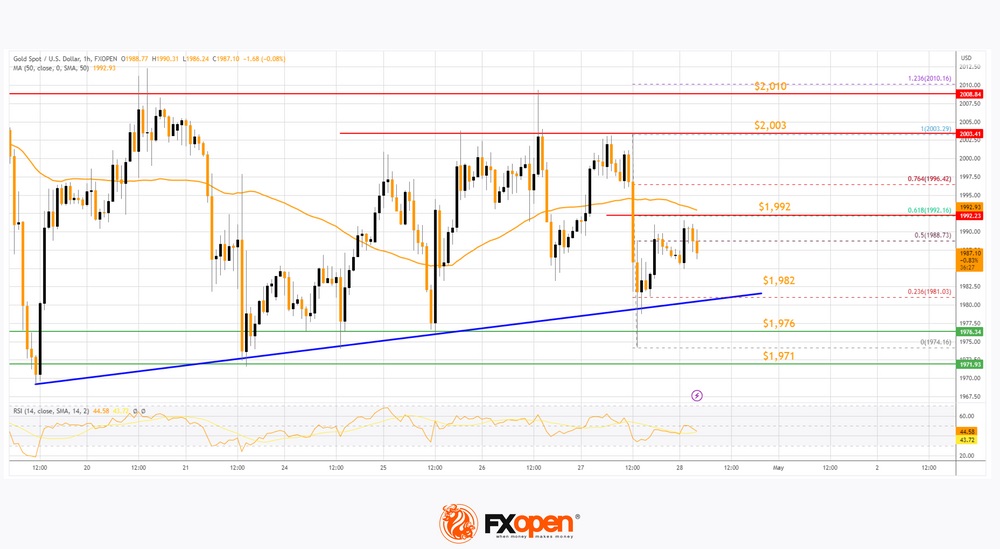
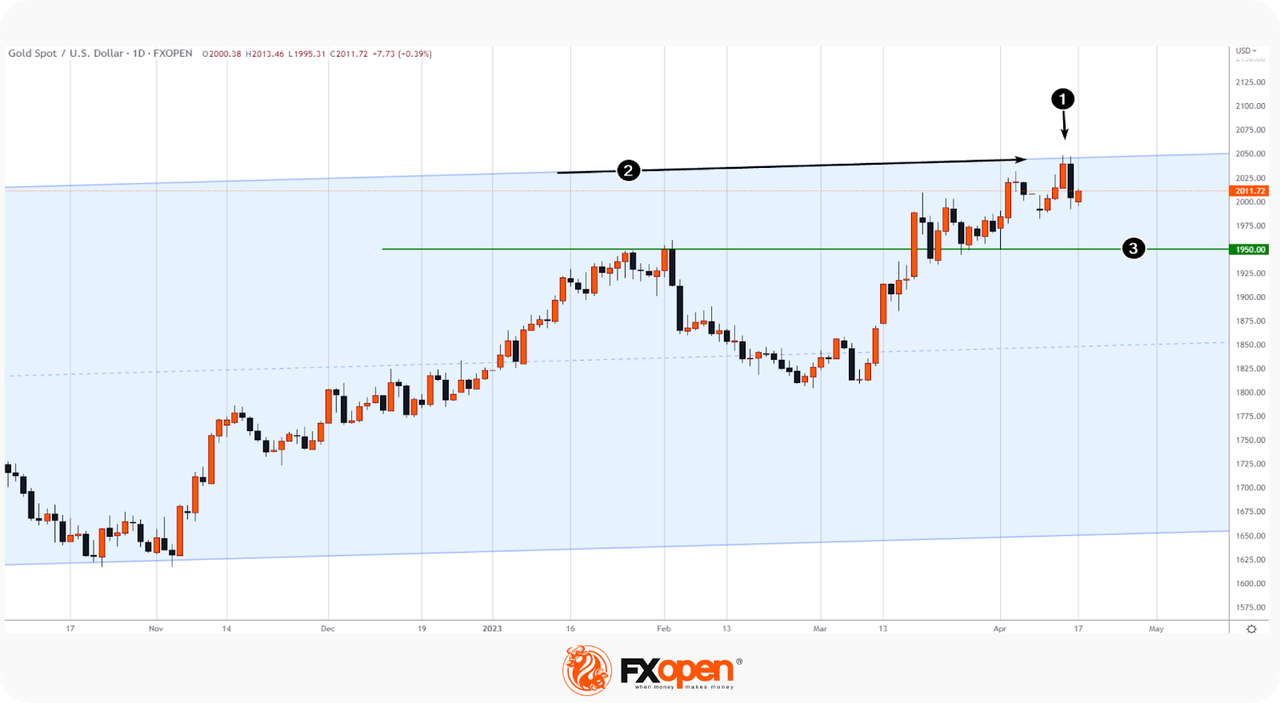
A bearish engulfing pattern (1) has formed on the gold price chart. Two facts make it important:

→ the pattern has formed at the line (2) of the resistance of the trend channel, originating at the end of 2019;

→ the pattern was formed against the background of the discussed news about the US economy, which affected the value of the US dollar.

On Thursday, the price of gold rose (and the US dollar index fell to the lows of the year) after the publication of the Producer Price Index, and on Friday, gold fell sharply in price (and the US dollar index recovered accordingly) after the publication of data on retail sales which turned out to be below expectations (forecast: - 0.2%; actual: -1.0%).

The mixed movements can be interpreted as market participants trying to determine when the Fed can pause the tightening of monetary policy in order to curb high inflation. So far, it is expected that on May 3 the rate will be increased by 0.25%, after which a pause may follow.

From the lows of March, gold has risen in price by almost 13%. Having defined this movement as an impulse, we can assume that the bearish pattern is a sign of an incipient correction. In this case, the price of gold may drop to the $1,927-1,950 zone, formed by the support line (3) and the level of 50% of the impulse.


VIEW FULL ANALYSIS VISIT - FXOpen Blog...

Disclaimer: This Forecast represents FXOpen Companies opinion only, it should not be construed as an offer, invitation or recommendation in respect to FXOpen Companies products and services or as Financial Advice.
 
BTCUSD Technical Analysis on April 18, 2023


BTCUSD Formed a Bullish Spinning Top Pattern above $29,138


Bitcoin continues its bullish momentum from last week, and after touching a low of $29,138 on April 18, it moved towards a consolidation phase, after which we expect an upward movement to the $30,500-$32,000 range.

The market opened bullish this week. There is a bullish spinning top pattern above the $29,138 handle on the H1 timeframe.

Bitcoin continues to move up in a mild bullish momentum and is now aiming to cross the $30,000 psychological barrier.

Both the STOCH and STOCHRSI are in overbought zones, meaning that a decline in the price is expected in the immediate short term.

Bitcoin continues to range near a new 1-year high in the weekly timeframe.

The relative strength index is at 63.29, indicating a strong demand for Bitcoin and the continuation of the buying pressure in the markets.

Bitcoin is now moving above the 100-hour exponential and 200-hour exponential moving averages.

Most of the major technical indicators are bullish; the targets for the immediate short term are $30,500 and $32,000.

The average true range indicates low market volatility with mild bullish momentum.

  • Bitcoin bullish continuation is seen above $29,138.
  • The RSI remains above 50, indicating a bullish market.
  • The price is now trading above its pivot level of $29,926.
  • The short-term range is mildly bullish.
  • Some major technical indicators signal that the price may move to $30,500 and $31,500 soon.

VIEW FULL ANALYSIS VISIT - FXOpen Blog...

Disclaimer: This Forecast represents FXOpen Companies opinion only, it should not be construed as an offer, invitation or recommendation in respect to FXOpen Companies products and services or as Financial Advice.
 
XRPUSD Technical Analysis on April 18, 2023


XRPUSD Formed an Inverted Hammer Pattern Above $0.5041


Last week, the market sentiment turned bullish after Ripple touched a low of $0.5041 on April 13 and started to correct. The market opened bullish this week.

On the hourly chart:

  • The relative strength index is at 61.54, which signifies a strong demand for Ripple at the current market prices and the continuation of the bullish phase in the market.
  • Moving averages signal an upward price movement at the current market level of $0.5200.
  • Both the STOCHRSI and Williams’s percent range are in the overbought zones, which means the price is expected to decline.
  • Ripple is now trading just above its pivot level of $0.5158. It has already crossed its classic resistance at $0.5188, and it is facing Fibonacci resistance at $0.5271, after which it will be able to move towards $0.5500.

Some of the major technical indicators are bullish.

  • Ripple bullish reversal is seen above $0.5041.
  • The price is above its pivot level.
  • The average true range indicates low volatility.

We have also detected a bullish price crossover with 50- and 100-period moving averages in the daily time-frame.

VIEW FULL ANALYSIS VISIT - FXOpen Blog...

Disclaimer: This Forecast represents FXOpen Companies opinion only, it should not be construed as an offer, invitation or recommendation in respect to FXOpen Companies products and services or as Financial Advice.
 
EUR/USD Technical Analysis on April 19, 2023


EUR/USD Struggles Below 1.1000 While USD/JPY Aims Higher

EUR/USD started a downside correction from the 1.1075 resistance. USD/JPY is rising and might rally further above the 134.30 resistance.

Important Takeaways for EUR/USD and USD/JPY

  • The Euro struggled to stay above 1.1000 and corrected lower.
  • There is a key bearish trend line forming with resistance near 1.0990 on the hourly chart of EUR/USD at FXOpen.
  • USD/JPY is showing a lot of bullish signs above the 133.85 support zone.
  • There is a major bearish trend line forming with resistance near 134.30 on the hourly chart at FXOpen.

EUR/USD Technical Analysis


On the hourly chart of EUR/USD at FXOpen, the pair struggled to clear the 1.1075 resistance. The Euro started a fresh decline below 1.1000 against the US Dollar.

There was a drop below the 1.0935 support but the bulls were active near the 1.0910 support. A low is formed near 1.0909 and the pair is now attempting a fresh increase. There was a break above the 1.0935 level and the 50-hour simple moving average.

It is now facing resistance near a key bearish trend line forming with resistance near 1.0990. The trend line is close to the 50% Fib retracement level of the downward move from the 1.1075 swing high to the 1.0910 low.

The next major resistance is near the 76.4% Fib retracement level of the downward move from the 1.1075 swing high to the 1.0910 low at 1.1035. An upside break above 1.1035 could set the pace for another increase. In the stated case, the pair might visit 1.1075. Any more gains might send the pair towards 1.1150.

If not, EUR/USD might decline again below the 1.0935 support. The first major support is near the 1.0910 level, below which the pair could start a major decline. In the stated case, the pair might dive toward the 1.0835 support zone.

VIEW FULL ANALYSIS VISIT - FXOpen Blog...

Disclaimer: This Forecast represents FXOpen Companies opinion only, it should not be construed as an offer, invitation or recommendation in respect to FXOpen Companies products and services or as Financial Advice.
 
ETHUSD Technical Analysis on April 20, 2023


Three Inside Down Pattern Is Below $2,140


Bulls couldn't keep control of the market, and after touching a high of $2,140 on 16 April, the ETH/USD pair declined, touching a low of $1,923 today in the early Asian trading session.

ETHUSD is under bearish pressure after falling below the $2,000 psychological support level as the global investor sentiment appears weak after the Shanghai upgrade.

The three inside down pattern is below the $2,140 handle on the H1 timeframe. It's a bearish pattern, which signifies the end of a bullish phase. Also, there is a bearish harami pattern in the H2 timeframe.

ETH is back under the pivot point, indicating the bearish pressure in the market.

The relative strength index is at 37.74, indicating very weak demand for Ether and a continuation of the selling pressure in the market.

The STOCHRSI is giving an overbought signal, meaning that the price is expected to decline in the short-term range.

We also detected the formation of the bearish harami pattern in both the 30-minute and 1-hour timeframe.

Most of the technical indicators are bearish. Most moving averages are bearish at the current market level of $1,944.

ETH is now trading below the 100-hour simple and 200-hour exponential moving averages.

  • ETH bearish reversal is seen below the $2,140 mark.
  • The short-term range is expected to be strongly bearish.
  • The average true range indicates low market volatility.

VIEW FULL ANALYSIS VISIT - FXOpen Blog...

Disclaimer: This Forecast represents FXOpen Companies opinion only, it should not be construed as an offer, invitation or recommendation in respect to FXOpen Companies products and services or as Financial Advice.
 
LTCUSD Technical Analysis on April 20, 2023


Bearish Engulfing Pattern Is Below $103.38


Bulls couldn't keep control of the market last week, and after touching a high of $103.38 on 18 April, the price declined against the US Dollar, touching a low of $89.06 today in the early Asian trading session.

There is a bearish engulfing pattern below the $103.38 handle on the H1 timeframe. It signifies the end of a bullish phase and the start of a bearish phase in the market.

The MACD has crossed down its moving average in the daily timeframe. Also, Litecoin is trading below its 100-hour simple moving average, 200-hour exponential moving average, and pivot level of $91.04.

The relative strength index is at 30.14, indicating very weak demand for Litecoin and the continuation of the selling pressure in the markets.

Litecoin remains below all of the moving averages, which are giving a bearish signal at current market levels of $90.37.

The STOCHRSI is signaling overbought market conditions, which means that the price is expected to decline in the short term.

The short-term outlook for Litecoin has turned strongly bearish.

  • All technical indicators a bearish
  • Litecoin bearish reversal is seen below the $103.38 level.
  • The RSI is bearish.
  • The average true range indicates low market volatility.

VIEW FULL ANALYSIS VISIT - FXOpen Blog...

Disclaimer: This Forecast represents FXOpen Companies opinion only, it should not be construed as an offer, invitation or recommendation in respect to FXOpen Companies products and services or as Financial Advice.
 
Technical Analysis on April 21, 2023


AUD/USD and NZD/USD At Risk of More Losses

AUD/USD started a fresh decline from the 0.6770 resistance zone. NZD/USD is also moving lower and might decline below the 0.6150 support.

Important Takeaways for AUD/USD and NZD/USD

  • The Aussie Dollar started a fresh decline below the 0.6740 support against the US Dollar.
  • There is a key bullish trend line forming with support at 0.6715 on the hourly chart of AUD/USD at FXOpen.
  • NZD/USD failed to clear the 0.6220 resistance zone and reacted to the downside.
  • There is a major bearish trend line forming with resistance near 0.6180 on the hourly chart of NZD/USD at FXOpen.

AUD/USD Technical Analysis


On the hourly chart of AUD/USD at FXOpen, the pair faced rejection near 0.6770. The Aussie dollar started a fresh decline and traded below the 0.6740 support against the US Dollar.

There was a move below the 61.8% Fib retracement level of the upward move from the 0.6697 swing low to the 0.6771 high. It is now trading below the 50-hour simple moving average. It seems like there is a major support waiting near a key bullish trend line with support at 0.6715.

The trend line coincides with the 76.4% Fib retracement level of the upward move from the 0.6697 swing low to the 0.6771 high. If there is a downside break below the trend line, the pair could decline toward 0.6690.

The next support could be the 0.6660 level, below which the bears could aim for a test of the 0.6600 zone in the coming days.

On the upside, the AUD/USD pair is facing resistance near the 0.6740 level. The next major resistance is near the 0.6770 level. A close above the 0.6770 level could start another steady increase in the near term. The next major resistance could be 0.6850.

VIEW FULL ANALYSIS VISIT - FXOpen Blog...

Disclaimer: This Forecast represents FXOpen Companies opinion only, it should not be construed as an offer, invitation or recommendation in respect to FXOpen Companies products and services or as Financial Advice.
 
Watch FXOpen's April 17 - 21 Weekly Market Wrap Video

In this video, FXOpen UK COO Gary Thomson sums up the week’s happenings and discusses the most significant news reports.

  • Swiss tsunami rips through global markets: FTSE 100 wipeout noticeable
  • Abnormal balance in energy markets
  • FTSE 100 is back on track, but 8,000 points are still out of reach
  • European stocks at historic highs
  • NASDAQ hangs in the doldrums despite optimism around big tech earnings

Watch our short and informative video, and stay updated with FXOpen.


FXOpen YouTube


Disclaimer: This forecast represents FXOpen Companies opinion only, it should not be construed as an offer, invitation or recommendation in respect to FXOpen Companies products and services or as financial advice.

#fxopen #fxopenyoutube #fxopenuk #weeklyvideo
 
GBP/USD Eyes Bullish Breakout While EUR/GBP Consolidates Losses


GBP/USD is eyeing a key upside break above the 1.2470 resistance zone. EUR/GBP is now consolidating losses above the 0.8825 support.

Important Takeaways for GBP/USD and EUR/GBP

  • The British Pound is slowly moving higher from the 1.2365 support against the US Dollar.
  • There is a key bearish trend line forming with resistance near 1.2440 on the hourly chart of GBP/USD at FXOpen.
  • EUR/GBP started a downside correction from the 0.8860 resistance zone.
  • There is a major bullish trend line forming with support near 0.8825 on the hourly chart at FXOpen.

GBP/USD Technical Analysis


On the hourly chart of GBP/USD at FXOpen, the pair found support near the 1.2365 zone. The British Pound formed a base and started a decent increase above the 1.2400 resistance against the US Dollar.

The pair even spiked above 1.2440 and the 50-hour simple moving average. However, upsides remained capped near the 1.2470 zone. The pair is now consolidating near the 50-hour simple moving average and the 23.6% Fib retracement level of the upward move from the 1.2367 swing low to the 1.2451 high.

On the downside, there is a major support forming near the 61.8% Fib retracement level of the upward move from the 1.2367 swing low to the 1.2451 high at 1.2400.

The next major support is near the 1.2365 level. If there is a downside break below the 1.2365 support, there is a risk of a sharp decline. In the stated case, GBP/USD may perhaps revisit the 1.2300 support. Any more losses could lead the pair toward the 1.2250 support.

On the upside, resistance is near a key bearish trend line at 1.2440. The pair might attempt a fresh increase if the RSI stays above 50. The next major resistance is near the 1.2470 level. A clear move above the 1.2470 level could spark a rally toward the 1.2540 level.

VIEW FULL ANALYSIS VISIT - FXOpen Blog...

Disclaimer: This Forecast represents FXOpen Companies opinion only, it should not be construed as an offer, invitation or recommendation in respect to FXOpen Companies products and services or as Financial Advice.
 
BTC/USD: Bullish Engulfing Pattern Above $26,981


Bitcoin continues its bullish momentum from last week, and after touching a low of $26,981 on April 24, we can see a move towards a consolidation phase, after which we are expecting upsides in the range of $28500 and $302000.

We can clearly see a bullish engulfing pattern above the $26,981 handle on the H1 timeframe.

Bitcoin continues to move in a consolidation phase, after which we can see upside moves towards the $28,000 handle.

Both the STOCH and Williams’ percent range indicate overbought levels, which means that in the immediate short term, a decline in the price is expected.

We can also see the formation of bullish Harami pattern in the 1, 2 and 4 hourly timeframes.

The relative strength index is at 58.23, indicating a strong demand for Bitcoin and the continuation of the buying pressure in the markets.

Bitcoin is now moving above its 200-hour exponential moving average and above its 200-hour exponential moving average.

Most of the major technical indicators are giving a bullish signal, which means that in the immediate short term, we are expecting targets of $28,500 and $30,000.

The average true range indicates high market volatility with mild bullish momentum.

  • Bitcoin bullish continuation is seen above $26,981.
  • The RSI remains above 50, indicating a bullish market.
  • The price is now trading below its pivot level of $28,516.
  • The short-term range is mildly bullish.
  • Some major technical indicators signal that the price may move to $28,000 and $29,500 soon.


VIEW FULL ANALYSIS VISIT - FXOpen Blog...

Disclaimer: This Forecast represents FXOpen Companies opinion only, it should not be construed as an offer, invitation or recommendation in respect to FXOpen Companies products and services or as Financial Advice.
 
XRP/USD: Three Inside UP Pattern is Above $0.4404


Last week, the market sentiment remained indecisive after Ripple touched a low of $0.4404 on April 21 and started to correct upwards. The market opened bullish this week.

On the hourly chart:

  • The relative strength index is at 53.79, which signifies a neutral demand for Ripple at the current market prices and the continuation of the bullish phase in the market.
  • Moving averages signal an upward price movement at the current market level of 0.4556.
  • Both the STOCHRSI and Williams’s percent range are in the neutral zones, which means the price is expected to consolidate further.
  • Ripple is now trading just below its pivot level of 0.4560 and is facing its classic resistance at 0.4574 and facing Fibonacci resistance at 0.4587, after which it will be able to move towards 0.4800.
  • The prices are ranging near the horizontal support.
  • CCI indicator is giving a bullish divergence signal.

Some of the major technical indicators are bullish.

  • Ripple bullish reversal is seen above 0.4404.
  • The price is below its pivot level.
  • Average true range indicates High volatility.

We have also detected that MACD crosses UP its moving average in the 15-minutes timeframe.


VIEW FULL ANALYSIS VISIT - FXOpen Blog...

Disclaimer: This Forecast represents FXOpen Companies opinion only, it should not be construed as an offer, invitation or recommendation in respect to FXOpen Companies products and services or as Financial Advice.
 
EUR/USD Corrects Gains While USD/CHF Signals Upside Break


EUR/USD started a downside correction from the 1.1070 resistance. USD/CHF is rising and might aim for more gains above the 0.8930 resistance.

Important Takeaways for EUR/USD and USD/CHF

  • The Euro started a fresh decline from the 1.1070 resistance against the US Dollar.
  • There is a key bullish trend line forming with support near 1.0970 on the hourly chart of EUR/USD at FXOpen.
  • USD/CHF started a fresh increase above the 0.8900 resistance zone.
  • There was a break above a major bearish trend line with resistance near 0.8895 on the hourly chart at FXOpen.

EUR/USD Technical Analysis


On the hourly chart of EUR/USD at FXOpen, the pair faced rejection near the 1.1070 level. The Euro started a downside correction from the 1.1072 resistance against the US Dollar.

There was a move below the 50-hour simple moving average at 1.1015. The pair dipped below the 1.1000 support before the bulls appeared near 1.0970 when the RSI reached oversold conditions. There is also a key bullish trend line forming with support near 1.0970.

The pair is now consolidating and facing resistance near the 1.1000 level. The first major resistance is near the 50-hour simple moving average at 1.1015. It coincides with the 50% Fib retracement level of the downward move from the 1.1067 swing high to the 1.0964 low.

An upside break above the 1.1015 level might send the pair toward the 76.4% Fib retracement level of the downward move from the 1.1067 swing high to the 1.0964 low.

The next major resistance is near the 1.1070 level. Any more gains might open the doors for a move toward the 1.1120 level. If there is no move above 1.1015, the pair might start a fresh decline. On the downside, immediate support is near the trend line at 1.0970.

The next major support is near the 1.0945 level. A downside break below the 1.0945 support could start a steady decline toward the 1.0910 level.

VIEW FULL ANALYSIS VISIT - FXOpen Blog...

Disclaimer: This Forecast represents FXOpen Companies opinion only, it should not be construed as an offer, invitation or recommendation in respect to FXOpen Companies products and services or as Financial Advice.
 
AUDUSD Analysis: Breakout of Important Support


Yesterday's report showed that inflation in Australia in the first quarter of 2023 fell from a 33-year high. The consumer price index rose only by 1.4% in annual terms, although analysts had expected +1.9%.

Now market participants are focusing on the meeting of the Reserve Bank of Australia on May 2; it is expected that it will resume raising rates and thereby complete the pause made after a series of 10 increases.

Reacting to the news, the Australian dollar broke through the low of April, while the daily AUDUSD chart shows that the market as a whole looks weak, because:

→ important support (1), which has been in effect since autumn 2022, has been breached;

→ rebounds from this line were weak, the price did not reach the median line (2);

→ MA (200) points down.

The bears may make even more progress today, as at 15:30 (GMT+3) the US GDP and unemployment news will be published, which may strengthen the USD.


VIEW FULL ANALYSIS VISIT - FXOpen Blog...

Disclaimer: This Forecast represents FXOpen Companies opinion only, it should not be construed as an offer, invitation or recommendation in respect to FXOpen Companies products and services or as Financial Advice.
 
ETHUSD Analysis: The Morning Star Pattern above $1,786


Bulls were able to take control of the market, and after touching a low of $1,786 on 26 April, the ETH/USD pair is showing bullish momentum, touching a high of $1,938 today in the early Asian trading session.

ETHUSD is under mild bullish pressure after its decline below the $1,800 handle due to improved investor sentiment and support seen at lower levels.

The morning star pattern is above the $1,786 handle on the H1 timeframe. It's a bullish pattern, which signifies the end of a bearish phase.

The price is above the Ichimoku cloud in the 15-minutes timeframe.

ETH is back above the pivot point, indicating the bullish pressure in the market.

The relative strength index is at 57.13, indicating a strong demand for Ether and a continuation of the buying pressure in the market.

The STOCHRSI is giving neutral, meaning that the price is expected to enter into a consolidation zone in the short-term range.

We also detected the formation of the bullish trend reversal pattern with the 50-period moving average in the 15-minutes timeframe.

Most of the technical indicators are bullish. Most moving averages are bullish at the current market level of $1,885.

ETH is now trading above the 200-hour simple and 200-hour exponential moving averages.

  • ETH bullish reversal is seen above the $1,786 mark.
  • The short-term range is expected to be mildly bullish.
  • The average true range indicates high market volatility.


VIEW FULL ANALYSIS VISIT - FXOpen Blog...

Disclaimer: This Forecast represents FXOpen Companies opinion only, it should not be construed as an offer, invitation or recommendation in respect to FXOpen Companies products and services or as Financial Advice.
 
LTCUSD Analysis: Inverted Hammer Pattern Is above $84.29


Bulls were able to take control of the market last week, and after touching a low of $84.29 on 26 April, the price started to correct upwards against the US Dollar.

There is an inverted hammer pattern above the $84.29 handle on the H1 timeframe. It signifies the end of a bearish phase and the start of a bullish phase in the market.

The momentum indicator is back over zero in the H1 timeframe, indicating a bullish trend. There is also an upside gap located in the 15-minutes timeframe, which indicates the bullish nature of the market. We can see the formation of the Doji candle in the D1 timeframe, indicating the neutral tone of the market.

Also, Litecoin is trading below its 100-hour simple moving average, 200-hour exponential moving average, and pivot level of $91.57.

The relative strength index is at 53.164, indicating a neural demand for Litecoin and the shift towards the consolidation zone in the markets.

Litecoin remains above some of the moving averages, which is a bullish signal at the current market level of $88.33.

The CCI is signaling neutral market conditions, which means that the price is expected to move in a narrow range in the short term.

The short-term outlook for Litecoin has turned mildly bullish.

  • Some of the technical indicators are bullish.
  • Litecoin bullish reversal is seen above the $84.39 level.
  • The RSI is neutral.
  • The average true range indicates high market volatility.


VIEW FULL ANALYSIS VISIT - FXOpen Blog...

Disclaimer: This Forecast represents FXOpen Companies opinion only, it should not be construed as an offer, invitation or recommendation in respect to FXOpen Companies products and services or as Financial Advice.
 
Gold Price and Crude Oil Price Face Key Hurdles


Gold price is struggling to gain momentum above the $2,003 resistance. Crude oil price is consolidating losses and struggling to recover above $75.20.

Important Takeaways for Gold and Oil

  • Gold price seems to be trading in a range below the $2,010 resistance against the US Dollar.
  • A key bullish trend line is forming with support near $1,982 on the hourly chart of gold at FXOpen.
  • Crude oil prices declined heavily below the $79.00 and $76.50 support levels.
  • There is a major bearish trend line forming with resistance near $75.20 on the hourly chart of XTI/USD at FXOpen.

Gold Price Technical Analysis


On the hourly chart of Gold at FXOpen, the price formed a base above the $1,976 support zone. The price started a decent increase and was able to clear the $2,003 resistance zone.

However, the bears were active near the $2,010 resistance. There were more than two attempts to clear the $2,010 resistance but the bulls failed. It reacted to the downside and retested the $1,976 support.

The price is now rising and trading near the 50% Fib retracement level of the recent decline from the $2,003 swing high to the $1,974 low. Initial support on the downside is near a key bullish trend line at $1,982.

The first major support is near the $1,976 level. The main support sits near the $1,971 level. If there is a downside break below the $1,971 support, the price might decline heavily.

The next major support is near $1,960, below which the bulls could aim for a test of $1,950. On the upside, the bulls are facing resistance near the 50-hour simple moving average at $1,992. It coincides with the 61.8% Fib retracement level of the recent decline from the $2,003 swing high to the $1,974 low.

An upside break above the $1,992 resistance could send the price toward $2,003. Any more gains may perhaps set the pace for an increase toward the $2,010 level.

VIEW FULL ANALYSIS VISIT - FXOpen Blog...

Disclaimer: This Forecast represents FXOpen Companies opinion only, it should not be construed as an offer, invitation or recommendation in respect to FXOpen Companies products and services or as Financial Advice.
 
EURJPY Climbs to Its Highest in Over 8 Years


On Friday morning, the EURJPY rose above 149 yen per euro on news from Japan. There, unemployment rose to 2.8% (expected 2.5%, last month 2.6%, a year ago 2.6%), it was higher only in the summer of 2021 (2.9%).

Market participants also followed the meeting of the Bank of Japan, which is now managed by Kazuo Ueda. As expected, the Bank of Japan said it would maintain ultra-low interest rates. However, at the same time it became known that the bank will conduct a "broad review of monetary policy."

It is possible that this revision will lay the groundwork for Kazuo Ueda's phasing out of the massive stimulus program pursued by his predecessor.

Perhaps the level of 148 yen per euro (1), which previously served as resistance, will now become a support for the bulls to try to break through the psychological mark of 150 yen per euro. In 2014, this mark turned out to be unattainable for them.


VIEW FULL ANALYSIS VISIT - FXOpen Blog...

Disclaimer: This Forecast represents FXOpen Companies opinion only, it should not be construed as an offer, invitation or recommendation in respect to FXOpen Companies products and services or as Financial Advice.
 
Watch FXOpen's April 24 - 28 Weekly Market Wrap Video

In this video, FXOpen UK COO Gary Thomson sums up the week’s happenings and discusses the most significant news reports.

  • MSFT shares rise by more than 9%
  • AUDUSD: breakout of important support
  • NVIDIA analysis: Stock hits one-month low
  • META shares soar 11% after strong report

Watch our short and informative video, and stay updated with FXOpen.


FXOpen YouTube


Disclaimer: This forecast represents FXOpen Companies opinion only, it should not be construed as an offer, invitation or recommendation in respect to FXOpen Companies products and services or as financial advice.

#fxopen #fxopenyoutube #fxopenuk #weeklyvideo
 
Unexpected Interest Rate Hike In Australia Strengthens AUD


According to Reuters, market participants were waiting for a pause in a series of interest rate hikes, as the data showed a slowdown in inflation. However, the Reserve Bank of Australia on Tuesday raised the rate by 25 basis points.

"Inflation in Australia has passed its peak, but at 7 percent is still too high and it will be some time yet before it is back in the target range," said governor Philip Lowe.

As a result, the Australian dollar jumped by about 1% against major currencies. It's a tumultuous start to the week after May 1, which was a public holiday for the financial industry in many countries. Note that news from the Reserve Bank of New Zealand, as well as from the Fed, is expected tomorrow.


VIEW FULL ANALYSIS VISIT - FXOpen Blog...

Disclaimer: This Forecast represents FXOpen Companies opinion only, it should not be construed as an offer, invitation or recommendation in respect to FXOpen Companies products and services or as Financial Advice.
 
BTCUSD Analysis: Shooting Star Pattern below $29,961


Bitcoin failed to continue its bullish momentum from last week, and after touching a high of $29,961 on April 30, it declined below the $28,000 handle today in the European trading session.

We can clearly see a shooting star pattern below the $29,961 handle on the H1 timeframe.

Bitcoin continues to move in a correction phase after crossing the $29,000 level, which is indicative of weakness in the immediate short term.

Both the STOCH and STOCHRSI are in overbought zones, which means that in the immediate short term, a decline in the price is expected.

We can see a bearish opening of the markets this week. The prices of Bitcoin are ranging near a new 1-month low.

The relative strength index is at 38.41, indicating very weak demand for Bitcoin and the continuation of the selling pressure in the market.

Bitcoin is now moving below 100-hour and 200-hour exponential moving averages.

Most of the major technical indicators are bearish, which means that in the immediate short term, we can expect a fall to $27,500 and $27,000.

The average true range indicates less market volatility with mild bearish momentum.

  • Bitcoin bearish reversal is seen below $29,961.
  • The RSI remains below 50, indicating a bearish market.
  • The price is now trading below its pivot level of $28,078.
  • The short-term range is mildly bearish.
  • Some major technical indicators signal that the price may move to $27,000 and $26,500 soon.


VIEW FULL ANALYSIS VISIT - FXOpen Blog...

Disclaimer: This Forecast represents FXOpen Companies opinion only, it should not be construed as an offer, invitation or recommendation in respect to FXOpen Companies products and services or as Financial Advice.
 

Create an account or login to comment

You must be a member in order to leave a comment

Create account

Create an account on our community. It's easy!

Log in

Already have an account? Log in here.

Similar threads

Users Who Are Viewing This Thread (Total: 1, Members: 0, Guests: 1)

Top
AdBlock Detected

We get it, advertisements are annoying!

Sure, ad-blocking software does a great job at blocking ads, but it also blocks useful features of our website. For the best site experience please disable your AdBlocker.

I've Disabled AdBlock    No Thanks