What's new

Forex News Daily Market Analysis By FXOpen

4.00 star(s) 11 Votes
BTCUSD Analysis: Bears Attack the Psychological Level


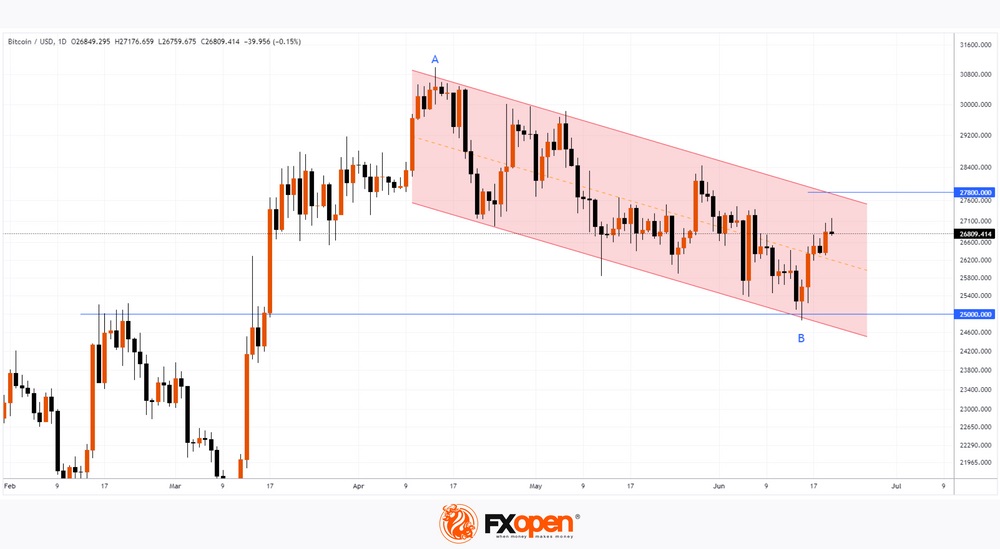
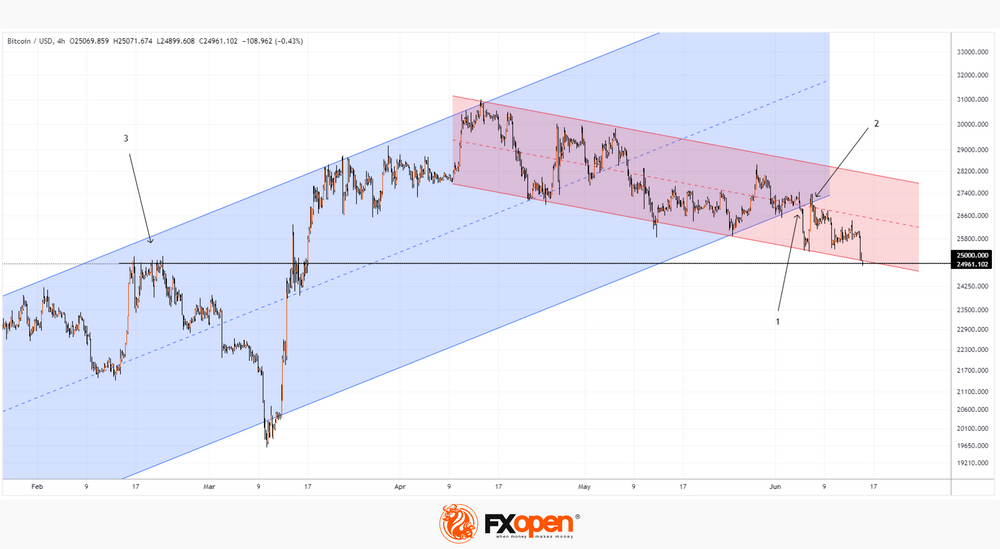
Last night, the price of bitcoin fell below USD 25k for the first time since mid-March. And the bitcoin chart this morning shows sellers breaking through yesterday's low.

There can be two fundamental reasons for the dominance of sellers:

→ yesterday's press conference of the head of the US Federal Reserve (more details in the next post);

→ claims against the Binance and Coinbase exchanges by the US SEC regulator, which declared about 60 crypto assets as securities.


VIEW FULL ANALYSIS VISIT - FXOpen Blog...

Disclaimer: This article represents the opinion of the Companies operating under the FXOpen brand only. It is not to be construed as an offer, solicitation, or recommendation with respect to products and services provided by the Companies operating under the FXOpen brand, nor is it to be considered financial advice.
 
Market Reaction to the Fed's Decision


Yesterday the Fed (as expected) kept the interest rate unchanged (after a series of 10 increases). However, the opinion of market participants that the rate peak has been reached has been called into question. At the Jerome Powell's press conference, it became known that:

→ the majority of FOMC members are against the rate cut;

→ there may be another increase at the end of the year;

→ high inflation situation may last 2 years.

The markets reacted with a rise in the US dollar. Accordingly, the currencies fell in pairs with the US dollar. Gold also fell in price to a minimum in 3 months — like bitcoin, by the way, and this is not the only similarity in the behavior of the price of gold and the main cryptocurrency.


VIEW FULL ANALYSIS VISIT - FXOpen Blog...

Disclaimer: This article represents the opinion of the Companies operating under the FXOpen brand only. It is not to be construed as an offer, solicitation, or recommendation with respect to products and services provided by the Companies operating under the FXOpen brand, nor is it to be considered financial advice.
 
AUD/USD and NZD/USD Regain Strength


AUD/USD is gaining pace and might climb further higher above 0.6900. NZD/USD is also showing positive signs above the 0.6200 resistance zone.

Important Takeaways for AUD USD and NZD USD Analysis Today

  • The Aussie Dollar started a fresh increase above the 0.6780 and 0.6830 levels against the US Dollar.
  • There is a key bullish trend line forming with support near 0.6830 on the hourly chart of AUD/USD at FXOpen.
  • NZD/USD is gaining bullish momentum above the 0.6200 support.
  • There is a major bullish trend line forming with support near 0.6200 on the hourly chart of NZD/USD at FXOpen.

AUD/USD Technical Analysis


On the hourly chart of AUD/USD at FXOpen, the pair started a fresh increase from the 0.6740 support. The Aussie Dollar was able to clear the 0.6780 resistance to start a steady uptrend against the US Dollar.

There was a close above the 0.6830 resistance and the 50-hour simple moving average. Finally, the pair tested the 0.6890 zone. A high is formed near 0.6892 and the pair is now consolidating gains. The AUD USD chart indicates that the pair is now facing resistance near 0.6892.

The first major resistance might be 0.6900. An upside break above the 0.6900 resistance might send the pair further higher. The next major resistance is near the 0.6950 level. Any more gains could open the doors for a move toward the 0.7000 resistance zone.

On the downside, initial support is near the 23.6% Fib retracement level of the upward move from the 0.6765 swing low to the 0.6892 high at 0.6860.

The next support could be a major bullish trend line at 0.6830 and the 50-hour simple moving average. It is close to the 50% Fib retracement level of the upward move from the 0.6765 swing low to the 0.6892 high.

If there is a downside break below the 0.6830 support, the pair could extend its decline toward the 0.6780 level. Any more losses might signal a move toward 0.6740.

VIEW FULL ANALYSIS VISIT - FXOpen Blog...

Disclaimer: This article represents the opinion of the Companies operating under the FXOpen brand only. It is not to be construed as an offer, solicitation, or recommendation with respect to products and services provided by the Companies operating under the FXOpen brand, nor is it to be considered financial advice.
 
EUR/USD Analysis: +1.4% in 2 Days


The current high growth rate, which was last seen in November 2022, was the result of decisions by central banks:

→ on Wednesday, the US Federal Reserve kept the interest rate at 5.25%;
→ and on Thursday, the ECB raised the rate from 3.75% to 4%. Eurozone inflation will remain "too high for too long," Lagarde said. The possibility of a rate hike in July is "very likely".

If the Fed started to apply the tightening policy earlier and came to a pause in a series of rate hikes faster, in turn the ECB is taking similar actions, but with some lag in time.


VIEW FULL ANALYSIS VISIT - FXOpen Blog...

Disclaimer: This article represents the opinion of the Companies operating under the FXOpen brand only. It is not to be construed as an offer, solicitation, or recommendation with respect to products and services provided by the Companies operating under the FXOpen brand, nor is it to be considered financial advice.
 
Watch FXOpen's June 12 - 16 Weekly Market Wrap Video

Weekly Market Wrap With Gary Thomson: USD/CNH, MSTF ANALYSIS, FED'S DECISION.


Get the latest scoop on the week's hottest headlines, all in one convenient video. Join Gary Thomson, the COO of FXOpen UK, as he breaks down the most significant news reports and shares his expert insights.

  • Market Analysis: Wall Street optimistic ahead of inflation news
  • USD/CNH reaches year-to-date high
  • MSFT analysis: Will Microsoft rally now the acquisition is off the table?
  • Market reaction to the Fed's decision.

What became known at Powell’s press conference.

Stay in the know and empower yourself with our short, yet power-packed video. Watch it now and stay updated with FXOpen.

Don't miss out on this invaluable opportunity to sharpen your trading skills and make informed decisions.


FXOpen YouTube


Disclaimer: This article represents the opinion of the Companies operating under the FXOpen brand only. It is not to be construed as an offer, solicitation, or recommendation with respect to products and services provided by the Companies operating under the FXOpen brand, nor is it to be considered financial advice.

#fxopen #fxopenyoutube #fxopenuk #weeklyvideo
 
GBP/USD Rallies above 1.2800 While EUR/GBP Struggles


GBP/USD rallied above the 1.2765 and 1.2800 resistance levels. EUR/GBP declined and now trading below the 0.8565 resistance.

Important Takeaways for GBP/USD and EUR/GBP Analysis Today

  • The British Pound is trading in a bullish zone above 1.2700 against the US Dollar.
  • There is a key bullish trend line forming with support near 1.2765 on the hourly chart of GBP/USD at FXOpen.
  • EUR/GBP started a fresh decline from the 0.8590 resistance zone.
  • There is a major bearish trend line forming with resistance near 0.8540 on the hourly chart at FXOpen.

GBP/USD Technical Analysis


On the hourly chart of GBP/USD at FXOpen, the pair started a major increase from the 1.2500 support zone. The British Pound climbed above the 1.2625 resistance zone against the US Dollar.

The bulls were able to pump the pair above 1.2765 and the 50-hour simple moving average. Finally, the pair climbed above 1.2800 and tested 1.2845. A high is formed near 1.2847 and the pair is now consolidating gains.

It is trading above the 23.6% Fib retracement level of the upward move from the 1.2629 swing low to the 1.2847 high. The GBP/USD chart indicates that the pair is facing resistance near the 1.2845 level.

The next major resistance is near the 1.2880 level. If the RSI moves above 60 and the pair climbs above 1.2880, there could be another rally. In the stated case, the pair could rise toward the 1.2950 level or even 1.3000.

On the downside, there is a major support forming near a trend line at 1.2765 and the 50-hour simple moving average. If there is a downside break below the 1.2765 support, the pair could accelerate lower.

The next major support is near the 61.8% Fib retracement level of the upward move from the 1.2629 swing low to the 1.2847 high or 1.2700, below which the pair could test 1.2625. Any more losses could lead the pair toward the 1.2500 support.

VIEW FULL ANALYSIS VISIT - FXOpen Blog...

Disclaimer: This article represents the opinion of the Companies operating under the FXOpen brand only. It is not to be construed as an offer, solicitation, or recommendation with respect to products and services provided by the Companies operating under the FXOpen brand, nor is it to be considered financial advice.
 
GBP Analysis: What is the Next Move for the Pound? One-year High Begs the Question


The two-decade long period of almost no volatility in the major currency markets which lasted throughout the late 1990s until the late 2010s is long gone.

Just looking back at the last 12 months has been a very interesting insight into exactly that.

Throughout the last quarter of 2022, the British pound declined consistently against the US dollar, and commentary surrounding the ills of domestic millstones such as Brexit and the extra cost of doing business for UK firms, high inflation, a cancelled budget from the shortest prime ministerial office in British history, and a cost-of-living crisis with energy and food bills at the top of the agenda pervaded every channel.

By contrast, the US dollar was doing incredibly well against all major currencies. Despite a national debt to GDP ratio of more than double the percentage of that of the United Kingdom and similar challenges faced by many citizens of the United States to those faced by Britain’s populace, inflation in the United States reduced to approximately 6% and the economy appeared to be getting back on track.

Doom and gloom was abound last year, but that suddenly stopped when the British Pound began to enjoy a resurgence.

Now, here we are in the middle of 2023 and the British pound has turned its fortunes around, standing today at a 1-year high against the US dollar.

VIEW FULL ANALYSIS VISIT - FXOpen Blog...

Disclaimer: This article represents the opinion of the Companies operating under the FXOpen brand only. It is not to be construed as an offer, solicitation, or recommendation with respect to products and services provided by the Companies operating under the FXOpen brand, nor is it to be considered financial advice.
 
USD/JPY at the High of the Year


This morning, the Japanese currency weakened to 142.25 yen per US dollar for the first time since November 2022.

This is a consequence of the difference in the monetary policies of the two countries. Last week, the Fed, although it paused in raising the rate, said that it could be raised before the end of the year. On the other hand, the Bank of Japan on Friday maintained its commitment to ultra-soft monetary policy.

The USD/JPY chart shows that the rate is moving within a long-term ascending channel (shown in blue), and today it is near its median line — it can serve as resistance, which can at least slow down the growth of the rate. Or even promote a pullback within the channel shown in yellow.


VIEW FULL ANALYSIS VISIT - FXOpen Blog...

Disclaimer: This article represents the opinion of the Companies operating under the FXOpen brand only. It is not to be construed as an offer, solicitation, or recommendation with respect to products and services provided by the Companies operating under the FXOpen brand, nor is it to be considered financial advice.
 
BTCUSD Analysis: Positivity Has Returned to the Markets, But for How Long?


The price of bitcoin is rising to the highs of June after a sharp drop that happened due to SEC lawsuits against the Binance and Coinbase exchanges.

Fortunately for crypto investors, the situation did not go according to the worst-case scenario. The court did not freeze Binance.US funds, giving the regulator and exchanges the opportunity to find a compromise. But if it does, what kind of compromise will it find and when? It is not surprising that we will be able to witness the massive relocation of crypto companies from the US:

→ To the UK. This week, the House of Lords of England approved the FSMB cryptocurrency regulation project, which has been under consideration since June 2022. Now the document must be approved in Parliament and sent to the king for signature. This month, by the way, venture capital firm a16z announced plans to open its first office in London later this year, citing a more predictable business environment.

→ To the UAE. VARA, the world's first independent regulator of virtual assets, operates there. As of January 2023, there were over 500 cryptocurrency startups operating in Dubai.

→ To Hong Kong, where the Securities and Futures Commission (SFC) approved a loyal licensing regime for virtual asset trading platforms.

→ To Europe, where the principles of regulation of the cryptocurrency market are laid down in Markets in Crypto Assets (MiCA).

Meanwhile, the bitcoin chart shows that the market has formed a false breakout of the USD 25k psychological level. We wrote about this option on June 15th.


VIEW FULL ANALYSIS VISIT - FXOpen Blog...

Disclaimer: This article represents the opinion of the Companies operating under the FXOpen brand only. It is not to be construed as an offer, solicitation, or recommendation with respect to products and services provided by the Companies operating under the FXOpen brand, nor is it to be considered financial advice.
 
EUR/USD Corrects Gains While USD/CHF Aims Higher


EUR/USD started a decent increase above the 1.0860 resistance. USD/CHF is rising and might aim a move toward the 0.9055 resistance.

Important Takeaways for EUR/USD and USD/CHF Analysis Today

  • The Euro gained pace after it broke the 1.0860 resistance against the US Dollar.
  • There is a major bullish trend line forming with support near 1.0905 on the hourly chart of EUR/USD at FXOpen.
  • USD/CHF is recovering higher above the 0.8945 resistance zone.
  • There is a key rising channel forming with support near 0.8970 on the hourly chart at FXOpen.

EUR/USD Technical Analysis


On the hourly chart of EUR/USD at FXOpen, the pair started a decent increase and was able to settle above the 1.0860 resistance zone. The Euro was able to climb further higher above the 1.0920 level against the US Dollar.

Finally, it tested the 1.0970 zone. A high is formed near 1.0970 and the pair is now correcting gains. There was a move below the 23.6% Fib retracement level of the upward move from the 1.0803 swing low to the 1.0970 high.

The pair is now trading below the 50-hour simple moving average. However, there is a major bullish trend line forming with support near 1.0905.

The next major support is near the 61.8% Fib retracement level of the upward move from the 1.0803 swing low to the 1.0970 high at 1.0860. A downside break below the 1.0860 support could send the pair toward the 1.0785 level.

Immediate resistance on the EUR/USD chart is near the 50-hour simple moving average at 1.0925. The first major resistance is near the 1.0970 level.

An upside break above the 1.0970 level might send the pair toward the 1.1000 resistance. The next major resistance is near the 1.1040 level. Any more gains might open the doors for a move toward the 1.1080 level.

VIEW FULL ANALYSIS VISIT - FXOpen Blog...

Disclaimer: This article represents the opinion of the Companies operating under the FXOpen brand only. It is not to be construed as an offer, solicitation, or recommendation with respect to products and services provided by the Companies operating under the FXOpen brand, nor is it to be considered financial advice.
 
Why the Price of Bitcoin Rose to USD 30k


Yesterday, the BTC price topped USD 30k for the first time since April. There may be several reasons, among them:

→ Powell's speech to lawmakers on Capitol Hill yesterday. The Fed chief said further rate hikes are a pretty good guess as to where the Fed is heading. The dollar index reacted to his hawkish statement with a fall. At the same time, it pushed up the bitcoin rate against the dollar. In addition, Powell paid tribute to cryptocurrencies, saying that they are stable and adding that the Fed views stablecoins as a form of money;

→ after the negative news background related to the Fed lawsuits, positive events followed, indicating the interest of institutional firms in the US in the crypto market. For example, the BlackRock fund (more than USD 8 trillion under management) filed an application last week to launch an ETF based on bitcoin. And a new cryptocurrency exchange, EDX Markets, backed by Citadel Securities, Fidelity and Schwab, has gone live;

→ change in the balance of supply and demand in the market after the price of bitcoin breaks through the psychological level of USD 25k.


VIEW FULL ANALYSIS VISIT - FXOpen Blog...

Disclaimer: This article represents the opinion of the Companies operating under the FXOpen brand only. It is not to be construed as an offer, solicitation, or recommendation with respect to products and services provided by the Companies operating under the FXOpen brand, nor is it to be considered financial advice.
 
Gold Price and Crude Oil Price Turn Red


Gold price is moving lower below the $1,928 support. Crude oil price is also declining and remains at a risk of more losses below $69.00.

Important Takeaways for Gold and Oil Prices Analysis Today

  • Gold price failed to clear the $1,965 resistance and start a fresh decline against the US Dollar.
  • It is now following a key bearish trend line with resistance near $1,915 on the hourly chart of gold at FXOpen.
  • Crude oil prices are also moving lower below $71.20 and $70.20 levels.
  • There was a break below a major bullish trend line with support near $70.85 on the hourly chart of XTI/USD at FXOpen.

Gold Price Technical Analysis


On the hourly chart of Gold at FXOpen, the price struggled to start a fresh increase above the $1,965 resistance. The price started a fresh decline below the $1,938 support.

There was a close below the 50-hour simple moving average and $1,928. It tested the $1,910 support zone. A low is formed at $1,910.40 and the price is now consolidating losses. It is following a key bearish trend line with resistance near $1,915.

The trend line is close to the 23.6% Fib retracement level of the downward move from the $1,955 swing high to the $1,910 low. The next major resistance is near the 50-hour simple moving average at $1,928.

The 61.8% Fib retracement level of the downward move from the $1,955 swing high to the $1,910 low is also near $1,928. An upside break above the $1,928 resistance could send Gold price toward $1,938. Any more gains may perhaps set the pace for an increase toward the $1,955 level.

Initial support on the downside is near the $1,910 level. The first major support is near the $1,900 level. The main support sits near the $1,885 level. If there is a downside break below the $1,885 support, the price might decline further. In the stated case, the price might drop toward the $1,865 support.

VIEW FULL ANALYSIS VISIT - FXOpen Blog...

Disclaimer: This article represents the opinion of the Companies operating under the FXOpen brand only. It is not to be construed as an offer, solicitation, or recommendation with respect to products and services provided by the Companies operating under the FXOpen brand, nor is it to be considered financial advice.
 
Stocks Are Falling on the Background of the Activity of Central Banks


This week could be the worst for stock markets in 3 months after a series of interest rate hikes by central banks, writes Bloomberg.

The UK and Switzerland raised the rate by 0.25%. While the US Fed has left rates unchanged for now, Jerome Powell said another rate hike or two may be needed in 2023. Higher-than-expected inflation in Japan has also fueled speculation that the BOJ may adjust its super-loose monetary policy.


VIEW FULL ANALYSIS VISIT - FXOpen Blog...

Disclaimer: This article represents the opinion of the Companies operating under the FXOpen brand only. It is not to be construed as an offer, solicitation, or recommendation with respect to products and services provided by the Companies operating under the FXOpen brand, nor is it to be considered financial advice.
 
Watch FXOpen's June 19 - 23 Weekly Market Wrap Video

Weekly Market Wrap With Gary Thomson : USD/JPY, FTSE 100 ON DECLINE, INTC SHARES UP, GBP


Get the latest scoop on the week's hottest headlines, all in one convenient video. Join Gary Thomson, the COO of FXOpen UK, as he breaks down the most significant news reports and shares his expert insights.

  • Market Analysis: INTC shares up 16% in just one week. What’s the reason?
  • GBP Analysis: What is the next move for the pound? One-year high begs the question
  • Market Analysis: USD/JPY at the high of the year
  • Market Analysis: FTSE 100 on decline, reacting to news about inflation in the UK

Stay in the know and empower yourself with our short, yet power-packed video. Watch it now and stay updated with FXOpen.

Don't miss out on this invaluable opportunity to sharpen your trading skills and make informed decisions.


FXOpen YouTube


Disclaimer: This article represents the opinion of the Companies operating under the FXOpen brand only. It is not to be construed as an offer, solicitation, or recommendation with respect to products and services provided by the Companies operating under the FXOpen brand, nor is it to be considered financial advice.

#fxopen #fxopenyoutube #fxopenuk #weeklyvideo
 
The Price of Bitcoin Updates the Maximum of the Year, What's Next?


After skyrocketing last week for the 3 reasons we wrote about earlier, the price of bitcoin hit a 2023 high on Friday, surpassing USD 31,400 per bitcoin. This was facilitated by the news that the SEC approved the first exchange-traded fund (ETF) of bitcoin futures with leverage.

In April, the bulls were already above the psychological level of USD 30k per bitcoin, but after that a pullback followed, culminating in the price dropping below the psychological level of USD 25k per bitcoin. The BTC/USD market once again emphasized the emotionality of its participants — this is how you can interpret the tendency of the bitcoin exchange rate to the US dollar to make reversals after the breakdown of psychological levels.

What will happen next? Will the price of bitcoin follow the June breakdown according to the rollback scenario that was realized after the April breakdown? The probability of this is indicated by the bearish SHS patterns (head-and-shoulders), which formed when the price of bitcoin exceeded the level of 30k. You may also have deja vu, as the 2 peaks above 30k in 2023 resemble the 2 peaks (in April and November) above 60k in 2021.


VIEW FULL ANALYSIS VISIT - FXOpen Blog...

Disclaimer: This article represents the opinion of the Companies operating under the FXOpen brand only. It is not to be construed as an offer, solicitation, or recommendation with respect to products and services provided by the Companies operating under the FXOpen brand, nor is it to be considered financial advice.
 
GBP/USD Eyes Fresh Increase, USD/CAD Could Extend Losses


GBP/USD faced resistance near 1.2845 and started a downside correction. USD/CAD is struggling below 1.3210 and might decline further.

Important Takeaways for GBP/USD and USD/CAD

  • The British Pound started a downside correction below the 1.2845 zone.
  • There is a key bearish trend line forming with resistance near 1.2740 on the hourly chart of GBP/USD at FXOpen.
  • USD/CAD declined below the 1.3210 and 1.3185 support levels.
  • A connecting bearish trend line is forming with resistance near 1.3185 on the hourly chart at FXOpen.

GBP/USD Technical Analysis


On the hourly chart of GBP/USD at FXOpen, the pair was able to climb above the 1.2800 resistance zone. However, the bears were active near the 1.2845 zone.

As a result, the pair started a downside correction below the 1.2780 and 1.2740 support levels. The pair even spiked below 1.2700 before the bulls appeared near 1.2690. A low is formed near 1.2684 and the pair is now consolidating losses.

There was a move above the 23.6% Fib retracement level of the downward move from the 1.2841 swing high to the 1.2684 low. Immediate resistance on the GBP/USD chart is forming near the 50-hour simple moving average at 1.2732.

The next resistance is near a key bearish trend line at 1.2740. An upside break above the 1.2740 zone, the pair could rise toward 1.2780. It coincides with the 61.8% Fib retracement level of the downward move from the 1.2841 swing high to the 1.2684 low.

Any more gains might open the doors for a test of 1.2845. On the downside, initial support is near the 1.2720 area. The next major support is near the 1.2690 level. If there is a break below 1.2690, the pair could extend its decline. The next key support is near the 1.2640 level. Any more losses might call for a test of the 1.2580 support.

VIEW FULL ANALYSIS VISIT - FXOpen Blog...

Disclaimer: This article represents the opinion of the Companies operating under the FXOpen brand only. It is not to be construed as an offer, solicitation, or recommendation with respect to products and services provided by the Companies operating under the FXOpen brand, nor is it to be considered financial advice.
 
USDCAD Analysis: Low of the Year


USD/CAD fell below 1.3130 this morning, a level not seen since September 2022. The strength of the Canadian dollar can be justified, among other things, by the fact that the inflation rate in Canada is lower than in the US.

In April, we wrote that a false bullish break (indicated by a circle) of a triangle (shown in green) could indicate that a genuine break would occur in a bearish direction and set a downtrend in the USD/CAD market. And so it happened.

Today's news on inflation in Canada (15:30 GMT+3) may significantly affect the dynamics of the current downtrend, which, if continued, has the prospect of reaching the bottom line (1) of the long-term channel.


VIEW FULL ANALYSIS VISIT - FXOpen Blog...

Disclaimer: This article represents the opinion of the Companies operating under the FXOpen brand only. It is not to be construed as an offer, solicitation, or recommendation with respect to products and services provided by the Companies operating under the FXOpen brand, nor is it to be considered financial advice.
 
EUR/USD Resumes And USD/JPY Could Extend Rally


EUR/USD started a fresh increase above the 1.0890 resistance. USD/JPY is consolidating gains and might rally further above 144.20.

Important Takeaways for EUR/USD and USD/JPY Analysis Today

  • The Euro is rising and trading well above the 1.0925 resistance zone.
  • There is a key bullish trend line forming with support near 1.0940 on the hourly chart of EUR/USD at FXOpen.
  • USD/JPY is trading in a positive zone above the 143.40 and 143.70 levels.
  • There is a major bullish trend line forming with support near 143.70 on the hourly chart at FXOpen.

EUR/USD Technical Analysis


On the hourly chart of EUR/USD at FXOpen, the pair started a fresh increase from the 1.0845 zone. The Euro climbed above the 1.0890 resistance zone against the US Dollar.

The pair even settled above the 1.0925 resistance and the 50-hour simple moving average. There was an upside break above the 50% Fib retracement level of the last key decline from the 1.1012 swing high to the 1.0844 low.

Finally, the bears appeared near the 76.4% Fib retracement level of the last key decline from the 1.1012 swing high to the 1.0844 low at 1.0970.

The pair is now consolidating gains below the 1.0970 resistance. The first major support is near a key bullish trend line at 1.0940.

The next key support is near the 50-hour simple moving average at 1.0925. If there is a downside break below 1.0925, the pair could drop toward the 1.0910 support. The main support on the EUR/USD chart is near 1.0890, below which the pair could start a major decline.

On the upside, the pair is now facing resistance near 1.0970. The next major resistance is near the 1.1010 level. An upside break above 1.1010 could set the pace for another increase. In the stated case, the pair might rise toward 1.1065.

VIEW FULL ANALYSIS VISIT - FXOpen Blog...

Disclaimer: This article represents the opinion of the Companies operating under the FXOpen brand only. It is not to be construed as an offer, solicitation, or recommendation with respect to products and services provided by the Companies operating under the FXOpen brand, nor is it to be considered financial advice.
 
GBP/JPY Analysis: Highs Since December 2015


The GBP/JPY chart shows that this currency pair is in an uptrend (nearly +17% YTD) which can be explained by differences in economies. While the UK is fighting a rate hike against inflation (which has shown double digits), Japan continues to pursue an ultra-soft monetary policy.

Technically, the bulls still have a chance to reach the upper boundary of the channel (shown in blue), where the psychological resistance level of 190 yen per pound passes, but the situation may change:

→ First, the Japanese authorities are concerned. “We closely monitor the movement of the currency. We will respond appropriately if it becomes excessive,” Vice Finance Minister and Chief Currency Strategist Masato Kanda said today. Recall that the Bank of Japan has already taken interventions in the foreign exchange market to support the yen in September and October last year — and this has yielded results.

→ Secondly, the bullish momentum for the pound may weaken. Bank of America analysts' forecast for the pound is one of the most pessimistic among the G10. In their opinion, the fight against inflation in the UK will be the strongest, and the risk of a hard landing has increased.


VIEW FULL ANALYSIS VISIT - FXOpen Blog...

Disclaimer: This article represents the opinion of the Companies operating under the FXOpen brand only. It is not to be construed as an offer, solicitation, or recommendation with respect to products and services provided by the Companies operating under the FXOpen brand, nor is it to be considered financial advice.
 
Gold Drops to 3-Month Low


Yesterday, a forum of heads of central banks was held, organized by the ECB, with speeches by Lagarde, Powell, Ueda, Bailey. In general (with the exception of Japan), according to bankers, they intend to maintain a tight monetary policy, not excluding new increases in interest rates, and plan that inflation will continue to decline.

Against the background of this information, the price of gold in dollars fell — perhaps because forecasts for lower inflation, according to market participants, reduce the value of gold as a "rescue" asset.


VIEW FULL ANALYSIS VISIT - FXOpen Blog...

Disclaimer: This article represents the opinion of the Companies operating under the FXOpen brand only. It is not to be construed as an offer, solicitation, or recommendation with respect to products and services provided by the Companies operating under the FXOpen brand, nor is it to be considered financial advice.
 

Create an account or login to comment

You must be a member in order to leave a comment

Create account

Create an account on our community. It's easy!

Log in

Already have an account? Log in here.

Similar threads

Users Who Are Viewing This Thread (Total: 1, Members: 0, Guests: 1)

Top
AdBlock Detected

We get it, advertisements are annoying!

Sure, ad-blocking software does a great job at blocking ads, but it also blocks useful features of our website. For the best site experience please disable your AdBlocker.

I've Disabled AdBlock    No Thanks