What's new

Forex News Daily Market Analysis By FXOpen

4.00 star(s) 11 Votes
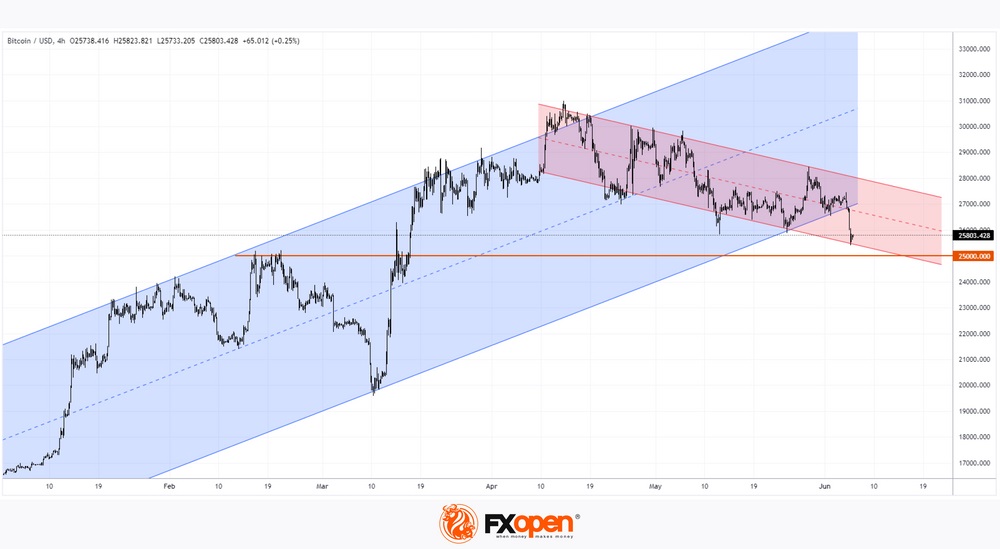
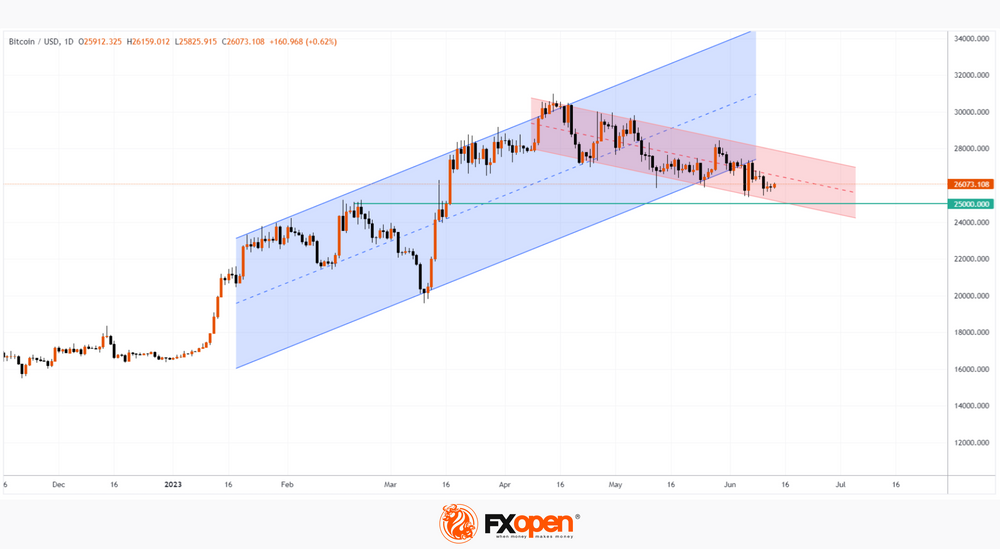
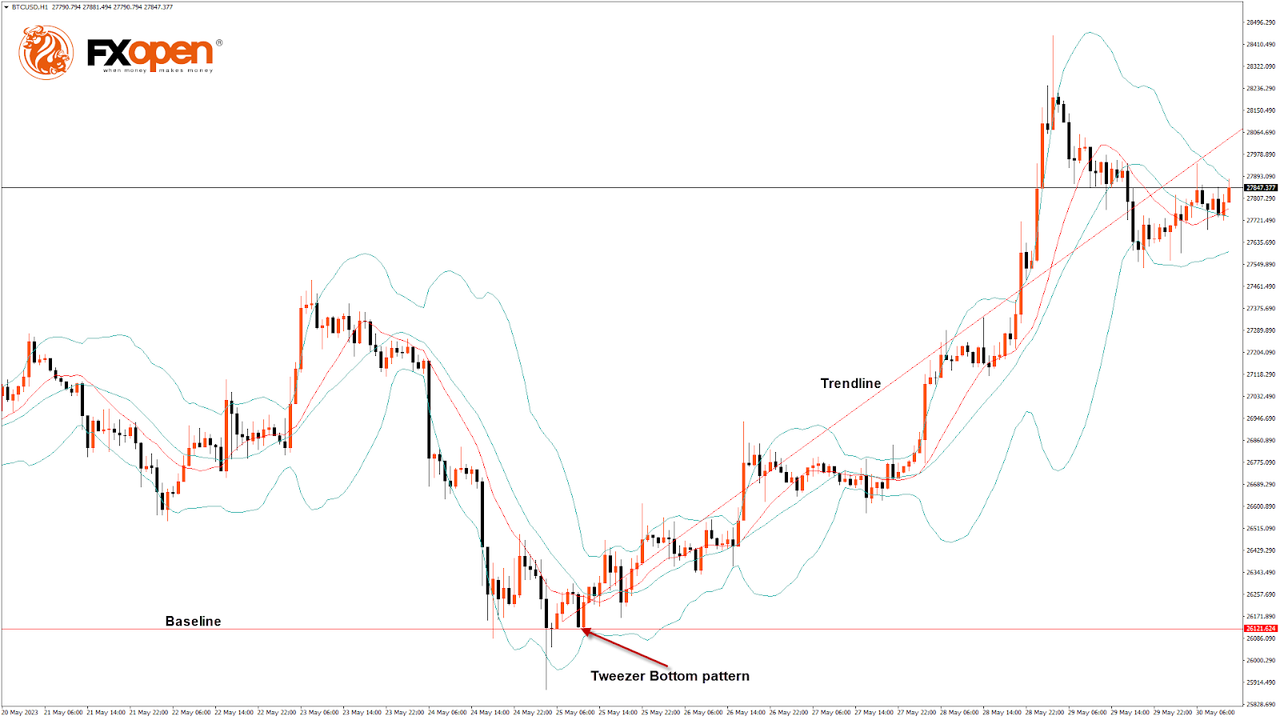
BTCUSD Analysis: Tweezer Bottom Pattern above $26,121


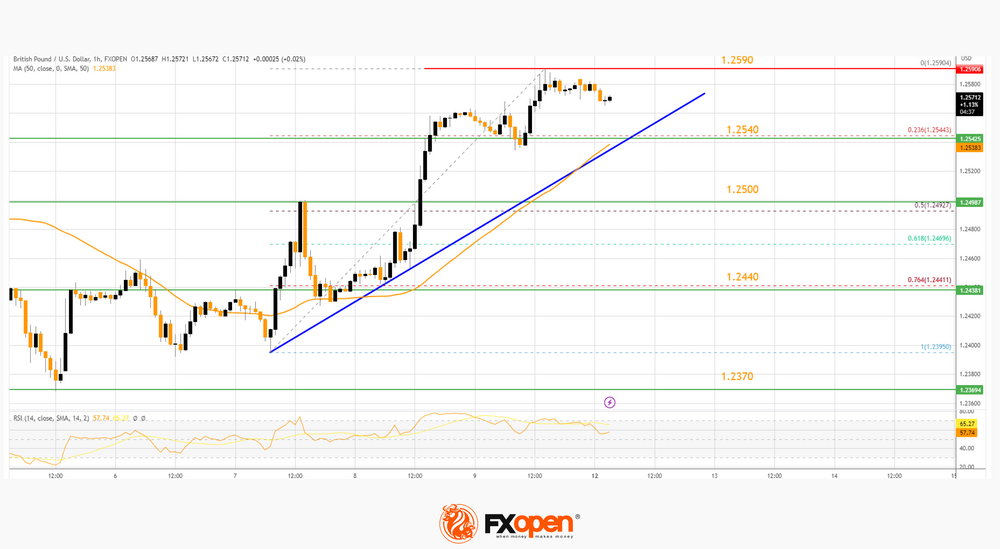
Bitcoin price continues its bullish momentum from last week after touching a low of $26,121 on May 25, with strong upsides located in the range of $28,500 and $29,000.


On the hourly chart:

  • We can clearly see a tweezer bottom pattern above the $26,121 handle, which indicates a bullish trend.
  • Both the STOCH and STOCHRSI indicate overbought market conditions, which means that in the immediate short term, a decline in the price may occur.
  • The MACD crosses UP its moving average.
  • The relative strength index is at 56.95, indicating a strong demand for Bitcoin and the continuation of the buying pressure in the market.
  • Most of the major technical indicators give a bullish signal, which means that in the immediate short term, the expected targets are $28,000 and $28,500.
  • Bitcoin price is now moving above its 100-hour simple moving average and 100-hour exponential moving average.
  • The average true range indicates low market volatility with mild bullish momentum.

VIEW FULL ANALYSIS VISIT - FXOpen Blog...

Disclaimer: This article represents the opinion of the Companies operating under the FXOpen brand only. It is not to be construed as an offer, solicitation, or recommendation with respect to products and services provided by the Companies operating under the FXOpen brand, nor is it to be considered financial advice.
 
EUR/USD Remains At Risk While USD/JPY Trims Gains


EUR/USD started a fresh decline below the 1.0765 support. USD/JPY rallied significantly above 140.00 and recently started a downside correction.

Important Takeaways for EUR/USD and USD/JPY Analysis Today

  • The Euro is declining and showing bearish signs below the 1.0745 resistance zone.
  • There is a key bearish trend line forming with resistance near 1.0715 on the hourly chart of EUR/USD at FXOpen.
  • USD/JPY started a major rally above the 138.88 and 140.00 levels.
  • There is a major bullish trend line forming with support near 139.65 on the hourly chart at FXOpen.

EUR/USD Technical Analysis


On the hourly chart of EUR/USD at FXOpen, the pair started a fresh decline from the 1.0790 resistance. The Euro declined below the 1.0745 support zone against the US Dollar.

It settled below the 50-hour simple moving average and spiked below 1.0690. A low was formed near 1.0672 before there was a minor recovery. The pair climbed above 1.0715 but the bears were active near the 1.0745 resistance.

A high is formed near 1.0746 and the pair is again moving lower. There was a move below the 50% Fib retracement level of the upward move from the 1.0672 low to the 1.0746 high.

The RSI is dipping and EUR/USD is approaching the 76.4% Fib retracement level of the upward move from the 1.0672 low to the 1.0746 high at 1.0690. The first major support is near the 1.0670 level, below which the pair could start a major decline. In the stated case, the pair might dive toward the 1.0620 support zone.

On the EUR/USD chart, the pair is now facing resistance near a key bearish trend line at 1.0715. The next major resistance is near the 1.0745 level. An upside break above 1.0745 could set the pace for another increase. In the stated case, the pair might visit 1.0790.

VIEW FULL ANALYSIS VISIT - FXOpen Blog...

Disclaimer: This article represents the opinion of the Companies operating under the FXOpen brand only. It is not to be construed as an offer, solicitation, or recommendation with respect to products and services provided by the Companies operating under the FXOpen brand, nor is it to be considered financial advice.
 
EURO STOXX 50 Hits 2-month Low


During the first 3 days of this week, the price of EURO STOXX 50 (SX5E) has fallen by more than 3%.

This was facilitated by:
→ lower oil prices on the eve of the OPEC+ meeting scheduled for June 4. The Saudi oil minister urged market speculators to "be careful”;
→ uncertainty about the US debt ceiling. While a deal has been tentatively reached, it has yet to be officially approved by the Senate. There are only a few hours left;
→ reduced shares of European companies producing luxury goods due to falling demand;
→ disappointing data from China (we wrote about it yesterday), with which Europe is actively trading.


VIEW FULL ANALYSIS VISIT - FXOpen Blog...

Disclaimer: This article represents the opinion of the Companies operating under the FXOpen brand only. It is not to be construed as an offer, solicitation, or recommendation with respect to products and services provided by the Companies operating under the FXOpen brand, nor is it to be considered financial advice.
 
NASDAQ 100 Overtakes Bitcoin


This is how prices for popular exchange-traded assets changed from March 1 to May 31:
→ The price of the NASDAQ 100 increased by almost 20%
→ The price of the S&P-500 increased by almost 6%
→ The price of gold increased by almost 7%
→ The price of bitcoin increased by almost 14%
→ The price of Ethereum increased by almost 12%

For a long time, cryptocurrencies were the leaders of the spring market, but in May, the NASDAQ-100 made a sharp leap upwards, thanks to the soaring of the NVDA share price and the hype around artificial intelligence (AI).

What will happen in summer?

According to Citigroup analysts, there is a risk that the rally in US technology stocks will end as investors want to take profits.

Perhaps the hype around AI will decrease, as its widespread adoption should take time. Barclays analysts note that past game-changing technologies took several decades to show up at the level of the entire economy. Take electricity, automobiles, and refrigeration, for example – US labor productivity skyrocketed in the 1950s, 3-4 decades after these technologies were introduced.


VIEW FULL ANALYSIS VISIT - FXOpen Blog...

Disclaimer: This article represents the opinion of the Companies operating under the FXOpen brand only. It is not to be construed as an offer, solicitation, or recommendation with respect to products and services provided by the Companies operating under the FXOpen brand, nor is it to be considered financial advice.
 
AUD/USD and NZD/USD Start Steady Increase


AUD/USD is moving higher and might climb further higher above 0.6615. NZD/USD is also rising and might surge toward the 0.6145 resistance zone.

Important Takeaways for AUD USD and NZD USD Analysis Today

  • The Aussie Dollar started a fresh increase above the 0.6520 and 0.6550 levels against the US Dollar.
  • There was a break above a major bearish trend line with resistance near 0.6520 on the hourly chart of AUD/USD at FXOpen.
  • NZD/USD is gaining bullish momentum above the 0.6060 support.
  • There was a break above a key bearish trend line with resistance near 0.6020 on the hourly chart of NZD/USD at FXOpen.

AUD/USD Technical Analysis


On the hourly chart of AUD/USD at FXOpen, the pair started a fresh increase from the 0.6460 support. The Aussie Dollar was able to clear the 0.6500 resistance to start a steady uptrend against the US Dollar.

It cleared the 50-hour simple moving average and a major bearish trend line with resistance near 0.6520. The upward move was such that the bulls pumped the pair above the 61.8% Fib retracement level of the downward move from the 0.6660 swing high to the 0.6462 low.

The AUD USD chart indicates that the pair is now facing resistance near 0.6615. It is close to the 76.4% Fib retracement level of the downward move from the 0.6660 swing high to the 0.6462 low.

An upside break above the 0.6615 resistance might send the pair further higher. The next major resistance is near the 0.6660 level. Any more gains could open the doors for a move toward the 0.6700 resistance zone.

On the downside, initial support is near 0.6550. The next support could be the 0.6520 level and the 50-hour simple moving average. If there is a downside break below the 0.6520 support, the pair could extend its decline toward the 0.6460 level. Any more losses might signal a move toward 0.6400.

VIEW FULL ANALYSIS VISIT - FXOpen Blog...

Disclaimer: This article represents the opinion of the Companies operating under the FXOpen brand only. It is not to be construed as an offer, solicitation, or recommendation with respect to products and services provided by the Companies operating under the FXOpen brand, nor is it to be considered financial advice.
 
Market Analysis: AUD/USD Skyrockets


Since the beginning of yesterday's trading session, the AUD/USD rate has increased by 1.7%. This is due to the difference in the monetary policies of the Fed and the RBA.

On the one hand, Philadelphia Fed President Patrick Harker said on Thursday that it was time to at least press the stop button for one meeting and see how it goes, referring to the June 13-14 meeting and the pause in a series of Fed’s interest rate hikes.

On the other hand, Australia raised the minimum wage by 5.75% from July 1, a decision that will affect the wages of 2 million people. This is an argument in favor of the fact that the RBA will continue to raise interest rates. The decision will be published on June 6th.


VIEW FULL ANALYSIS VISIT - FXOpen Blog...

Disclaimer: This article represents the opinion of the Companies operating under the FXOpen brand only. It is not to be construed as an offer, solicitation, or recommendation with respect to products and services provided by the Companies operating under the FXOpen brand, nor is it to be considered financial advice.
 
Gold Price and Crude Oil Price Weekly Chart Outlook


Gold price remains supported for more gains above $2,000. Crude oil price is declining and might dive if there is a break below $65.00.

Important Takeaways for Gold and Oil Prices Analysis Today

  • Gold price rallied toward $2,080 before it started a downside correction against the US Dollar.
  • It is now trading above a connecting bullish trend line with support near $1,940 on the weekly chart of gold at FXOpen.
  • Crude oil prices are moving lower below $83.75 support.
  • There was a break below a major bullish trend line with support near $90.00 on the weekly chart of XTI/USD at FXOpen.

Gold Price Technical Analysis


On the weekly chart of Gold at FXOpen, the price started a fresh increase above the $1,870 resistance. The price gained pace and rallied above the $2,000 level.

There was a close above the 50-week simple moving average. It even surpassed $2,050 and tested $2,080. A high was formed near $2,081 before there was a downside correction. There was a move below the 23.6% Fib retracement level of the upward move from the $1,804 swing low to the $2,081 high.

The price tested the 50% Fib retracement level of the upward move from the $1,804 swing low to the $2,081 high at $1,940.

The price is also trading above a connecting bullish trend line with support near $1,940. If there is a downside break, the price might decline toward the $1,870 support. The next major support is near $1,740, below which the bulls could aim for a test of $1,660.

On the upside, the price might face resistance near the $2,050 level. The next major resistance is near the $2,080 level. An upside break above the $2,080 resistance could send Gold price toward $2,120. Any more gains may perhaps set the pace for an increase toward the $2,200 level.

VIEW FULL ANALYSIS VISIT - FXOpen Blog...

Disclaimer: This article represents the opinion of the Companies operating under the FXOpen brand only. It is not to be construed as an offer, solicitation, or recommendation with respect to products and services provided by the Companies operating under the FXOpen brand, nor is it to be considered financial advice.
 
Market Analysis: "Black Monday" for Crypto Community


On June 5, it became known that the SEC filed a lawsuit against the largest cryptocurrency exchange Binance, collapsing the price of bitcoin and other cryptocurrencies.

Here is the essence of claims:

→ improper handling of customer funds,
→ misleading investors and regulators,
→ violation of the law on activities with "unregistered securities” — the stablecoins of the BUSD exchange, the native BNB token, as well as a number of cryptocurrencies.

In addition, a lawsuit was filed against the head of the Binance exchange, Changpeng Zhao, who hastened to reassure customers: do not give in to fears, the exchange continues its work.


VIEW FULL ANALYSIS VISIT - FXOpen Blog...

Disclaimer: This article represents the opinion of the Companies operating under the FXOpen brand only. It is not to be construed as an offer, solicitation, or recommendation with respect to products and services provided by the Companies operating under the FXOpen brand, nor is it to be considered financial advice.
 
EUR/CHF and USD/CHF Weekly Chart Outlook


EUR/CHF is struggling to clear the 0.9960 resistance zone. USD/CHF could gain pace if it clears the 0.9290 resistance zone.

Important Takeaways for EUR/CHF and USD/CHF Analysis

  • The Euro is facing strong resistance near 0.9960 against the Swiss Franc.
  • There is a key bearish trend line forming with resistance near 0.9850 on the weekly chart of EUR/CHF at FXOpen.
  • USD/CHF found support near 0.8820 and recently started an upside correction.
  • There is a crucial bearish trend line forming with resistance near 0.9200 on the weekly chart at FXOpen.

EUR/CHF Technical Analysis


On the weekly chart of EUR/CHF at FXOpen, the pair started a decent recovery wave from the 0.9400 support zone. The Euro was able to climb above 0.9670 against the Swiss Franc.

During the increase, it traded above the 50% Fib retracement level of the last major decline from the 1.0515 swing high to the 0.9406 low. There was also a spike above the 0.9960 resistance and the 50-week simple moving average.

However, the pair struggled to clear the 1.0090 resistance zone. It failed near the 61.8% Fib retracement level of the last major decline from the 1.0515 swing high to the 0.9406 low.

On the EUR/CHF chart, the pair is moving lower and trading below the 50-week simple moving average. Immediate support is near the 0.9670 level. The first major support is near the 0.9400 level, below which the pair could decline toward 0.9200.

On the upside, the first major resistance is forming near a key bearish trend line at 0.9850. The next major resistance is near the 0.9960 level, above which the pair might revisit the 1.0090 resistance zone if the weekly RSI moves above 50. Any more gains might the pair toward 1.0500.

VIEW FULL ANALYSIS VISIT - FXOpen Blog...

Disclaimer: This article represents the opinion of the Companies operating under the FXOpen brand only. It is not to be construed as an offer, solicitation, or recommendation with respect to products and services provided by the Companies operating under the FXOpen brand, nor is it to be considered financial advice.
 
Market Analysis: A Week of Important News in Full Swing


On Tuesday, Australia's central bank raised interest rates from 3.85% to 4.10%. This is the highest value in 11 years. We wrote about the likelihood of this event in a post dated June 2. Speaking on June 7, bank governor Philip Lowe said: “We have been prepared to be patient [...] but our patience has a limit, and the risks are starting to test these limits,” warning of a possible further rise in rates.

Also yesterday, rates in Canada were raised to 4.75%, a 22-year high. Strong consumer spending, a recovery in demand for services, an increase in housing activity and the situation in the labor market show that excess demand is more stable than expected, the central bank said in a statement. Reuters writes that experts predict another increase next month, aimed at slowing down the overheating economy and stubbornly high inflation.


VIEW FULL ANALYSIS VISIT - FXOpen Blog...

Disclaimer: This article represents the opinion of the Companies operating under the FXOpen brand only. It is not to be construed as an offer, solicitation, or recommendation with respect to products and services provided by the Companies operating under the FXOpen brand, nor is it to be considered financial advice.
 
AUD/NZD and EUR/GBP Weekly Chart Outlook


AUD/NZD is facing major resistance near the 1.0985 zone. EUR/GBP broke a crucial support at 0.8720 and might continue to move lower.

Important Takeaways for AUD/NZD and EUR/GBP Analysis

  • The Aussie Dollar started a recovery wave from the 1.0600 support against the New Zealand Dollar.
  • There is a key bullish trend line forming with support near 1.0600 on the weekly chart of AUD/NZD at FXOpen.
  • EUR/GBP started a major decline from the 0.9000 resistance zone.
  • It traded below a major bullish trend line with support near 0.8720 on the weekly chart at FXOpen.

AUD/NZD Technical Analysis


On the weekly chart of AUD/NZD at FXOpen, the pair found support near 1.0500. The Aussie Dollar formed a base above the 1.0600 pivot level against the New Zealand Dollar.

There was a decent increase above the 23.6% Fib retracement level of the downward move from the 1.1489 swing high to the 1.0479 low. Earlier this year, the pair even pumped above the 1.0920 resistance zone.

However, the bears were active near the 50% Fib retracement level of the downward move from the 1.1489 swing high to the 1.0479 low. The pair declined and revisited the 1.0600 support. It is again moving higher toward the 50-week simple moving average at 1.0920.

On the AUD/NZD chart, the pair could struggle to surpass 1.0920 and 1.0985. Only a successful daily close above 1.0985 might start a strong increase. The next major resistance sits near the 1.1100 level.

On the downside, the first major support is near a key bullish trend line at 1.0600. The next major support is near the 1.0300 level, below which the pair may perhaps extend its decline toward the 1.0150 level. Any more losses might call for a move toward the 1.0000 level.

VIEW FULL ANALYSIS VISIT - FXOpen Blog...

Disclaimer: This article represents the opinion of the Companies operating under the FXOpen brand only. It is not to be construed as an offer, solicitation, or recommendation with respect to products and services provided by the Companies operating under the FXOpen brand, nor is it to be considered financial advice.
 
The Crypto Market Is Under Pressure Due to SEC. Apart from This Coin


This week, the financial regulator SEC launched an attack on the cryptocurrency industry, suing the Binance and Coinbase exchanges, while classifying a number of popular coins as securities. As a result, since the beginning of June:

→ the price of bitcoin decreased by approximately 2.2%;
→ the price of Ethereum decreased by approximately 1.8%;
→ the price of BNB, the native token of the Binance exchange, has decreased by approximately 16%.

However, if we look at the Ripple chart today, we will see that the price of XRP has risen by about 2.5% since the beginning of the month. The fact is that Ripple has been in a state of litigation with the SEC since December 2020 (the commission also considers XRP a security). And the latest claims of the regulator have a lesser effect on the XRP exchange rate against the US dollar.

Moreover, rumors are circulating that the SEC has a presentiment that it can lose in a dispute with Ripple. And therefore, with new lawsuits against Binance and Coibase, it is trying to influence the decision in the case with Ripple, to reduce reputational risks.


VIEW FULL ANALYSIS VISIT - FXOpen Blog...

Disclaimer: This article represents the opinion of the Companies operating under the FXOpen brand only. It is not to be construed as an offer, solicitation, or recommendation with respect to products and services provided by the Companies operating under the FXOpen brand, nor is it to be considered financial advice.
 
Watch FXOpen's June 5 - 9 Weekly Market Wrap Video

Weekly Market Wrap With Gary Thomson : PRICE OF BRENT OIL, S&P-500 , AAPL ANALYSIS, NATURAL GAS


Get the latest scoop on the week's hottest headlines, all in one convenient video. Join Gary Thomson, the COO of FXOpen UK, as he breaks down the most significant news reports and shares his expert insights.

  • The price of Brent oil rises after Saudis’ decision. “This market needs stabilisation,” Saudi Energy Minister says
  • S&P-500: historical imbalance. Why is it dangerous?
  • AAPL Analysis: ‘Zombies’ take a big bite of Apple. All-time high over already?
  • Natural Gas Analysis: Third lowest value of the year about to be fuelled by optimism?

Stay in the know and empower yourself with our short, yet power-packed video. Watch it now and stay updated with FXOpen.

Don't miss out on this invaluable opportunity to sharpen your trading skills and make informed decisions.


FXOpen YouTube


Disclaimer: This article represents the opinion of the Companies operating under the FXOpen brand only. It is not to be construed as an offer, solicitation, or recommendation with respect to products and services provided by the Companies operating under the FXOpen brand, nor is it to be considered financial advice.

#fxopen #fxopenyoutube #fxopenuk #weeklyvideo
 
GBP/USD Consolidates Gains, USD/CAD Faces Hurdle


GBP/USD is showing positive signs above the 1.2540 resistance. USD/CAD is struggling and might decline further below the 1.3310 support.

Important Takeaways for GBP/USD and USD/CAD Analysis Today

  • The British Pound started a strong increase above the 1.2440 resistance zone.
  • There is a key bullish trend line forming with support near 1.2540 on the hourly chart of GBP/USD at FXOpen.
  • USD/CAD is correcting losses from the 1.3310 support zone.
  • There is a major bearish trend line forming with resistance near 1.3350 on the hourly chart at FXOpen.

GBP/USD Technical Analysis


On the hourly chart of GBP/USD at FXOpen, the pair started a major increase from the 1.2370 zone. The British Pound climbed above the 1.2440 resistance against the US Dollar.

The upward move gained pace above the 1.2500 resistance and the 50-hour simple moving average. Finally, it broke the 1.2540 resistance and traded toward 1.2600. A high is formed near 1.2590 and the pair is now consolidating gains.

Initial support sits near a key bullish trend line at 1.2540 and the 50-hour simple moving average. It is close to the 23.6% Fib retracement level of the upward move from the 1.2395 swing low to the 1.2590 high.

The next major support sits at 1.2500 or the 50% Fib retracement level of the upward move from the 1.2395 swing low to the 1.2590 high, where the bulls might take a stand. If there is a downside break, GBP/USD might test the 1.2440 support.

Immediate resistance is near the 1.2590 level. The first major resistance on the GBP/USD chart is near the 1.2600 level. The next major resistance is near the 1.2620 level. Any more gains could lead the pair toward the 1.2650 resistance in the near term.

VIEW FULL ANALYSIS VISIT - FXOpen Blog..

Disclaimer: This article represents the opinion of the Companies operating under the FXOpen brand only. It is not to be construed as an offer, solicitation, or recommendation with respect to products and services provided by the Companies operating under the FXOpen brand, nor is it to be considered financial advice.
 
GBPUSD Analysis: Will the British Pound Continue to Soar against the US Dollar Following 1-month High?


During the latter part of 2022, the British Pound was continually the recipient of the proverbial ‘wooden spoon’ as it declined consistently over a series of months against the US Dollar.

That was a very interesting set of market conditions, bearing in mind that the US economy was struggling with the national debt, whereas the British economy was less encumbered, but had been buckling under high inflation and a cost of living crisis, which was far less of a concern across the United States, which by the last quarter of 2022, had got its inflation level down to almost half that of Britain.

However, the downward spiral that the British Pound experienced last year has long since stopped, and now things are quite different.

Today, the British Pound has reached a 1-month high point against the US Dollar and is at its second-highest value in 12 months at the mid-1.26 range.

VIEW FULL ANALYSIS VISIT - FXOpen Blog...

Disclaimer: This article represents the opinion of the Companies operating under the FXOpen brand only. It is not to be construed as an offer, solicitation, or recommendation with respect to products and services provided by the Companies operating under the FXOpen brand, nor is it to be considered financial advice.
 
BTCUSD Analysis: Clients Fleeing Binance


According to various estimates, from USD 2.36 billion to USD 3.35 billion was withdrawn from the largest cryptocurrency exchange in 1 week. The head of the exchange, Changpeng Zhao, said that the drop in the balance could be exaggerated due to the depreciation of cryptocurrencies against the dollar, but fears are growing.

Hearings will be held today to freeze the assets of the Binance.US exchange in a lawsuit filed by the SEC. By the way, Binance also received a complaint from regulators in Nigeria, a country leading in the adoption of cryptocurrencies in Africa.

Cryptocurrency market enthusiasts are given hope by a bill introduced yesterday by Congressmen Warren Davids and Tom Emmer, which involves the restructuring of the SEC and the dismissal of its head, Gary Gensler. However, believing that this will happen may be too naive.

In one week after the lawsuits from the SEC, the market capitalization of crypto decreased by approximately USD 75 billion. The decline leaders are crypto assets that the SEC classified as securities - ADA, BNB, MATIC and others - about 60 assets in total. Fortunately for enthusiasts, ETH and BTC are not among them.


VIEW FULL ANALYSIS VISIT - FXOpen Blog...

Disclaimer: This article represents the opinion of the Companies operating under the FXOpen brand only. It is not to be construed as an offer, solicitation, or recommendation with respect to products and services provided by the Companies operating under the FXOpen brand, nor is it to be considered financial advice.
 
EUR/USD Turns Green While USD/JPY Faces Hurdle


EUR/USD started a fresh increase above the 1.0740 resistance. USD/JPY is consolidating and facing hurdles near the 140.45 level.

Important Takeaways for EUR/USD and USD/JPY Analysis Today

  • The Euro is rising and trading well above the 1.0740 resistance zone.
  • There is a key bullish trend line forming with support near 1.0785 on the hourly chart of EUR/USD at FXOpen.
  • USD/JPY is trading in a positive zone above the 139.65 and 139.15 levels.
  • There was a break above a bearish trend line with resistance near 139.65 on the hourly chart at FXOpen.

EUR/USD Technical Analysis


On the hourly chart of EUR/USD at FXOpen, the pair started a fresh increase from the 1.0670 zone. The Euro climbed above the 1.0710 resistance zone against the US Dollar.

The pair even settled above the 1.0740 resistance and the 50-hour simple moving average. Finally, the bears appeared near the 1.0820 zone. A high is formed near 1.0818 and the pair is now consolidating gains.

It traded below the 23.6% Fib retracement level of the upward move from the 1.0743 low to the 1.0818 high. The first major support is near a key bullish trend line at 1.0785 and the 50-hour simple moving average.

The trend line is close to the 50% Fib retracement level of the upward move from the 1.0743 low to the 1.0818 high. If there is a downside break below 1.0785, the pair could drop toward the 1.0740 support. The next major support on the EUR/USD chart is near 1.0710, below which the pair could start a major decline.

On the upside, the pair is now facing resistance near 1.0820. The next major resistance is near the 1.0850 level. An upside break above 1.0850 could set the pace for another increase. In the stated case, the pair might visit 1.0920.

VIEW FULL ANALYSIS VISIT - FXOpen Blog...

Disclaimer: This article represents the opinion of the Companies operating under the FXOpen brand only. It is not to be construed as an offer, solicitation, or recommendation with respect to products and services provided by the Companies operating under the FXOpen brand, nor is it to be considered financial advice.
 
USD/CNH Reaches Year-to-date High


Over the past 2 months, CNH has appreciated about 4.4% against the US dollar, reflecting the differences in monetary policies in the world's two largest (and competing) economies.

Yesterday's statistics showed a decrease in inflation in the US, but its level is still far from the target values. It is expected that the Fed at today's meeting will take a break after 10 consecutive increases in the key interest rate, keeping the prospect of raising it until the end of the year. The decision will be published at 21:00 GMT+3, followed by Powell's press conference at 21:30.

In China, the central bank lowered key short-term interest rates on Tuesday. It is expected that rates on medium-term loans may be lowered on Thursday. Barclays predicts that the Central Bank of China will cut rates every quarter in 2023, as economic growth after the lifting of restrictions due to Covid is disappointing.

With China stimulating the economy and curbing inflation by shrinking the US economy, USD/CNH hit its highest since the start of the year, trading near 7.18 today. Thus, the quote is fixed above the level of 7.15, which acted as resistance at the beginning of the month.


VIEW FULL ANALYSIS VISIT - FXOpen Blog...

Disclaimer: This article represents the opinion of the Companies operating under the FXOpen brand only. It is not to be construed as an offer, solicitation, or recommendation with respect to products and services provided by the Companies operating under the FXOpen brand, nor is it to be considered financial advice.
 
GBPUSD Analysis: Will the British Pound Continue to Soar against the US Dollar Following 1-month High?


During the latter part of 2022, the British Pound was continually the recipient of the proverbial ‘wooden spoon’ as it declined consistently over a series of months against the US Dollar.

That was a very interesting set of market conditions, bearing in mind that the US economy was struggling with the national debt, whereas the British economy was less encumbered, but had been buckling under high inflation and a cost of living crisis, which was far less of a concern across the United States, which by the last quarter of 2022, had got its inflation level down to almost half that of Britain.

However, the downward spiral that the British Pound experienced last year has long since stopped, and now things are quite different.

Today, the British Pound has reached a 1-month high point against the US Dollar and is at its second-highest value in 12 months at the mid-1.26 range.

VIEW FULL ANALYSIS VISIT - FXOpen Blog...

Disclaimer: This article represents the opinion of the Companies operating under the FXOpen brand only. It is not to be construed as an offer, solicitation, or recommendation with respect to products and services provided by the Companies operating under the FXOpen brand, nor is it to be considered financial advice.
nice
 
AUD/NZD and EUR/GBP Weekly Chart Outlook


AUD/NZD is facing major resistance near the 1.0985 zone. EUR/GBP broke a crucial support at 0.8720 and might continue to move lower.

Important Takeaways for AUD/NZD and EUR/GBP Analysis

  • The Aussie Dollar started a recovery wave from the 1.0600 support against the New Zealand Dollar.
  • There is a key bullish trend line forming with support near 1.0600 on the weekly chart of AUD/NZD at FXOpen.
  • EUR/GBP started a major decline from the 0.9000 resistance zone.
  • It traded below a major bullish trend line with support near 0.8720 on the weekly chart at FXOpen.

AUD/NZD Technical Analysis


On the weekly chart of AUD/NZD at FXOpen, the pair found support near 1.0500. The Aussie Dollar formed a base above the 1.0600 pivot level against the New Zealand Dollar.

There was a decent increase above the 23.6% Fib retracement level of the downward move from the 1.1489 swing high to the 1.0479 low. Earlier this year, the pair even pumped above the 1.0920 resistance zone.

However, the bears were active near the 50% Fib retracement level of the downward move from the 1.1489 swing high to the 1.0479 low. The pair declined and revisited the 1.0600 support. It is again moving higher toward the 50-week simple moving average at 1.0920.

On the AUD/NZD chart, the pair could struggle to surpass 1.0920 and 1.0985. Only a successful daily close above 1.0985 might start a strong increase. The next major resistance sits near the 1.1100 level.

On the downside, the first major support is near a key bullish trend line at 1.0600. The next major support is near the 1.0300 level, below which the pair may perhaps extend its decline toward the 1.0150 level. Any more losses might call for a move toward the 1.0000 level.

VIEW FULL ANALYSIS VISIT - FXOpen Blog...

Disclaimer: This article represents the opinion of the Companies operating under the FXOpen brand only. It is not to be construed as an offer, solicitation, or recommendation with respect to products and services provided by the Companies operating under the FXOpen brand, nor is it to be considered financial advice.
wow thanks
 

Create an account or login to comment

You must be a member in order to leave a comment

Create account

Create an account on our community. It's easy!

Log in

Already have an account? Log in here.

Similar threads

Users Who Are Viewing This Thread (Total: 1, Members: 0, Guests: 1)

Top
AdBlock Detected

We get it, advertisements are annoying!

Sure, ad-blocking software does a great job at blocking ads, but it also blocks useful features of our website. For the best site experience please disable your AdBlocker.

I've Disabled AdBlock    No Thanks