Capitalcore
Member
US30 Price Action and Technical Outlook on H4 Chart
The US30, also known as the Dow Jones Industrial Average (DJIA) or simply the Dow, is a key benchmark index representing 30 major U.S. companies and is widely traded in the forex market as a CFD under the US30 forex pair. Often referred to as a barometer of U.S. economic health, the Dow’s movements are closely tied to major economic news and data releases. Today’s fundamental analysis centers on a series of high-impact U.S. economic indicators, including labor inflation, employment change (Non-Farm Payrolls), and the unemployment rate—data that are critical in shaping the Federal Reserve's monetary policy expectations. While the U.S. Treasury’s semiannual currency report is tentatively scheduled, its potential implications on global exchange rate policies and any accusations of currency manipulation could influence forex flows and risk sentiment. If employment data comes in stronger than forecast, this could pressure equities due to renewed rate hike fears, while weaker labor data may support a more dovish outlook, boosting the US30. These developments make today's session particularly sensitive for Dow Jones price action, especially as traders await direction from upcoming figures and Fed sentiment.
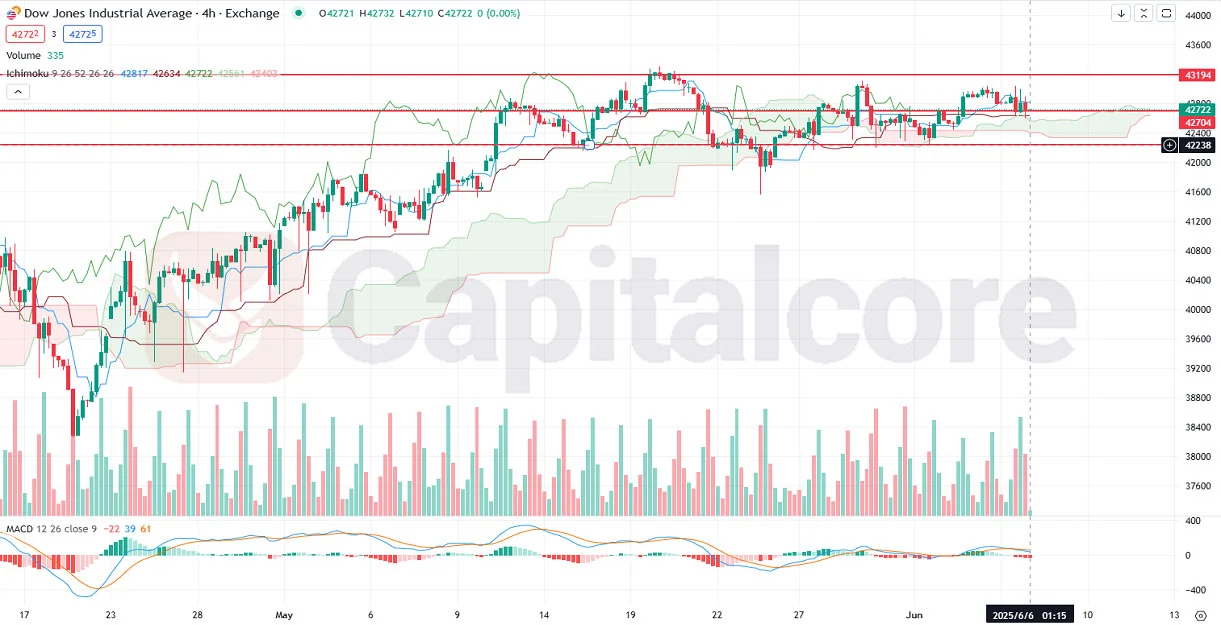
Chart Notes:
• Chart time-zone is UTC (+03:00)
• Candles’ time-frame is 4h.
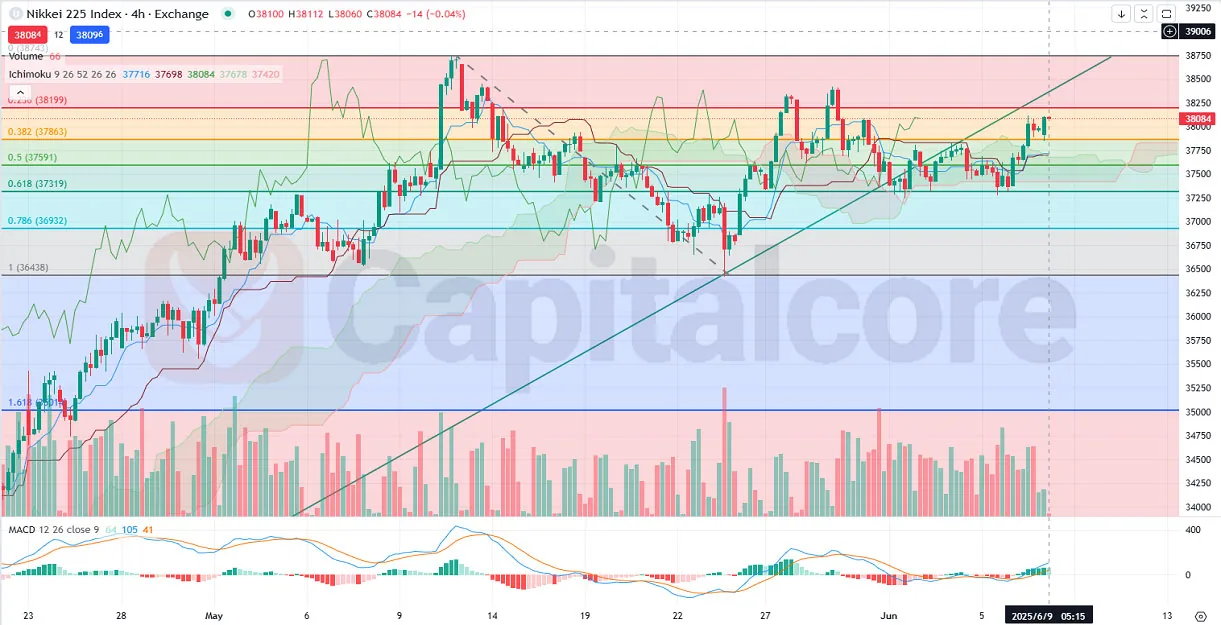
From a technical standpoint on the H4 chart, the US30 – Dow Jones Industrial Average is currently trading in a horizontal range between the support zone of 42238 and resistance around 43194, with price movement alternating between bullish and bearish candles. Over the last few days, price action has lacked strong directional movement but remains in a broader bullish trend that has recently slowed down. Importantly, price continues to trade above the Ichimoku cloud, which remains green but has become thinner, signaling weakening bullish momentum. Previous candles tested the upper edge of the cloud but failed to penetrate it, while the most recent candles remain above it, suggesting dynamic support is still intact. Volume bars show a mixed outlook with no clear accumulation or distribution trend, although a slight uptick in green bars hints at buyers attempting to regain control. The MACD and histogram indicate weakening momentum, with a possible convergence forming that could lead to a short-term pullback unless fresh bullish volume confirms a breakout. Overall, the Dow is holding its bullish structure on the 4H time frame, but traders should watch closely for confirmation of direction around current levels.
•DISCLAIMER: Please note that the above analysis is not an investment suggestion by “Capitalcore LLC”. This post has been published only for educational purposes.
Capitalcore
The US30, also known as the Dow Jones Industrial Average (DJIA) or simply the Dow, is a key benchmark index representing 30 major U.S. companies and is widely traded in the forex market as a CFD under the US30 forex pair. Often referred to as a barometer of U.S. economic health, the Dow’s movements are closely tied to major economic news and data releases. Today’s fundamental analysis centers on a series of high-impact U.S. economic indicators, including labor inflation, employment change (Non-Farm Payrolls), and the unemployment rate—data that are critical in shaping the Federal Reserve's monetary policy expectations. While the U.S. Treasury’s semiannual currency report is tentatively scheduled, its potential implications on global exchange rate policies and any accusations of currency manipulation could influence forex flows and risk sentiment. If employment data comes in stronger than forecast, this could pressure equities due to renewed rate hike fears, while weaker labor data may support a more dovish outlook, boosting the US30. These developments make today's session particularly sensitive for Dow Jones price action, especially as traders await direction from upcoming figures and Fed sentiment.
Chart Notes:
• Chart time-zone is UTC (+03:00)
• Candles’ time-frame is 4h.
From a technical standpoint on the H4 chart, the US30 – Dow Jones Industrial Average is currently trading in a horizontal range between the support zone of 42238 and resistance around 43194, with price movement alternating between bullish and bearish candles. Over the last few days, price action has lacked strong directional movement but remains in a broader bullish trend that has recently slowed down. Importantly, price continues to trade above the Ichimoku cloud, which remains green but has become thinner, signaling weakening bullish momentum. Previous candles tested the upper edge of the cloud but failed to penetrate it, while the most recent candles remain above it, suggesting dynamic support is still intact. Volume bars show a mixed outlook with no clear accumulation or distribution trend, although a slight uptick in green bars hints at buyers attempting to regain control. The MACD and histogram indicate weakening momentum, with a possible convergence forming that could lead to a short-term pullback unless fresh bullish volume confirms a breakout. Overall, the Dow is holding its bullish structure on the 4H time frame, but traders should watch closely for confirmation of direction around current levels.
•DISCLAIMER: Please note that the above analysis is not an investment suggestion by “Capitalcore LLC”. This post has been published only for educational purposes.
Capitalcore