What's new

Forex News Daily Market Forecast By Capitalcore

5.00 star(s) 1 Vote
Bitcoin Breakout or Pullback? Critical Levels in Focus

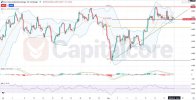
Bitcoin (BTC/USD), often referred to as "Crypto Gold," is the leading cryptocurrency that represents a decentralized digital asset and a store of value. As the price fluctuates, Bitcoin remains a key focus for both investors and traders, influencing the broader crypto market. In the current market, Bitcoin is showing a new wave of bullish movement despite short-term bearish corrections. The price has been hovering above the Ichimoku Cloud since the new all-time high (ATH) on July 14th, maintaining momentum above the support at 116,000. While the market shows short-term indecision, Bitcoin's overall trend remains bullish, especially with the recent price action showing bullish signals. Today, various economic releases such as the API Weekly Statistical Bulletin and the National Association of Realtors' home resale data will influence the USD, possibly providing volatility for the BTC-USD pair.

Chart Notes:
• Chart time-zone is UTC (+03:00)
• Candles’ time-frame is 4h.

The Bitcoin chart reveals a continuation of upward pressure, with recent price action suggesting a consolidation within an orange channel, indicating a short-term correction. The lower boundary of this channel near 116,000 is acting as strong support, and the upper boundary is now facing a potential resistance level. The Ichimoku Cloud continues to show bullish signals, with the candles moving above the cloud, although a potential resistance at 120,500 may pose a challenge. The CRSI (Connors RSI) indicator is at a high value of 78.48, suggesting that Bitcoin is in overbought territory, which could lead to a pullback before further movement upwards. The bullish long-term trend line remains intact, but caution should be observed in the short term due to the resistance levels ahead.

•DISCLAIMER: Please note that the above analysis is not an investment suggestion by “Capitalcore LLC”. This post has been published only for educational purposes.

Capitalcore
 
Excellent analysis on EUR/GBP! Your combination of fundamental drivers and technical indicators provides clear market insights. The Bollinger Band squeeze and MACD crossover strongly support the current bearish momentum. While the low-impact Eurozone data may limit volatility, Nagel's speech could offer unexpected catalysts. Would be valuable to see how price reacts at the lower band support. Looking forward to your next update - always appreciate Capitalcore's thorough market breakdowns.
 
GBPUSD technical analysis with Ichimoku and MACD

The GBP/USD currency pair - commonly referred to by traders as “Cable”- is one of the most actively traded pairs in the forex market, representing the British pound against the US dollar. As a key barometer of transatlantic economic health, this pair is heavily influenced by both macroeconomic releases and geopolitical developments. Today’s focus is on the Confederation of British Industry's distributive trades survey and a major geopolitical shift between the US and EU.
Fundamentally, the GBP USD pair faces mixed momentum. The UK's CBI Distributive Trades Survey will be closely watched today, offering insights into consumer spending and retail activity. If the actual result exceeds expectations, it could offer short-term support for the pound. However, overriding this is a major geopolitical development: the US and EU have reached a deal to impose a 15% tariff on most EU exports, successfully avoiding a full-scale trade war. This agreement includes a massive $600 billion EU investment in the US, greater EU energy and defense purchases, and sustained high tariffs on US steel and aluminum. While this strengthens USD sentiment due to favorable US terms, it could pressure the pound amid uncertainty over how this deal may affect UK-EU-US trade relationships. Overall, the fundamental outlook for GBP/USD leans bearish, with downside risk persisting unless UK retail data strongly outperforms.

Chart Notes:
• Chart time-zone is UTC (+03:00)
• Candles’ time-frame is 4h.

Technically, the GBP/USD H4 chart shows a clear bearish structure, confirmed by price action and indicators. The Cable price is currently moving between the 1.0 and 0.786 Fibonacci retracement levels, hovering just above a critical support zone around 1.34000, which aligns with the lower boundary of a descending triangle pattern. This level has acted as strong support multiple times historically and remains crucial. The GBP-USD price broke below the Ichimoku Cloud last week, with the green cloud thinning and showing a flat bottom, typically signaling weak bullish momentum and increased risk of further decline. The orange bearish trendline continues to cap upward moves, with 9 of the last 10 candles being bearish, showing consistent selling pressure. Indicators confirm this trend: the %R is deeply oversold at -91.34, and the MACD is bearish, with widening histogram bars and a fresh cross below the signal line. Resistance stands at 0.786 retracement (around 1.34717). A confirmed break below 1.34000 could open the path toward the 1.33390 area, while any bullish bounce will likely be limited by strong resistance zones.

DISCLAIMER: Please note that the above analysis is not an investment suggestion by “Capitalcore LLC”. This post has been published only for educational purposes.

Capitalcore
 
EURUSD H4 Chart Insights MACD Indicates Bearish

EUR/USD, commonly known as the "Fiber," is the most actively traded currency pair globally, reflecting the economic health between the Eurozone and the United States. Today, significant attention is directed toward the Flash GDP release from the Eurozone, which measures the quarterly economic growth and strongly influences the EUR, as an actual figure above the forecast usually strengthens the currency. Conversely, the USD awaits impactful data including the Goods Trade Balance and the JOLTS Job Openings report, essential indicators that affect export demand and employment market confidence, respectively, thus influencing dollar sentiment and price action.

Chart Notes:
• Chart time-zone is UTC (+03:00)
• Candles’ time-frame is 4h.

Technically analyzing the EUR/USD H4 chart, after undergoing a bullish trend, recent candlesticks have convincingly breached the former support line, initiating a sharp bearish momentum. Prices have currently approached a critical support zone, an area repeatedly tested previously and coinciding with a prior resistance trend line, hinting at potential bullish corrective price action in the near term. The Bollinger Bands have significantly widened, indicating high volatility that may contract soon, implying stabilization or corrective moves might follow shortly. The RSI indicator stands near oversold territory at 30, reinforcing the likelihood of a bullish reversal or correction. Additionally, the MACD histogram remains deeply negative at -0.00214 with the MACD line below the signal line at -0.00238 compared to -0.00024, underscoring prevailing bearish sentiment yet also indicating potential exhaustion and possible reversal.

•DISCLAIMER: Please note that the above analysis is not an investment suggestion by “Capitalcore LLC”. This post has been published only for educational purposes.

Capitalcore
 
USD/CAD Eyes Resistance Amid Mixed Fundamentals

USD/CAD, the currency pair representing the US Dollar against the Canadian Dollar, remains heavily influenced by economic indicators and central bank guidance from both nations. Currently, market focus is split between US labor and inflation data and Canada’s resource-driven fundamentals. From the US side, key updates include the ADP Non-Farm Employment Change and the advance GDP release, both offering early insight into employment trends and overall economic health. Meanwhile, attention also centers on the Federal Reserve’s interest rate decision and accompanying FOMC statement and press conference, where even subtle shifts in tone can drive volatility. In Canada, the Bank of Canada’s monetary policy stance, as communicated through its rate statement and governor's press conference, is equally impactful. With the loonie’s sensitivity to energy prices, crude oil inventory data from both the API and EIA adds another layer of influence. Lower-than-expected inventories can boost oil prices, often lending support to CAD. As traders digest these mixed signals—stronger US growth versus commodity and rate-driven Canadian dynamics—USD/CAD is poised for responsive moves ahead of the next central bank updates in September.

Chart Notes:
• Chart time-zone is UTC (+03:00)
• Candles’ time-frame is 4h.

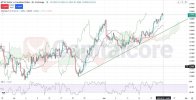
Analyzing the USD/CAD 4-hour chart, the price is currently testing a significant resistance zone between 1.3775 and 1.3797, a level that has acted as a strong barrier during previous attempts in mid-June and early July. Price is approaching this level along a steep ascending trendline, indicating strong short-term bullish momentum. However, technical indicators suggest a potential stall. The RSI is at 69.67—just below the overbought threshold—signaling limited upside room and increased likelihood of a pullback. Furthermore, the MACD, while still in positive territory, shows signs of convergence, with the MACD line nearing the signal line, hinting at weakening momentum. These factors combined suggest that a breakout above this resistance may face difficulty without a strong fundamental catalyst. Traders should be cautious and watch for bearish signals near this zone, as a rejection could lead to a short-term correction toward trendline or support levels below 1.3700.

• DISCLAIMER: Please note that the above analysis is not an investment suggestion by “Capitalcore LLC”. This post has been published only for educational purposes.

Capitalcore
 
Nikkei 225 H4 chart technical breakdown

The Nikkei 225 Index, often referred to as "Nikkei" or "JAP 225," is Japan’s premier stock market index, tracking the performance of 225 large, publicly-owned companies listed on the Tokyo Stock Exchange. It is one of the most watched indices in the Asia-Pacific region and serves as a critical benchmark for the Japanese equity market. From a fundamental perspective, the Japanese yen (JPY) is in focus today with a cluster of key economic indicators pending release, although all are scheduled for later dates in August and beyond. Market participants are pricing in expectations around Japan’s inflation-adjusted industrial output, retail sales, housing starts, and consumer sentiment—all vital indicators of domestic economic health. With the Bank of Japan maintaining a dovish stance and interest rates remaining ultra-low until at least the September 19 meeting, investor sentiment remains cautious. The anticipation of upcoming BOJ communications, especially any hint of tightening or yield curve control adjustments, may increase volatility. Until then, the Nikkei’s trajectory may remain largely influenced by risk appetite and global macro flows.

Chart Notes:
• Chart time-zone is UTC (+03:00)
• Candles’ time-frame is 4h.

From a technical standpoint, the 4-hour chart of Nikkei 225 reflects that the market has overall kept a bullish momentum and now has entered a correction phase, currently reacting to the 0.236 Fibonacci retracement level around 40755. This area is acting as short-term support. The price is hovering near the bottom of the Ichimoku cloud, indicating indecision. The base line (Kijun-sen) is positioned above the price, and the conversion line (Tenkan-sen) is below the last candle, potentially hinting the end of the correction. The RSI (Relative Strength Index) is at 47.90, just below the neutral 50 mark, suggesting weakening momentum but no immediate oversold condition. Meanwhile, the MACD histogram shows bearish momentum with a reading of -17, and both the MACD line (-67) and Signal line (-49) remain in negative territory. If this correction deepens, the price may target the 0.382 retracement level, but a bullish reversal from the current level could see a retest of 41941 or even approach the 0.5 Fibonacci extension level at 43311.

•DISCLAIMER: Please note that the above analysis is not an investment suggestion by “Capitalcore LLC”. This post has been published only for educational purposes.

Capitalcore
 
Price action outlook for LTCUSD H4 today

Litecoin (LTC), often referred to as the “silver to Bitcoin’s gold,” is a peer-to-peer cryptocurrency created to offer faster and more efficient transactions compared to Bitcoin. The LTCUSD forex pair reflects the value of one Litecoin in terms of the U.S. dollar, and is a commonly traded asset in both crypto and forex markets, driven by sentiment, macroeconomic factors, and technical signals. Today, the U.S. dollar's movement will likely be influenced by a dense set of high-impact macroeconomic indicators, including the Non-Farm Payrolls (NFP), Unemployment Rate, and Average Hourly Earnings. These releases, all coming from the Bureau of Labor Statistics, are key labor market indicators and critical inputs for monetary policy decisions. Strong NFP or wage growth figures typically bolster the USD, potentially pushing LTC USD lower. However, any signs of economic slowdown or rising unemployment could weaken the dollar, offering upward support for LTC. Additionally, PMI and ISM manufacturing reports, along with University of Michigan sentiment data, will offer early signals on inflation and economic confidence, adding volatility to today’s session for LTC/USD traders.

Chart Notes:
• Chart time-zone is UTC (+03:00)
• Candles’ time-frame is 4h.

The LTC/USD 4-hour chart shows the price currently in a bearish trend, forming lower highs under a descending resistance trendline. Price action has entered the Ichimoku Cloud, indicating indecision and potential consolidation. Currently, the price sits between the 0.786 and 0.618 Fibonacci retracement levels, suggesting that while a minor support may exist within the cloud, further bearish pressure could push the price down toward the 0.618 Fibonacci level at $103.49, which aligns with previous demand zones. The lower bound of the Ichimoku cloud also reinforces this level as the next probable support. Meanwhile, the Williams %R oscillator sits at -55.97, reflecting mid-level momentum with room for deeper downward movement. A break below the purple demand box (highlighted support zone) would confirm a continuation of the bearish structure in this LTC-USD H4 chart technical and fundamental analysis.

• DISCLAIMER: Please note that the above analysis is not an investment suggestion by “Capitalcore LLC”. This post has been published only for educational purposes.

Capitalcore
 
BTCUSD Oversold Condition Signals Bounce

Bitcoin, often referred to as "digital gold" or simply "BTC," is the leading cryptocurrency and is commonly paired with the US Dollar (USD) in the forex and crypto markets. The BTC/USD pair is known for its high volatility and strong reaction to both macroeconomic news and cryptocurrency-specific events, making it a favorite for traders focused on price action, market sentiment, and technical analysis. From a fundamental perspective, today's focus is on two key USD-related events. First, the Factory Orders report from the US Census Bureau will shed light on the change in total value of new purchase orders, which acts as a leading indicator of production trends. A stronger-than-expected figure could signal bullish sentiment for the USD, putting downward pressure on BTC-USD. Second, the Senior Loan Officer Survey from the Federal Reserve, though more qualitative and released less frequently, could provide insights into credit conditions and overall economic confidence. If loan standards are loosening and demand is strong, it may reflect a resilient US economy, favoring USD strength. As BTC often moves inversely to USD, both releases could prompt short-term volatility for the BTC/USD daily chart.

Chart Notes:
• Chart time-zone is UTC (+03:00)
• Candles’ time-frame is 4h.

On the BTC/USD H4 (4-hour) chart, price action shows a bearish descending channel forming since the July 14th high. The candles have been moving in a slightly downward horizontal range, but price has just tested the long-term ascending trend line and the lower bound of the descending channel, both acting as strong support. A green candle has now formed, suggesting a potential bullish reaction. However, the price remains below the Ichimoku Cloud, which is currently aligned near the upper band of the channel, indicating that upward momentum may face resistance unless a breakout occurs. The %R indicator reading of -90.08 signals an oversold condition, often interpreted as a potential reversal zone, especially when supported by price structure and trendline confluence. Traders watching this BTC/USD 4-hour chart might expect a corrective bounce or even a breakout attempt, depending on incoming fundamental catalysts like today’s USD news.

• DISCLAIMER: Please note that the above analysis is not an investment suggestion by “Capitalcore LLC”. This post has been published only for educational purposes.

Capitalcore
 
EUR/USD Fundamental Analysis and Trading Outlook

The EURUSD, widely known as "Fiber," is among the most actively traded forex pairs globally, representing the Euro against the US Dollar. Traders closely monitor the pair due to its high liquidity, volatility, and sensitivity to economic news. Today's fundamental analysis reveals that several crucial reports are set to impact EURUSD price action significantly. The US Bureau of Economic Analysis is releasing Trade Balance data, a pivotal indicator influencing currency strength, where a positive outcome (exports exceeding imports) generally supports the USD. Additionally, key US indicators like the Services PMI by S&P Global and ISM Non-Manufacturing PMI will provide insights into economic health, with values above 50 signaling expansion and likely benefiting the Dollar. On the Euro side, industrial production data from INSEE and various Services PMIs from S&P Global could sway the Euro, with stronger-than-forecast figures potentially boosting bullish momentum for the EURUSD.

Chart Notes:
• Chart time-zone is UTC (+03:00)
• Candles’ time-frame is 4h.

Analyzing the EURUSD H4 chart, we observe significant price action after breaking through a major historical resistance around 1.10000. The pair formed a double top pattern upon retracing back to this crucial breakout level and is currently battling within a critical cluster zone coinciding with the upper Bollinger Band, highlighting strong resistance. Recent price movement shows a powerful bullish candle reacting positively to its support zone. Bollinger Bands indicate a possible consolidation or potential reversal, as price tests the upper band. The RSI is currently neutral, implying room for either bullish continuation or a short-term correction. The Stochastic indicator suggests overbought conditions, signaling a potential short-term bearish correction could occur before further bullish movements resume.

•DISCLAIMER: Please note that the above analysis is not an investment suggestion by “Capitalcore LLC”. This post has been published only for educational purposes.

Capitalcore
 
GBP/USD Elliott Wave Completion Signals Bullish Trend

The GBP-USD forex pair, often called "Cable," reflects the exchange rate between the British Pound (GBP) and the US Dollar (USD), two of the most influential global currencies. Today's upcoming news for GBP includes the Halifax Bank of Scotland's House Price Index (HBOS HPI), which, if higher than anticipated, may positively affect the Pound by indicating strength in the UK housing sector. Additionally, traders await the Bank of England's Monetary Policy Report and MPC vote data, which provide critical insights into future UK monetary policy and economic conditions. From the US, the focus is on weekly jobless claims, labor productivity, and wholesale inventories, which will indicate economic health and impact USD valuation. Hawkish statements from Federal Reserve speakers or better-than-expected employment data may strengthen USD in the short term.

Chart Notes:
• Chart time-zone is UTC (+03:00)
• Candles’ time-frame is 4h.

Analyzing the GBP/USD H4 chart, price action currently struggles within the daily cluster zone, now forming a "three soldier" bullish candlestick pattern aimed at testing the descending resistance trend line. Market momentum clearly indicates a bullish bias, supported by the apparent completion of a 5-wave Elliott pattern, signaling potential short-term bullish breakout opportunities. The RSI indicator, trending above 60 with evident bullish divergence, further backs the strength of this bullish outlook. Additionally, the Stochastic oscillator, with both lines above 80, indicates overbought conditions, suggesting strong buying momentum that could sustain upward movement temporarily. Meanwhile, the Bollinger Bands show price currently near the upper band, suggesting continued bullish volatility and potential short-term upside.

•DISCLAIMER: Please note that the above analysis is not an investment suggestion by “Capitalcore LLC”. This post has been published only for educational purposes.

Capitalcore
 
JAP225 Nikkei 225 H4 bullish continuation

JAP225—better known as the Nikkei 225 or simply “Nikkei”/N225—is Japan’s blue‑chip equity benchmark and a popular index CFD alongside JPY forex pairs. Because exporters dominate the index, the price action often moves inversely to the Japanese yen. Fundamental outlook today: traders will watch Statistics Bureau Household Spending, BoJ Bank Lending, the Ministry of Finance Current Account, and the Cabinet Office Eco Watchers Index. Stronger‑than‑forecast readings typically boost JPY, which can weigh on JAP225 as a firmer yen pressures exporters, while softer spending and lending or a subdued Eco Watchers print (below 50) tend to weaken JPY and support the Nikkei 225. A wider Current Account surplus would also favor the yen; conversely, any hint of policy caution from the BoJ would keep yields suppressed and bolster risk appetite. In short, upbeat data risks a pullback in the JAP225 daily chart; softer data keep the uptrend intact toward resistance. This blends fundamental analysis with the price action bias for today’s session.

Chart Notes:
• Chart time-zone is UTC (+03:00)
• Candles’ time-frame is 4h.

After hitting the lower boundary of the ascending channel in H4 timeframe, price rebounded and is now pressing the upper Bollinger Band near 41,200–41,400, signaling strong momentum but also proximity to resistance. The chart shows a mild bullish RSI divergence between recent swing lows; RSI is 62, consistent with a constructive trend that is not yet overbought. Stochastic has both lines above 80, so short‑term overbought conditions may cause brief pauses, but momentum remains positive while price holds above the rising trendline around 40,800–40,400 and the prior demand zone near 40,000. A clean push through 41,800–42,000 targets the previous high zone at ~41,950, with a secondary objective at the channel midline higher up (roughly 42,200–42,400 depending on slope). Failure to hold the 40,800 area would expose 40,000 and the deeper support near 38,799. This JAP225 H4 technical analysis supports a buy‑the‑dip bias within trend while respecting overbought signals.

•DISCLAIMER: Please note that the above analysis is not an investment suggestion by “Capitalcore LLC”. This post has been published only for educational purposes.

Capitalcore
 

Create an account or login to comment

You must be a member in order to leave a comment

Create account

Create an account on our community. It's easy!

Log in

Already have an account? Log in here.

Similar threads

Users Who Are Viewing This Thread (Total: 1, Members: 0, Guests: 1)

Top