What's new

RoboForex - Forex Broker: overview and news

4.60 star(s) 7 Votes
Dear dividends,

Kindly write address this issue to Dealing department using the ticket system in your Members Area. They will help you.
 
Dear badlata,

RoboForex processes the withdrawal request within two business days, but usually, it happens faster. More than 70% of withdrawal requests are processed instantly. But sometimes the payment system itself can take 1-10 days to complete the transaction. If you need more detailed answers, you can always contact the Support Service of our company through a ticket from your Personal Account.

Regards,
RoboForex
 
3 Stocks that Can Grow This Autumn

Author: Eugene Savitsky


Dear Clients and Partners,

The stock market cannot live without tart topics; investors always need something to anticipate. An increase in the interest rate? Uncertainty is really tiresome. Inflation? Jerome Powell told us not to worry, and we shall not for the time being.

What is left? Well, autumn is coming, and this means the number of respiratory diseases will become more frequent. And this, in turn, means COVID-19, only the Delta type.

More people go to hospital in the USA

People’s fears about the new coronavirus type are rather fair. On August 2nd, 10,000 people were put to hospital just in Florida and Louisiana, which is the absolute high since the beginning of the pandemic. This did not lead to a new quarantine yet, but wearing masks is now a must. Healthcare workers also fall ill, and this makes things even more complicated because there is a personnel shortage in healthcare institutions. The government is calling for total vaccination.

If earlier there used to be more elderly people among those put to hospitals, these days younger people, i.e. the active part of the population, fall prey to the virus more often. This might turn out to be a bad influence on business.

Should we wait for a crisis in autumn?

Will lockdowns of last year repeat themselves? I quite doubt this. What would they need vaccination, otherwise? Will they admit that it was a waste of money?

It would be too simple. Stocks would fall by 50-80% again. Investors would rush at buying them, knowing what was to follow, and absolutely everyone would make money. Like fun.

Each new crisis goes by a scenario that never came to life before, and the repetition period is much longer than a year.

Zoom Video Communications shares are growing

So, do investors indeed fear a new wave of COVID-19? Yes, they do. The media are speculating on this all the time, making market participants nervous.

The most prominent beneficiary of COVID-19 in 2020 was Zoom Video Communications, Inc. (NASDAQ: ZM). The last steep growth of its stocks from 350 to 400 USD was propelled by the expectations that the company’s services would become popular again with a new quarantine.


In this chart, we can see the pair sky-rocketing in 2014 due to the Ukrainian events and imposing sanctions on Russia.

The growth lasted for almost 2 years. If the average daily volatility is about 30-50 kopecks, during that period it kept growing, reaching 27 rubles at times. Only the decisiveness of the CB and interest rates lifted by 17% managed to stop this.

Closing thoughts

Information hurricane around the Delta strain will only speed up, and market players will sometimes pay attention to the issuers that have experienced a positive influence of lockdowns.

The worst scenario is a new quarantine imposed, in which case companies that have gone deeper in debt will be threatened bankruptcy, and airlines are most vulnerable here. In autumn, avoid companies deeply in debt and with a small free money flow.

As for delivery services, they have enough money to pay off their debts, buy back shares, and pay dividends. There is always a risk, of course, but there it is minimal.

Read more at R Blog - RoboForex

Sincerely,
RoboForex team
 
Last edited by a moderator:
What Is Russell 2000 and How Does It Differ from S&P 500?

Author: Victor Gryazin


Dear Clients and Partners,

This overview is devoted to a popular stock index Russell 2000: its contents, its differences from the S&P 500, and ways of trading it.

What is Russell 2000?

The Russell 2000 index (US Small Cap 2000) is one of the leading global indices based on the stock prices of 2,000 companies with small capitalization traded in the USA. The index was created in 1984 by the Frank Russell Company, a part of the London Stock Exchange. Russell 2000 is called a wide market index among small companies as it represents stock price dynamics of tier 2 and 3 companies.

The Russell family consists of several indices, the most famous of them being:
  • Russell 3000 is an index based on the stock prices of 3,000 largest public companies registered in the USA. Their overall capitalization makes up for 97% of the American stock market.
  • Russell 2000 is an index consisting of 2,000 smallest companies of the Russell 3000 index.
  • Russell 1000 is an index that tracks 1,000 stocks with the highest rating from Russell 3000.
Russell 2000 is the most popular index among investors who hold shares of companies with small capitalization. Investors usually track this index to assess the market efficacy of small enterprises, mostly working for the domestic market. As long as there are so many companies in the index, your portfolio automatically diversifies.

Leading companies of Russell 2000 include startups in the spheres of healthcare, food, and consumer goods. Russell 2000 is calculated based on capitalization-weighed stock price of all the companies in it. The index gets revised every year, some companies being removed from and some added to it.


How does Russell 2000 differ from S&P 500?
  • The number of companies: S&P 500 uses the shares of 500 largest companies, and Russell 2000 – the shares of 2000 smaller ones.
  • Capitalization of companies: S&P 500 tracks the leading companies; it is meant for investors who hold the shares of large enterprises. Russell 2000 demonstrates the state of affairs in small companies; it is meant for investors who hold small but promising shares in their portfolios.
  • Volatility: depending on the current market conditions, the volatility of S&P 500 and Russell 2000 may differ. At certain times, one index demonstrates better volatility, while the other comes to the scene as soon as the situation changes.
  • These two indices have both differences and common features. S&P 500 is a wide market index that includes companies with the highest capitalization, while Russell 2000 is a wide market index with a low capitalization. The main differences are as follows:
On the whole, regardless of all the differences, S&P 500 and Russell 2000 have been showing similar dynamics.


How to trade Russell 2000

First of all, Russell 2000 is a most popular investment instrument but it can be used for short-term trading as well. Thanks to a wide range of instruments (ETFs, futures, options, CFDs) for trading Russell 2000, different strategies may be used.

Read more at R Blog - RoboForex

Sincerely,
RoboForex team
 
Russel method can be applied on currencies i read your message it's seem interesting because i never ruseel method for trading
 
How to Trade by Day-Hour Strategy?

Author: Andrey Goilov


Dear Clients and Partners,

Looking for signals on larger timeframes and then confirming them on smaller ones is quite a widespread strategy. Even in John Bollinger’s book on graphic patterns traders looked for graphic patterns in D1 charts and then switched to other TFs to wait for the same patterns to appear on them.

The Day-Hour trading strategy is exactly such a way of medium-term strategy, by which the trader searches for entry points on daily charts, then opens an H4 and assesses the strength of the signal on it. However, you do not need to look for any graphic patterns, as this type of trading is highly subjective: one trader sees one pattern, while another trader can see an absolutely different one at the same place of the chart.

By this strategy, the trader only cares for signals from technical indicators. This makes trading completely objective.

Which indicators to use for Day-Hour?

This strategy requires use of indicators. The first one is the usual Moving Average. The indicator is easy to use:
  • If the price is above the Moving Average, then the trade is bullish, hence look for signals confirming the growth;
  • If the price has dropped under the MA, the trend is bearish, and you need selling ideas.
The other two indicators used in the strategy are oscillators: the MACD and RSI.


Most often, traders use a trend indicator and one or more oscillators to look for signals that confirm the trend.

All in all, add to the chart the following indicators:
  1. Moving Average (3). The “shift” parameter is also at 3. The line will be shifted three candlesticks to the right. This indicator is necessary on the daily chart.
  2. The MACD with the parameters 12, 120, 5. This is an indicator fir H4.
  3. The RSI with period 9. The overbought level is 70 and the oversold area is 30. This oscillator is also for H4.
All these indicators can be found in the standard settings of MetaTrader 4, MetaTrader 5, or R Trader. This is a huge advantage as you do not need to download or install anything extra.

Closing thoughts

The Day-Hour strategy is meant for trading the trend, as one of the main traders’ rules goes. For a decent market entry, the strategy implies analyzing both D1 and H4 of the instrument. This method decreases risks and gives a chance a catch a good movement on the D1.

The drawback of the strategy is that it remains valid only when there is a good movement on the chart. When the price is in a flat, the trader will constantly be seeing breakaways of the MA up and down, which might entail a series of bad trades. On the other hand, opening a position by a trend that is just beginning, you never know what levels it might reach.

Read more at R Blog - RoboForex

Sincerely,
RoboForex team
 
RoboForex: important information relating to the .DE30Cash (GER30) instrument


Dear Clients and Partners,

We’re informing you that the formation principle of the German stock index, which is represented in our platforms as .DE30Cash and GER30, will be changed. Starting from September 20th, it will consist of 40 assets instead of 30 assets earlier.

Changes in MetaTrader 4/5 platforms

On September 18th-19th, .DE30Cash and DE30Cash will be switched to the "Close Only" mode in MetaTrader 4 and MetaTrader 5 platforms. All pending orders in these instruments will be deleted. At the same time, "Stop Loss" and "Take Profit" levels in open positions will remain intact.

If you have open positions in these instruments, you need to close them before December 30th, 2021. All positions that remain open at the end of the trading session on December 30th, 2021, will be closed during the trading session on December 31st, 2021, at the quotes valid at that moment.

Starting from September 20th, 2021, instead of .DE30Cash and DE30Cash, you will be able to trade .DE40Cash and DE40Cash respectively. Please consider this information when planning your trading activity and reconfigure trading algorithms affected by the above-mentioned changes.

Changes in the R StocksTrader platform

In the R StocksTrader platform, the existing instrument, GER30 will be renamed to GER40 on September 18th-19th and it will affect both new and open positions. Starting from September 20th, the instrument will be available for trading as usual.

Sincerely,
RoboForex team
 
Best Short-term Strategies: GBP/JPY Range

Author: Andrey Goilov


Dear Clients and Partners,

Trading GBP/JPY might be quite tricky because it is so volatile: its average volatility range exceeds 100 points. However, closer to the Asian trading session the market calms down and sometimes forms a range, pushing the pair out of it by the main trend.

A short-term strategy called GBP/JPY Range uses no indicators; it includes pending orders which shortens your time in front of the terminal. Moreover, working by the strategy, the trader does not choose or forecast the market direction but simply follows the price.

The article is devoted to the idea of this strategy, its trading principles, and to generally checking whether the authors of the strategy have managed to pacify such a volatile pair.

Description of GBP/JPY Range

For trading by the strategy, we use the M15 chart of the GBP/JPY pair. Stick to the closing time of the American and opening time of the Asian sessions. This is 23:00-02:00 terminal time.

Draw horizontal lines through the high and lows of the price in the mentioned timeframe. Then place pending orders for breakaways a bit higher and lower than the drawn levels. If one order gets triggered, delete the second one. If none is triggered over 4 hours, delete both and try again on the next day.

Note that the narrower the corridor, the less it is possible that a strong movement will develop. If the range is quite wide, it is unlikely that the movement will continue after the breakaway. In practice, higher volatility changes for lower, then for higher, and over and over again. It is important that we notice low volatility to catch higher volatility later.

If the channel is wide, volatility is high, hence, there will be no movement after the breakaway. By the rules of the strategy, if the channel is over 70 points wide, you should not trade.

Selling by the GBP/JPY Range

As an example of a selling trade, let us take a breakaway of the channel downwards. We mark the beginning of the channel at 23:00 (11 p.m.); the low of the channel is at 152.74, the high is around 152.86. At 03:00 (3 a.m.) the lower border of the channel was broken, and the price went down. Place a Take Profit at the level of two ranges. This time, the movement was strong and triggered the TP at 152.50.


In this strategy, we need a Sell Stop pending order as it opens a selling position below the current market price. By the strategy, we must place it 2 points below the low of the range. In our case, it is 152.72.


Place a Stop Loss behind the high of our range to avoid random price movements against our position. Hence, we place it at 151.95.

Read more at R Blog - RoboForex

Sincerely,
RoboForex team
 
How to Trade Morning Star and Evening Star?

Author: Maks Artemov


Dear Clients and Partners,

This overview is devoted to two reversal candlestick patterns: Morning Star and Evening Star.

These two are definitely rare visitors to charts, yet they remain quite popular. Like other reversal patterns, the Morning and Evening Stars form at the highs and lows of the price and contain three candlesticks each.

How does a Morning Star form?

This pattern forms at the lows of the price chart. When a descending impulse is going to subside, the price makes a minor surge upwards, so that the candlestick opens and closes with a gap.

Conditions required for the pattern to appear:
  1. A support or resistance level;
  2. The first candlestick has a long body of the same color that the current trend is – and small shadows.
  3. The second candlestick opens with a gap, has a small body and short shadows. It may be of the opposite color that the current trend is; in most cases, it has little significance anyway.
  4. The third candlestick opens with a gap and closes above the opening price. It must be of different color than the first candlestick.
Open a position after the third candlestick closes. Place a Stop Loss at the low of the pattern. If you are trading an instrument with a large spread and on a small timeframe, you may add the average spread to the low to compensate for the error.

You may place a Take Profit at the nearest resistance level or as 1:4 to the SL.

A Morning Star looks as follows:


How does an Evening Star form?

An Evening Star appears at the highs of the price chart, and its structure is totally opposite to that of the Morning Star.

Conditions required for the pattern to appear:
  1. A support or resistance level
  2. The first candlestick is ascending; it has a long body of the same color that the current trend is.
  3. The second candlestick has a small body and opens with a gap. The color of the candlestick is irrelevant.
  4. The third candlestick also opens with a gap; its color is opposite to that of the first one, and the closing price is below the opening price.
Place an SL at the high of the pattern. As with the Morning Star, you may compensate for the error by placing the SL plus the average spread. The TP belongs to the nearest support level or is at 1:4 ratio with the SL.

Sincerely,
RoboForex team
 
Last edited by a moderator:
What Is Stock Split and How Does It Influence Stock Price?

Author: Victor Gryazin


Dear Clients and Partners,

This article is devoted to such an idea as a split of stocks, its influence on the stock price and on how attractive they are for investors

What is a stock split

A stock split is an increase in the number of stocks of the issuer in circulation that entails a decrease in the stock price but not in the general capitalization. This is a wide-spread market practice, naturally supported by the company's desire to make their expensive shares more affordable to a wide range of investors.

Many actively developing companies are interested in an in-flow of extra money that new investors can bring. However, not every investor can afford promising and expensive stocks.

Hence, to make stocks cheaper and more affordable, the split procedure is run to. As a result, the number of stocks increases and their price drops proportionally. This makes the stocks more affordable to investors.

For example, if a company increases the number of its shares five times, i.e. carries out a split of 5:1, investors can have 4 extra shares per each they already have.

At the same time, the price of one share decreases proportionally: if initially a share cost $1,000, after the split it will cost $200. Hence, each shareholder of this issuer will have 5 times as many shares but their total price will not change.

Critical points of stock splits

The split coefficient that shows how much the number of stocks changes after the procedure, is normally anything between 2:1 and 10:1. In the split procedure, there are three main dates:
  • The day of announcement. To get started, the company makes a public announcement of its plans for a stock split and all the details that investors need to know. This information usually includes the split coefficient and the day when the split is to happen.
  • Register closing day: this is an important day when the list of the company's shareholders is settled. These people will get extra shares after the split.
  • The split day is the day when new stocks appear on the investors' broker accounts and start trading at the new price.
What is a reverse split?

There is another procedure known as the reverse split that also changes the number if stocks in portfolios. It is also called stock consolidation.

By this procedure, the stocks that investors hold are changed by a proportionally smaller number of stocks. For example, a reverse split of 1:3 makes every three shares into one. This means that if you used to hold 30 shares of the company, after a stock consolidation you will have only 10 but the price of each share will grow three times.

For example, if the stocks did horrible, trading low under a dollar, a reversed split can raise their price.

How does a split influence the stocks and investors?

On the whole, a stock split is interpreted as a good event for the issuing company, though it does not influence its capitalization directly. A split means that the company is developing, doing well, and the growth of its shares confirms it. Carrying out a split, the company signals that it wants to make its shares more attractive and affordable to private investors.

A decrease in the price makes the shares more affordable to investors and more liquid. The history of splits shows that the growth of stocks after a split usually exceeds the growth of major stock indices. Hence, after a split, the portfolio of an investor can have a significant profit, if the shares keep growing.

Read more at R Blog - RoboForex

Sincerely,
RoboForex team
 
I have serious problem i place my withdraw request on 4th OCTOBER, so yet not process. what time it can be complete my acc
 
RoboForex wins prestigious awards in the financial sector


Dear Clients and Partners,

We’ve always tried to maintain the high level of the services we provide and introduce pioneer products. Our efforts were not for nothing – they were recognised with prestigious awards of the financial industry: "Best Investment Products (Global)" at Global Brands Magazine Awards, "Most Trusted Broker – Global" according to International Business Magazine Awards, "Best Multi-Asset Trading Platform (LatAm)" and "Best Prime Trading Account (Asia)" at Global Banking & Finance Awards.


Counting these awards, the total number of titles received by RoboForex has reached 30. However, the most valuable and precious award for us is the trust of our clients and partners, who has been choosing our company for cooperation for 11 years now. We truly appreciate your trust and are very thankful for the choice you made.


Sincerely,
RoboForex team
 
Last edited by a moderator:
How to Filter Stochastic Signals?

Author: Andrey Goilov


Dear Clients and Partners,

We already have two articles about the Stochastic Oscillator describing in detail the indicator itself and the ways of trading by it. This is an oscillator, i.e. it demonstrates how much the price has fluctuated from the average; it works great in flats.

If there is a strong, directed trend, such an indicator will give a lot of reversal signals, making the trader buy in the falling market and sell in the growing one. Hence, traders do not normally use Stochastic by itself: instead, they add other signals to it, enhancing the work of the indicator significantly.

Today, I will try to step beyond the boundaries of normal trading by the instrument and show you how to filter its signals in order to make money on lengthy trends.

Some history

The necessity to track indices appeared as early as the 20th century. In 1925, at the International Conference of Labor Statisticians, certain rules of data collection, processing, generalizing, and presenting were adopted. The importance of such information was acknowledged by all the participants of the conference.

Also, at the Conference, a universal approach to planning and regulating price policies of countries was worked out. Practically, these were the first steps towards globalizing international markets.

The standards created that time were revised three times later: in 1947, 1962, and 1987. In 1962, at the tenth Conference, the term PPI was finally adopted. This is exactly the term used today.

Moving Average

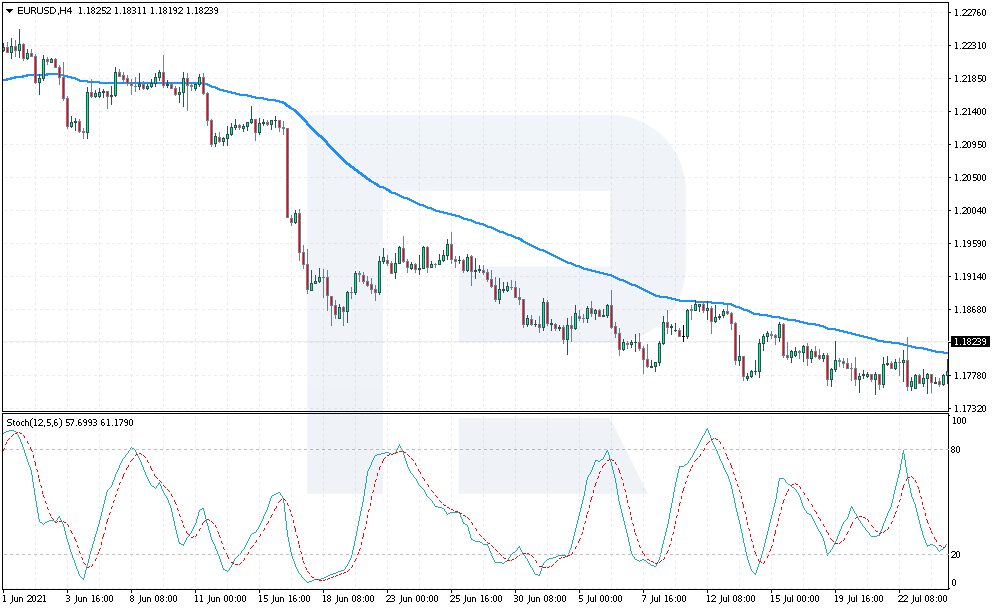
I guess, the best way to improve signals from Stochastic is to add a Moving Average to it or several such lines. This combination lets the trader work by the current trend.


For trading, an H4 or H1 chart of any currency pair will be good. Add an MA with period 75: if the price is above the line, we look for a signal to buy from Stochastic. If the price breaks through the MA downwards, the trader needs a signal to sell from Stochastic.

A signal to buy

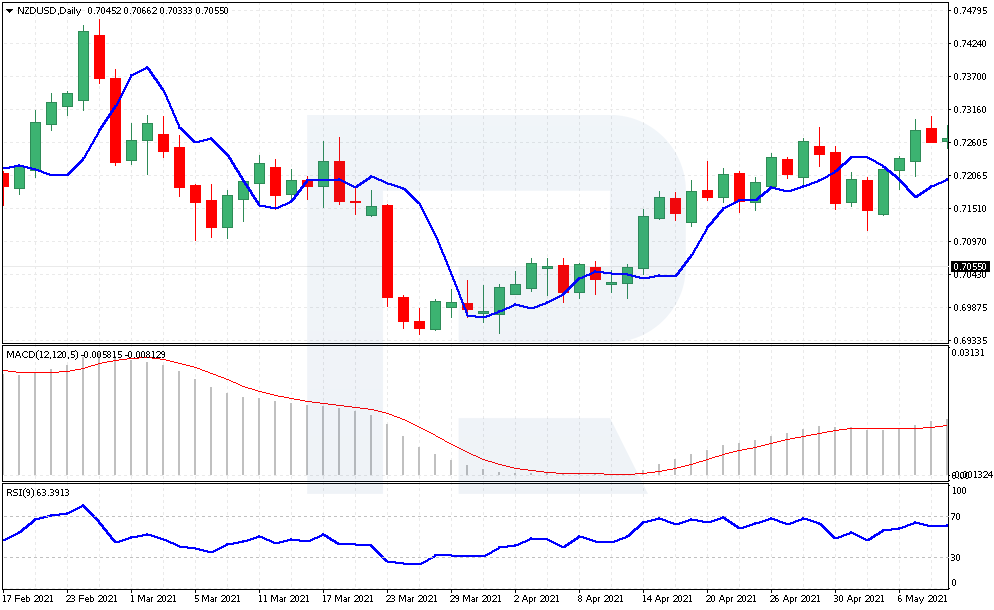
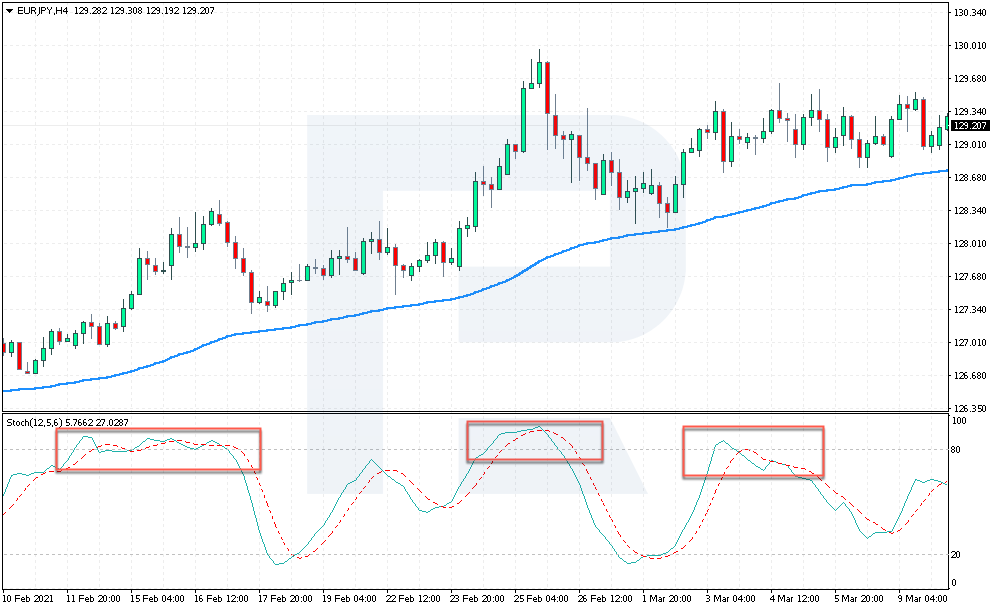
Let us have a look at an example with EUR/JPY. We see the price go above the MA(75), indicating an uptrend. In this case, we are not interested in signals to sell, because the Stochastic values may stay above 80 for a long time and quite often perform crossings for sale. Such signals must be ignored.


The best signal will be a decline of the Stochastic values below 20 and crossing of this area. In the marked area, there were two such signals, and both times the market kept growing.

A Stop Loss in such a case must be placed 35-55 points away from the MA. As for a Take Profit, place it at least at the local high because the trend is ascending, and the price will easily renew it.

However, if the price breaks through the MA downwards and the signal lines of Stochastic cross in favor of buying, wait for the price to get above the MA again and buy with the same risk of 35-55 points away from the MA.

Bottom line

The Stochastic Oscillator gives too frequent entry and exit signals by the crossings of its signal lines. To improve those signals, you can add other indicators, combine Stochastic with graphic patterns, or check for the confirmation of signals on different timeframes.

Adding a Moving Average to the chart alongside Stochastic will let you trade the trend only. If you add a graphic pattern, you will avoid preliminary signals from the pattern itself. Combining various TFs gives you an extra Stochastic signal from a smaller TF.

As you see, there are plenty of trading options with Stochastic. Just test them all on a demo account and always follow your money management rules, especially when you trade real money.

Read more at R Blog - RoboForex

Sincerely,
RoboForex team
 
Dear Derekshaw,

All withdrawal requests are processed by the company within the time frame and in the manner provided for by the Client Agreement. However, in some cases, the process of sending funds can take a significant time. If you need a more detailed answer, you can always get advice from the Payment Department of our company by creating a ticket from your Personal Account indicating the transaction number of your withdrawal request.

Regards,
RoboForex
 
How to Work with Sources of Information and Avoid Falling A Victim to Market Panic

Author: Vadim Kovalenko


Dear Clients and Partners,

In the era of the Internet and electronic media when information is available to anyone, it’s become easier to fall a victim to a pre-planned information attack. In this article, I want to tell you how to avoid this “doom” when analysing financial news.

When you’re overcome with market panic, you can take wrong investment decisions, which will make you lose potential profit or, which is worse, suffer losses.

From time to time, news media misrepresents a real picture; however, even in these cases, one can eliminate the unlikeliest pessimistic or optimistic scenarios. To be able to do this, one has to be well informed about basic concepts of the nature and special aspects of provided publicly available economic information.

Where should we start?

At first, you have to understand: ordinary people don’t have and will never have an amount of data available to civil servants just because some part of this data is highly classified information. Therefore, one should rely only on public sources.

Economic data implies a set of indicators that display the national economy state or show any changes in all its components. When performing market analysis on one’s own, it is recommended to use only documentary information sources.


Types and sources of information

There are a lot of economic data classifications but we’ll talk only about the most important ones. The data is divided into:
  • Forecasts: short-, mid-, and long-term.
  • Planned: can be found in the economic calendar.
  • Accounting: financial reports, national statistics.
If you’re a rookie in analysing economic indicators, it is recommended to stay away from ready analytical reviews because they are already distorted by the author’s subjective perception. It’s much better to work with primary data. Of course, in the very beginning, you may draw false conclusions but they will be your personal mistakes you’ll learn from. However, sometimes you should read opinions given by popular financial analysts to have a second opinion.

Read more at R Blog - RoboForex

Sincerely,
RoboForex team
 
How to Trade Linear Regression Indicator

Author: Andrey Goilov


Dear Clients and Partners,

The Linear Regression Indicator was designed and presented by Gilbert Raff. It happened quite recently, in the 1990s. So, this instrument can be called a rather new one as long as the majority of indicators have been created in the 1970s.

The Linear Regression Indicator, or LRI, consists of three lines. These lines show the high, medium, and low of the current price movement, forming a price channel. The upper and lower borders of the channel demonstrate the extremes to which the price has deviated from the middle line.


You can see that the indicator somewhat resembles the Bollinger Bands, which consists of a floating channel on the chart that is from time to time broken through by the price up or downwards, after which the price returns to the medium level.


Regardless of the fancy name, the LRI is quite simple to use.

What is the essence of the LRI?

As I have already mentioned, the Linear Regression Indicator consists of three lines.

First, the middle line is drawn based on the price levels; it is also known as the trend regression line.

The indicator adds two lines to the first one at equal distances from it. Traders say those are quality support and resistance levels, between which the price will be going for some time.

Read more at R Blog - RoboForex

Sincerely,
RoboForex team
 
RoboForex wins the “Best Affiliate Programme (Global)” award


Dear Clients and Partners,

In autumn 2021, RoboForex received the “Best Affiliate Programme (Global)” award at one of the world’s leading events in the sphere of Forex and finance, “Global Forex Awards 2021 – Retail”. RoboForex’s Affiliate program was highly appreciated by users and got the most votes.


RoboForex would like to thank everyone who voted for their trust. Such results inspire us and give us a reason for further development and improvement. RoboForex strives to provide traders with the most favourable trading conditions, including the ones that attract new clients to the company. Now it’s time for you to assess them:
  • 50% of the company’s revenue.
  • No restrictions on deals and payouts.
  • Daily payouts to your account.


Sincerely,
RoboForex team
 
How to Trade “Tasuki Gap” Pattern?

Author: Victor Gryazin


Dear Clients and Partners,

In this article, we’ll discuss the rules and methods of trading the “Tasuki Gap” pattern. You won’t find it very often, but it’s a quite strong pattern of trend continuation from the candlestick analysis.

How the “Tasuki Gap” pattern is formed

The “Tasuki Gap” candlestick pattern is formed during an ascending or descending tendency and predicts its further development. The pattern consists of three candlesticks: the first two have the same body colour with a price gap between them; the third candlestick has an opposite body colour and returns the price into the gap (between the first two candlesticks).

The first two candlesticks of the pattern show the trend direction and confirm its strength – the gap between them is evidence of that. The third candlestick, which is closed in the opposite direction, is a correction towards the previous movement. This candlestick shouldn’t eliminate the gap with its closing price – if it happens, trading the pattern is not recommended.

Bearish Tasuki Gap

“Upside Tasuki Gap” is formed during a descending tendency: bears dominate the market and believe that the decline will continue. The black bearish candlestick appears on the chart. Later, under the influence of active sales on the market, the next candlestick is opened with a gap to the downside and closed with a black body candlestick.

After that, the price is forming an ascending correction, during which a white bullish candlestick appears and makes the price return to the gap. This gap is now a resistance level. Here, bears start selling again and if bulls couldn’t close the session above the gap, then bears are very likely to resume the downtrend and update the local low.


Recommendations for trading the “Tasuki Gap” pattern

When trading this pattern, one should pay attention to the following:
  • “Tasuki Gap” must be formed within an ascending or descending tendency, it’s better not to trade it inside a sideways channel (flat).
  • The pattern’s third candlestick mustn’t close the gap completely with its body. In this case, a trading signal is cancelled.
  • The pattern materialization probability increases in the combination with price patterns, support and resistance levels, signals of trading indicators.
  • It is recommended to use H4 of longer timeframes.
Closing thoughts

The “Tasuki Gap” candlestick pattern appears during an ascending or descending tendency (bullish or bearish respectively) and predicts its further development. Excellent addition to the pattern is technical analysis.

Before using the pattern in real trading, one should learn past statistics and historic records and practice on a demo account.

Read more at R Blog - RoboForex

Sincerely,
RoboForex team
 
How to Use the Current Ratio Multiplier for Stock Analysis

Author: Maks Artemov


Dear Clients and Partners,

The Current Ratio multiplier (or Liquidity Ratio) shows a company's or corporation’s ability to pay short-term obligations due within one year. The multiplier is calculated as Current assets/Current liabilities for a particular period of time.

Current Ratio is used by investors, companies’ top management and analysts for both assessing investment attraction of an organization and practical understanding whether a company can satisfy its current debts and other payables.

When a company’s activities result in fewer funds on its balance sheet than required for the performance of financial obligations to creditors or suppliers, then the current liquidity implies the impossibility of debt compliance.

If the situation is reversed and a company has more money on its balance sheet than necessary for paying all its debts and liabilities, its profit significantly decreases because a company keeps the money on its accounts instead of realizing what is earned. In a perfect world, the current liquidity of a company should be balanced.

Calculating the Current Ratio multiplier

Like all other multipliers, Current Ratio for public companies can be found on the Internet, so there is no need to calculate it manually. All you have to do is specify a required value in the stock screener and get the results.

An example from a popular resource finviz.com:


However, for illustrative purposes, let’s look at the Current Ratio calculation formula:

Current Ratio = Current assets / Current liabilities

  • Current assets are the funds involved in a company’s operations and activities that are liquidated during the year (12 months). An increase in assets ratio contributes to a company’s capital turnover. A sudden increase in operating assets may be caused by ineffective activities of a company and lead to, for example, a surplus of products at stock. According to another term, Current assets are just short-term assets because of their quick usage.
  • Current liabilities are a company’s total liabilities to be liquidated within 12 months using current assets only.
The result of this operation (Current assets / Current liabilities) is Current Ratio.

R Blog - RoboForex

Sincerely,
RoboForex team
 

Create an account or login to comment

You must be a member in order to leave a comment

Create account

Create an account on our community. It's easy!

Log in

Already have an account? Log in here.

Similar threads

Users Who Are Viewing This Thread (Total: 1, Members: 0, Guests: 1)

Top
AdBlock Detected

We get it, advertisements are annoying!

Sure, ad-blocking software does a great job at blocking ads, but it also blocks useful features of our website. For the best site experience please disable your AdBlocker.

I've Disabled AdBlock    No Thanks